Key takeaways:
- Climate and nature risk can affect financial outcomes through multiple channels. Physical hazards, policy changes, technology shifts, and ecosystem degradation can affect revenues, operating costs, capital requirements, asset values, and balance-sheet resilience.
- Models help investors compare possible outcomes, not predict a single future. Scenario analysis can show how risks differ across locations, companies, and policy pathways, but the results depend on the underlying data and assumptions.
- Nature-related analysis requires a more local and data-intensive approach. New tools are improving visibility, but fragmented datasets and the location-based nature of biodiversity mean that judgement and company-level research remain essential.
The investment challenge
Traditional financial analysis often begins with historical company data. But climate and nature risks require a broader perspective. Their effects can be location-specific, non-linear, and dependent on future policy, technology, and environmental conditions. Similar assets can therefore face very different risks depending on their location, operations, and the assumptions applied.
The effects are already visible in company financials. Extreme weather can interrupt production or damage operations, while policy and technology changes can alter demand, increase compliance costs, or shorten the useful life of existing assets. Cyclones have disrupted Rio Tinto’s mining, rail, and port operations in Western Australia, while BP has highlighted the impact that changing long-term assumptions can have on the value of energy assets. The transmission channels differ, but the investment implications are familiar: pressure on revenues and margins, higher capital requirements, weaker asset values, and, in some cases, greater balance-sheet strain. Nature-related risks can be less visible but no less relevant, particularly where a company depends on water, productive land, or other ecosystem services.
How we — and Berkeley — think about it
Models are useful because they impose structure on uncertainty. Rather than forecasting exactly what will happen, they allow investors to consider how a company or asset might perform under different combinations of temperature change, policy responses, technology pathways, and physical hazards. The aim is not to remove uncertainty, but to make the underlying assumptions and potential financial effects easier to examine.
Different tools answer different questions. Emissions accounting (Scopes 1, 2, and 3) helps investors understand whether a company’s exposure is concentrated across its own operations, purchased energy, or wider value chain. Because that balance varies widely by sector, understanding where emissions arise and how directly a company can influence them, is often more useful than a headline figure.
Other metrics provide a forward-looking perspective. Climate Value at Risk (CVaR) estimates how physical hazards and transition-related changes could affect a company’s present value under specified scenarios. Implied Temperature Rise (ITR) expresses the alignment of a company or portfolio with a temperature pathway as a single figure. Neither metric is an investment answer on its own: their usefulness depends on understanding the data, methodology, and assumptions behind the headline numbers.
Exhibit 1: How investors use modelled climate risk
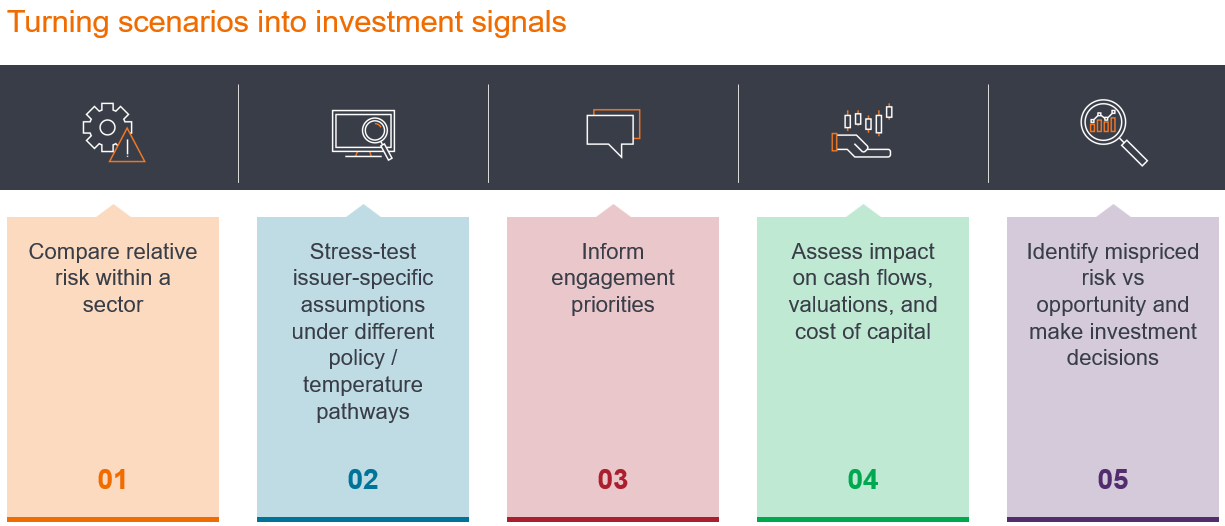
From model output to investment signal. Climate models can help investors compare companies, stress-test assumptions, assess potential financial effects, and focus further research and engagement.
Source: Janus Henderson Investors and UC Berkeley Executive Education
The composition of a modelling result can be more informative than the total. A rapid transition may increase policy and carbon-pricing costs, while a slower transition can leave a company more exposed to physical effects on assets and supply chains. The same headline number can therefore conceal different sources of risk, time horizons, and required responses.
This is why understanding the assumptions behind a model matters as much as the result itself. Models help investors explore uncertainty, but they cannot remove it.
“A climate model is not one right answer. Its value lies in helping investors understand the assumptions, patterns and potential outcomes they might otherwise miss.”
– Dara O’Rourke, Associate Professor, Department of Environmental Science, Policy and Management, Rausser College of Natural Resources at UC Berkeley
In practice
The real test is whether these insights change how investors analyse individual companies and assets.
Listed real estate illustrates why climate risk cannot be understood from sector averages alone. As Nicolas Scherf, Portfolio Manager, Global Property Equities at Janus Henderson, notes, “Buildings are physically anchored to their locations. They cannot be moved, and their value depends heavily on the quality, resilience, and long-term attractiveness of those locations.” Within a single portfolio, exposure to flooding, heat, and insurance repricing can therefore vary considerably. Data can flag vulnerable locations, but engagement helps investors understand how those risks are being managed and what they mean for costs, insurance, and asset values.
At one European shopping centre affected by the 2024 Valencia floods, mitigation and early-warning systems had been installed before the event. Insurance remained in place, and the planned sale of the asset subsequently proceeded, illustrating how well-managed physical risk can protect liquidity as well as operations.
Nature-related analysis presents a different challenge. Biodiversity impacts are often less visible than climate risks and can be transmitted through complex supply chains far removed from a company’s headquarters or reported revenues. Satellite imagery, environmental DNA, bioacoustic monitoring, and other geospatial tools are improving visibility, but datasets remain fragmented and can provide conflicting assessments of the same location.
Exhibit 2: Why biodiversity defies simple global modelling
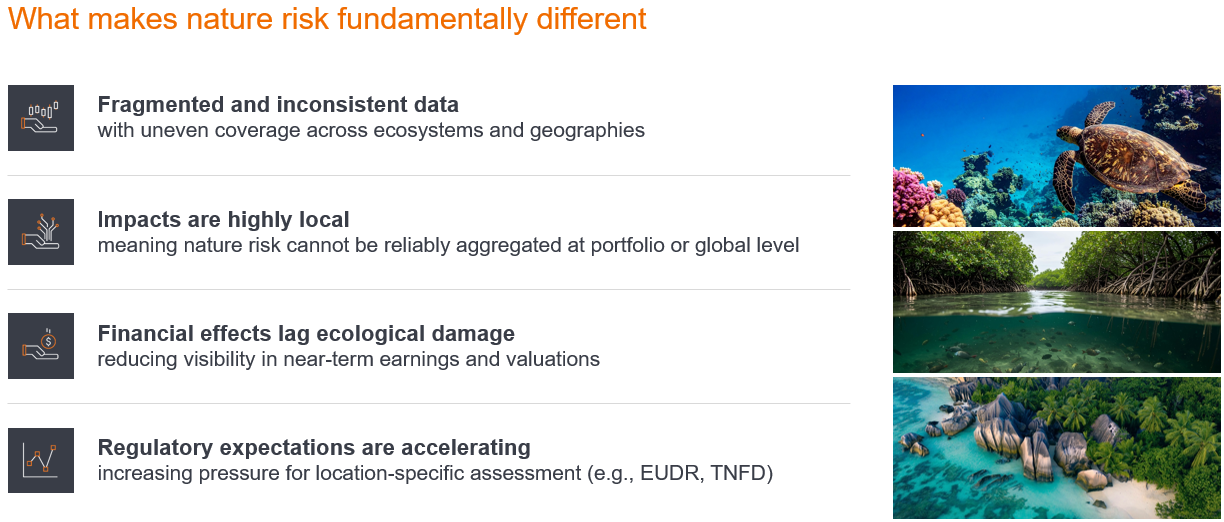
Why nature risk is harder to aggregate. Biodiversity data remains fragmented, impacts are place-specific, and financial effects may emerge after ecological damage has occurred.
Source: Janus Henderson Investors and UC Berkeley Executive Education
In paper and packaging, for example, headline datasets may indicate relatively limited water stress, while engagement provides additional context on constraints at individual operations. Assessing the investment significance requires questions about local conditions, management’s response, and the capital needed to adapt.
Transition risk is similarly company specific. Two airlines operating under the same regulatory regime can face very different financial effects because of their route networks, customer mix, and ability to pass through costs. For example, a short-haul European carrier may have greater exposure to the EU Emissions Trading System than a network carrier with more long-haul routes. Sustainable aviation fuel supply and pricing power then shape how those costs reach earnings.
Sector-level exposure is only the beginning. The investment question is how climate or nature risk interacts with a company’s assets, business model, capital requirements, and financial flexibility. The value of models lies not in producing a definitive score, but in helping investors identify where risk may be mispriced, compare companies more consistently, and focus research on the assumptions that matter most. Used alongside sector expertise and engagement, they can turn complex environmental change into investment-relevant insights today.
What’s next
Measuring risk is only part of the picture. The next question is whether companies have credible plans to respond. In the next article in this series, we consider how investors can distinguish robust transition plans from ambition alone.
Balance sheet: A financial statement that summarises a company’s assets, liabilities, and shareholders’ equity at a particular point in time. Each segment gives investors an idea as to what the company owns and owes, as well as the amount invested by shareholders. It is called a balance sheet because of the accounting equation: assets = liabilities + shareholders’ equity.
Biodiversity: The variety of living organisms, including plants, animals, and ecosystems, and the ecological relationships that support environmental resilience and economic activity.
Capital expenditure (CapEx): Money invested to acquire or upgrade fixed assets such as buildings, machinery, equipment, or vehicles in order to maintain or improve operations and foster future growth.
Cash flow: The net balance of cash that moves in and out of a company. Positive cash flow shows more money is moving in than out, while negative cash flow means more money is moving out than into the company.
Carbon emissions: The tonnes of carbon dioxide equivalent per million USD of total revenue, on a Scope 1 & 2 basis. For companies that do not report figures, emissions are based on proprietary estimation models.
Climate Value at Risk (CVaR): A measure that estimates how climate-related physical and transition risks could affect the present value of a company or asset under different climate scenarios.
Ecosystem services: The benefits that nature provides to people and businesses, such as clean water, fertile soil, pollination, flood protection, and climate regulation.
Implied Temperature Rise (ITR): A metric that indicates how closely a company or portfolio aligns with a future global temperature pathway, expressed as a temperature outcome.
Physical risk: Risks arising from the direct impacts of climate change, such as floods, storms, heatwaves, droughts, and rising sea levels.
Pricing power: A company has pricing power when it can raise prices regardless of the economic backdrop and not lose out to competitors.
Scope 1 emissions: Direct emissions from owned or controlled sources.
Scope 2 emissions: Indirect emissions from the generation of purchased energy.
Transition risk: Financial risks arising from the shift to a lower-carbon economy, including changes in policy, regulation, technology, market preferences, and carbon pricing.
Value investing: An investment approach that seeks to identify securities that appear undervalued relative to their intrinsic worth.