
Key takeaways:
- The recent rise in delinquencies in the office real estate sector is being driven by a mix of higher rates, refinancing risk, and shifts in working patterns.
- Investor outcomes, however, are widely bifurcated, as stresses within the market are most acute for older, commodity-like buildings with weaker tenant demand, while trophy assets in top markets (such as New York City) are seeing strong attendance, leasing, and rent trends.
- Commercial mortgage-backed securities (CMBS) remain a valuable portfolio allocation that can enhance diversification, support income generation, and help manage risk within core fixed income portfolios. However, the current environment creates both risk and opportunity for investors and highlights the importance of active management when investing in CMBS.
Rising office delinquencies within commercial mortgage-backed securities (CMBS) reflect genuine pressures from shifting work patterns, higher interest rates, and greater refinancing risk.
Since 2022, office delinquency rates have risen from 1.6% to over 12% in 20261 under the strain of increased financing costs and changes in structural demand brought on by the lasting impact of remote and hybrid work models.
Exhibit 1: Historical aggregate CMBS vs. office delinquency rates (2007-2026)
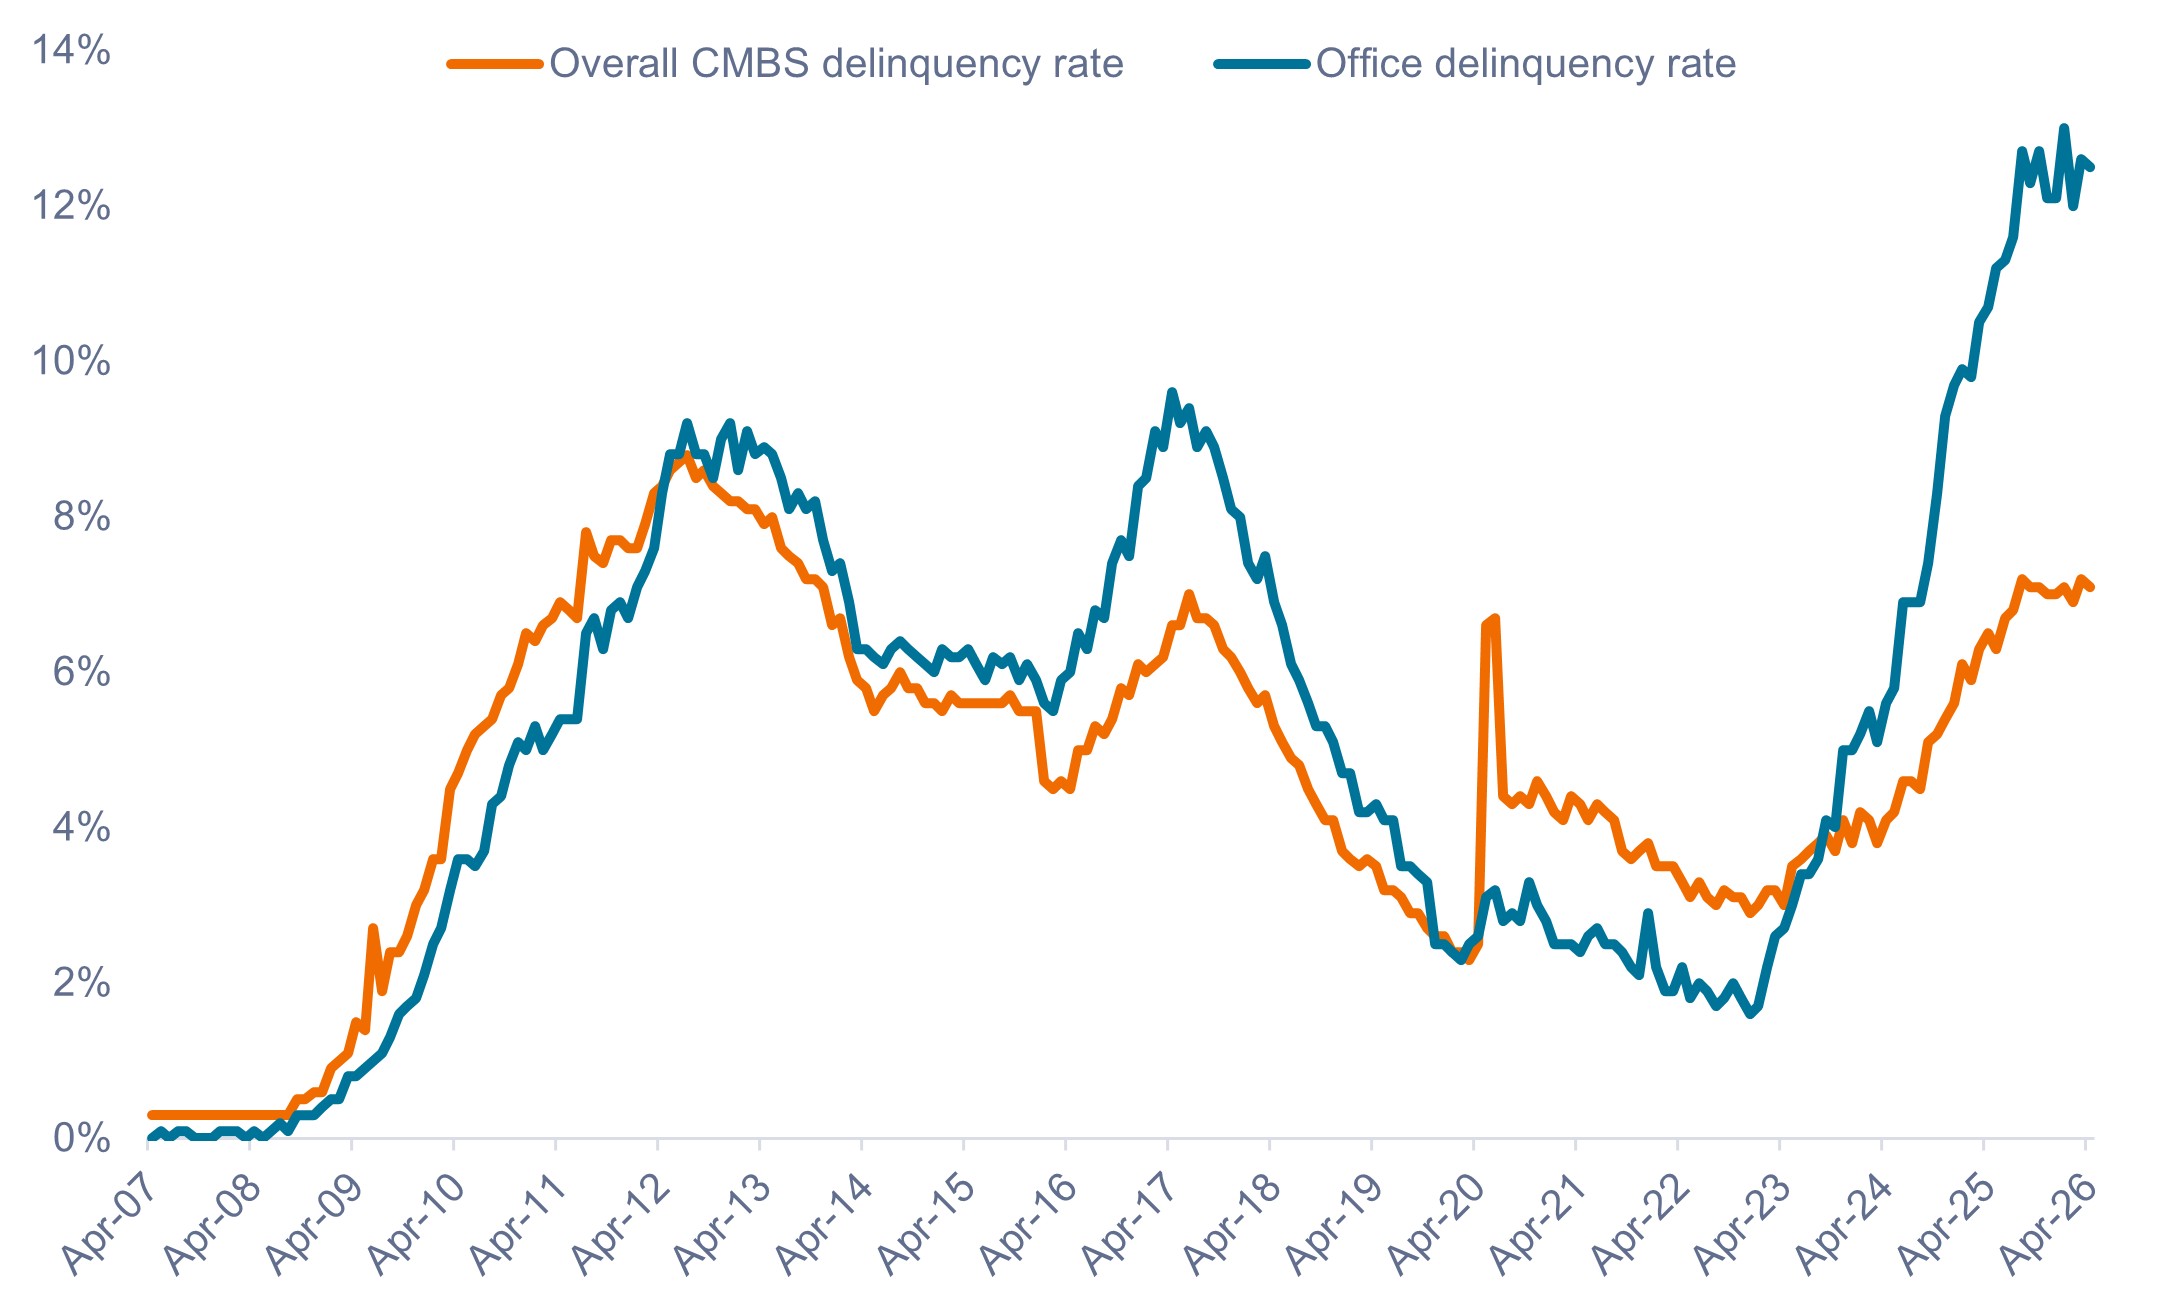
Source: Intex, as of 1 April 2026. Delinquency rates include 30+ days past due, FC (foreclosure), REO (real estate owned), and non-performing matured ballons.
While delinquencies are likely to remain elevated in 2026, performance varies from one building to another. “Trophy2-quality” assets in major markets have been reporting stronger occupancy levels, particularly in cities benefiting from artificial intelligence-related hiring. Additionally, office-to-residential conversion activity is helping reduce obsolete supply while historically low levels of office space under construction is gradually improving fundamentals, particularly for prime assets.
New York City: Back in business
In one of the clearest real-world examples of how return-to-office trends are translating into occupancy gains and stronger asset-level performance for premier properties, the New York City (NYC) office sector continues to outperform the national average and ranks second among major U.S. markets for top-tier office attendance, behind only Miami.
Exhibit 2: Office attendance by market, top-tier buildings (Jan 2026)
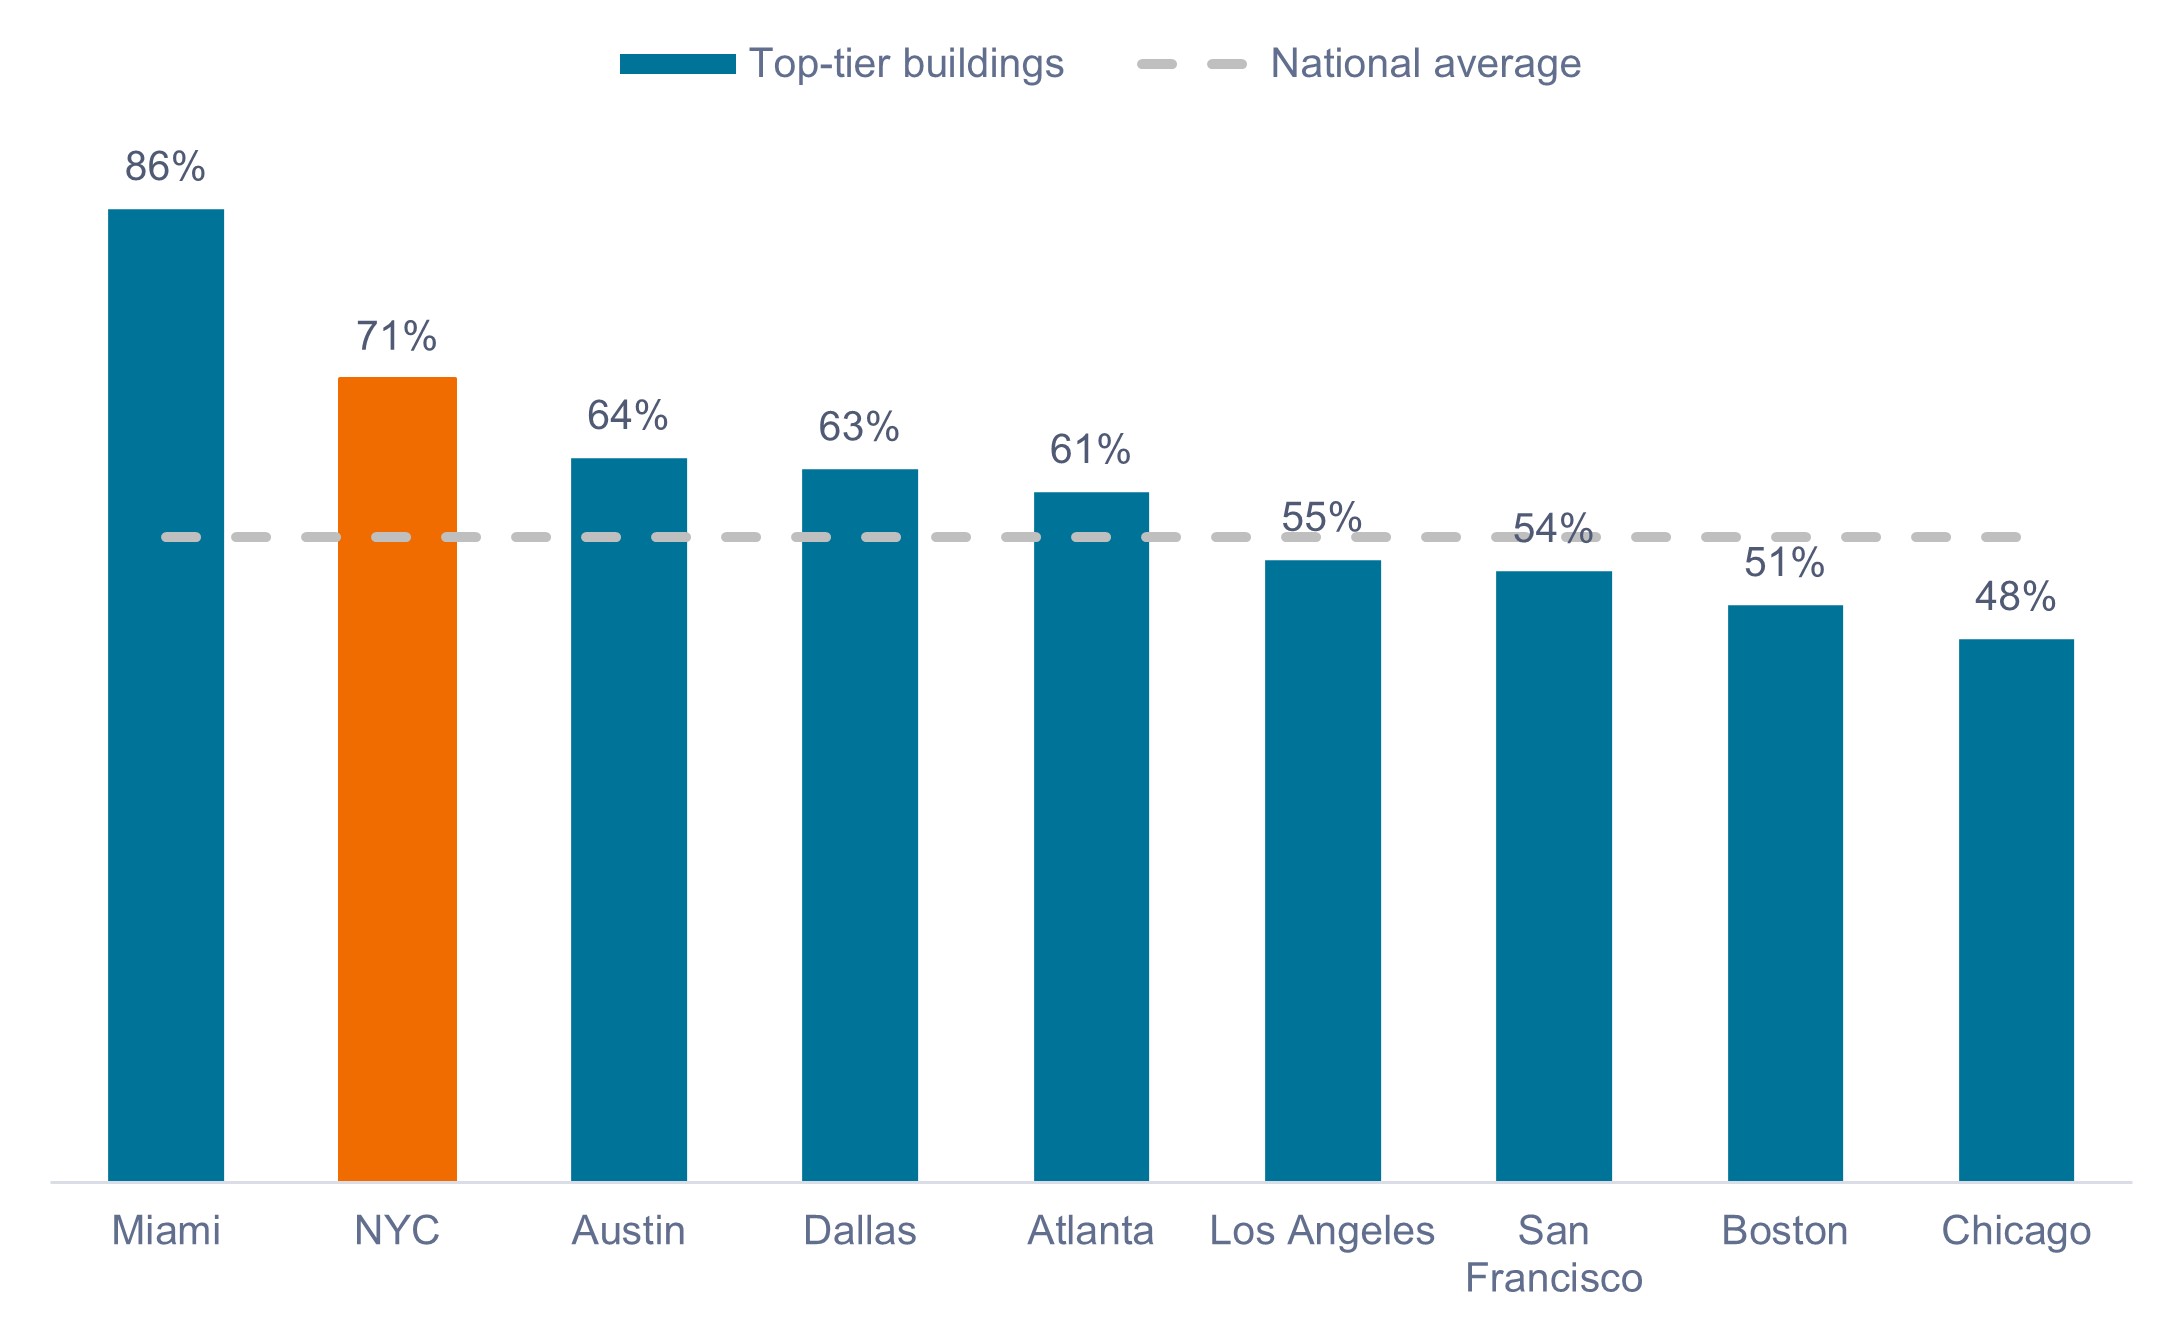 Source: Placer.ai, as of 31 January 2026.
Top-tier buildings in NYC are now approaching their pre-COVID attendance norms at around 70%+ attendance. As a result, performance has diverged sharply between well-located trophy assets with strong tenants and older, less-competitive buildings. Best-in-class offices in top markets like Manhattan are leasing and attracting capital, while lower-quality assets in weaker markets face accelerating valuation pressure.
This dynamic flows directly into CMBS outcomes, making asset-level underwriting far more important than broad sector labels and illustrating how local strength can exist alongside national weakness.
In an environment where dispersion continues to widen, active CMBS management is less about avoiding office altogether and more about owning the right office exposure.
Exhibit 3: Office attendance: Nationwide vs. NYC (Jan 2020 – Jan 2026)
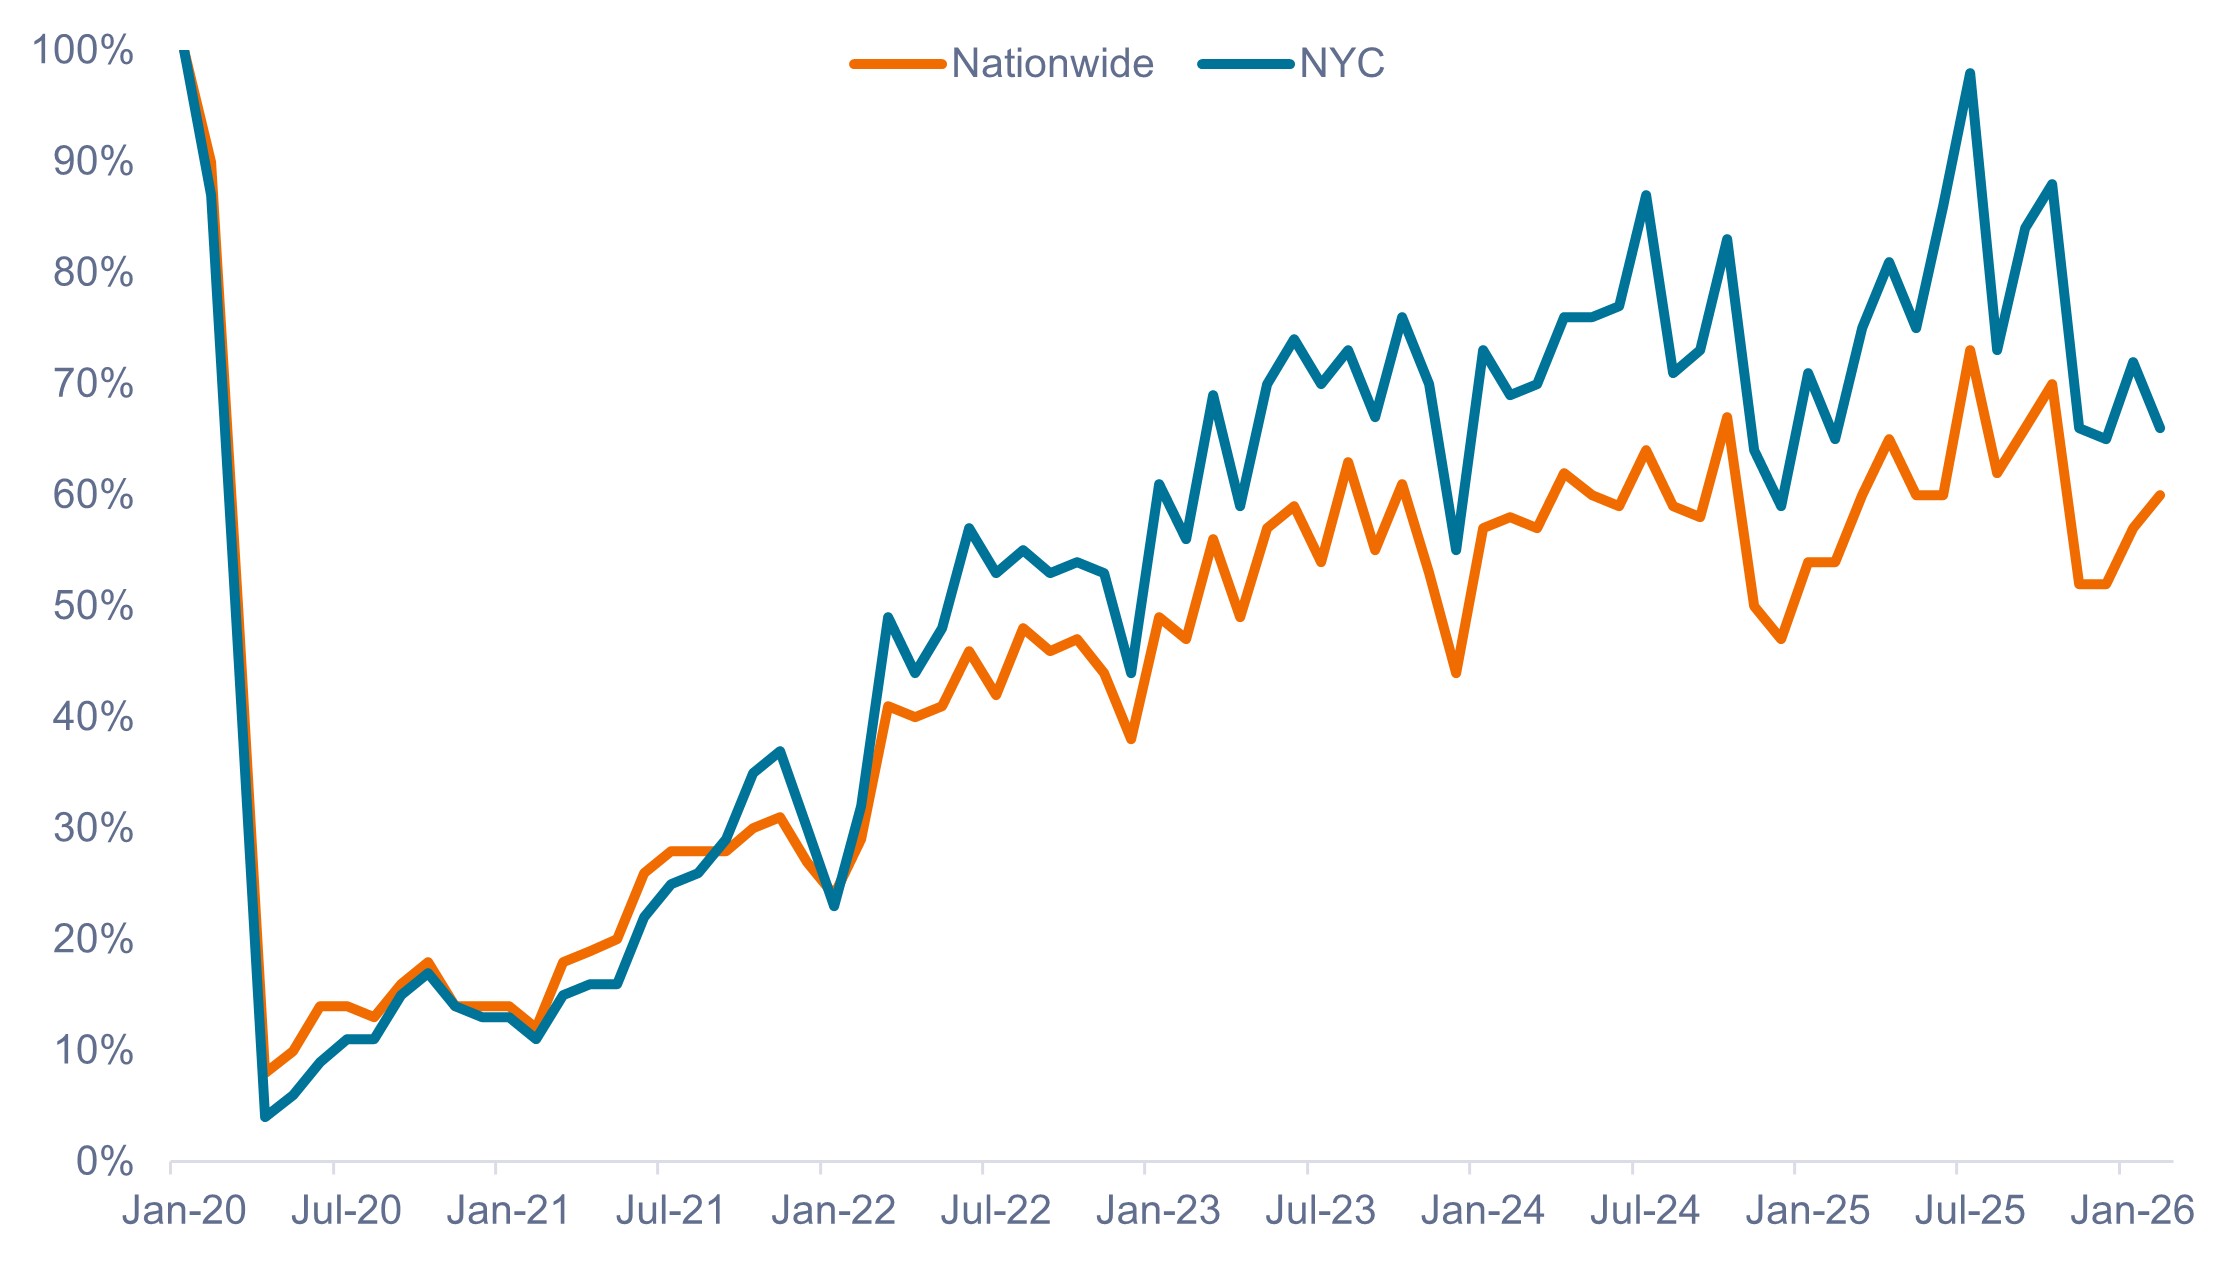
Source: Placer.ai, as of 28 February 2026.
At the top end of the market, NYC leasing activity totaled 8.9 million square feet in Q1 2026, in line with last year’s record pace and well above long-term averages. In our view, several trends stand out as a result:
- Minimal large-scale office delivery is expected before the end of the decade, reinforcing pricing power for well-located assets.
- Rents are rising where quality is scarce. Average Manhattan asking rents moved higher over the past two years and are now 10% above their pre-pandemic rates, with Q1 2026 average rents reaching approximately $166 per square foot, including record-setting leases.
- Flight to quality remains dominant. While overall vacancies continue to decline, trophy assets now exhibit ~6.3% vacancy (vs. 15.7% for Class B locations), which is near pre-pandemic levels as tenant demand increasingly concentrates in modern, amenitized buildings. In some neighborhoods, such as Midtown Manhattan, prime vacancy rates fell to just 2.9% in Q1 2026, according to CBRE Research.
- Large occupiers are driving absorption. Financial services and technology firms are leasing space at an accelerating pace and favoring newer developments in Midtown, Midtown South, and select Downtown NYC locations.
“Diworsification” does not equal diversification
Conduit CMBS transactions, which contain heterogeneous collateral with multiple borrowers, are often perceived as less risky because investor exposure is statistically diversified. But, in our view, this can make it difficult to carve out less desirable office exposure in a divided market. In our view, the more bifurcated the office sector becomes, the less useful pooled exposure is to investors.
In contrast, single-asset single-borrower (SASB) transactions may provide more bespoke exposure with wider credit spreads as compensation for concentration risk. For example, recent AAA SASB office transactions have been issued with spreads ~20 to 25bps wider than conduit office transactions. This divergence underscores why active management is essential and how negative sentiment toward “office” in general has created attractive entry points for securities backed by high-quality properties.
Office is only one component of the CMBS universe, which is diversified across multiple property types, including multifamily, industrial, lodging, retail, self-storage, data centers, life sciences, and other specialty assets. Many subsectors are supported by secular demand tailwinds. Importantly, these sectors respond to different economic cycles (housing supply, trade flows, travel, consumption etc.), which can help reduce risk at the portfolio level.
While corporate spreads tend to widen rather quickly with macro-related stress, CMBS senior bonds often experience lagged or muted price responses, lowering correlation during risk-off periods. As a result, the Bloomberg Investment Grade CMBS index has exhibited negative correlation to the S&P 500® Index over the past 10 years, making its inclusion an excellent diversifier in multi-asset portfolios.
Exhibit 4: Asset class correlations to S&P 500® Index (2016-2026)
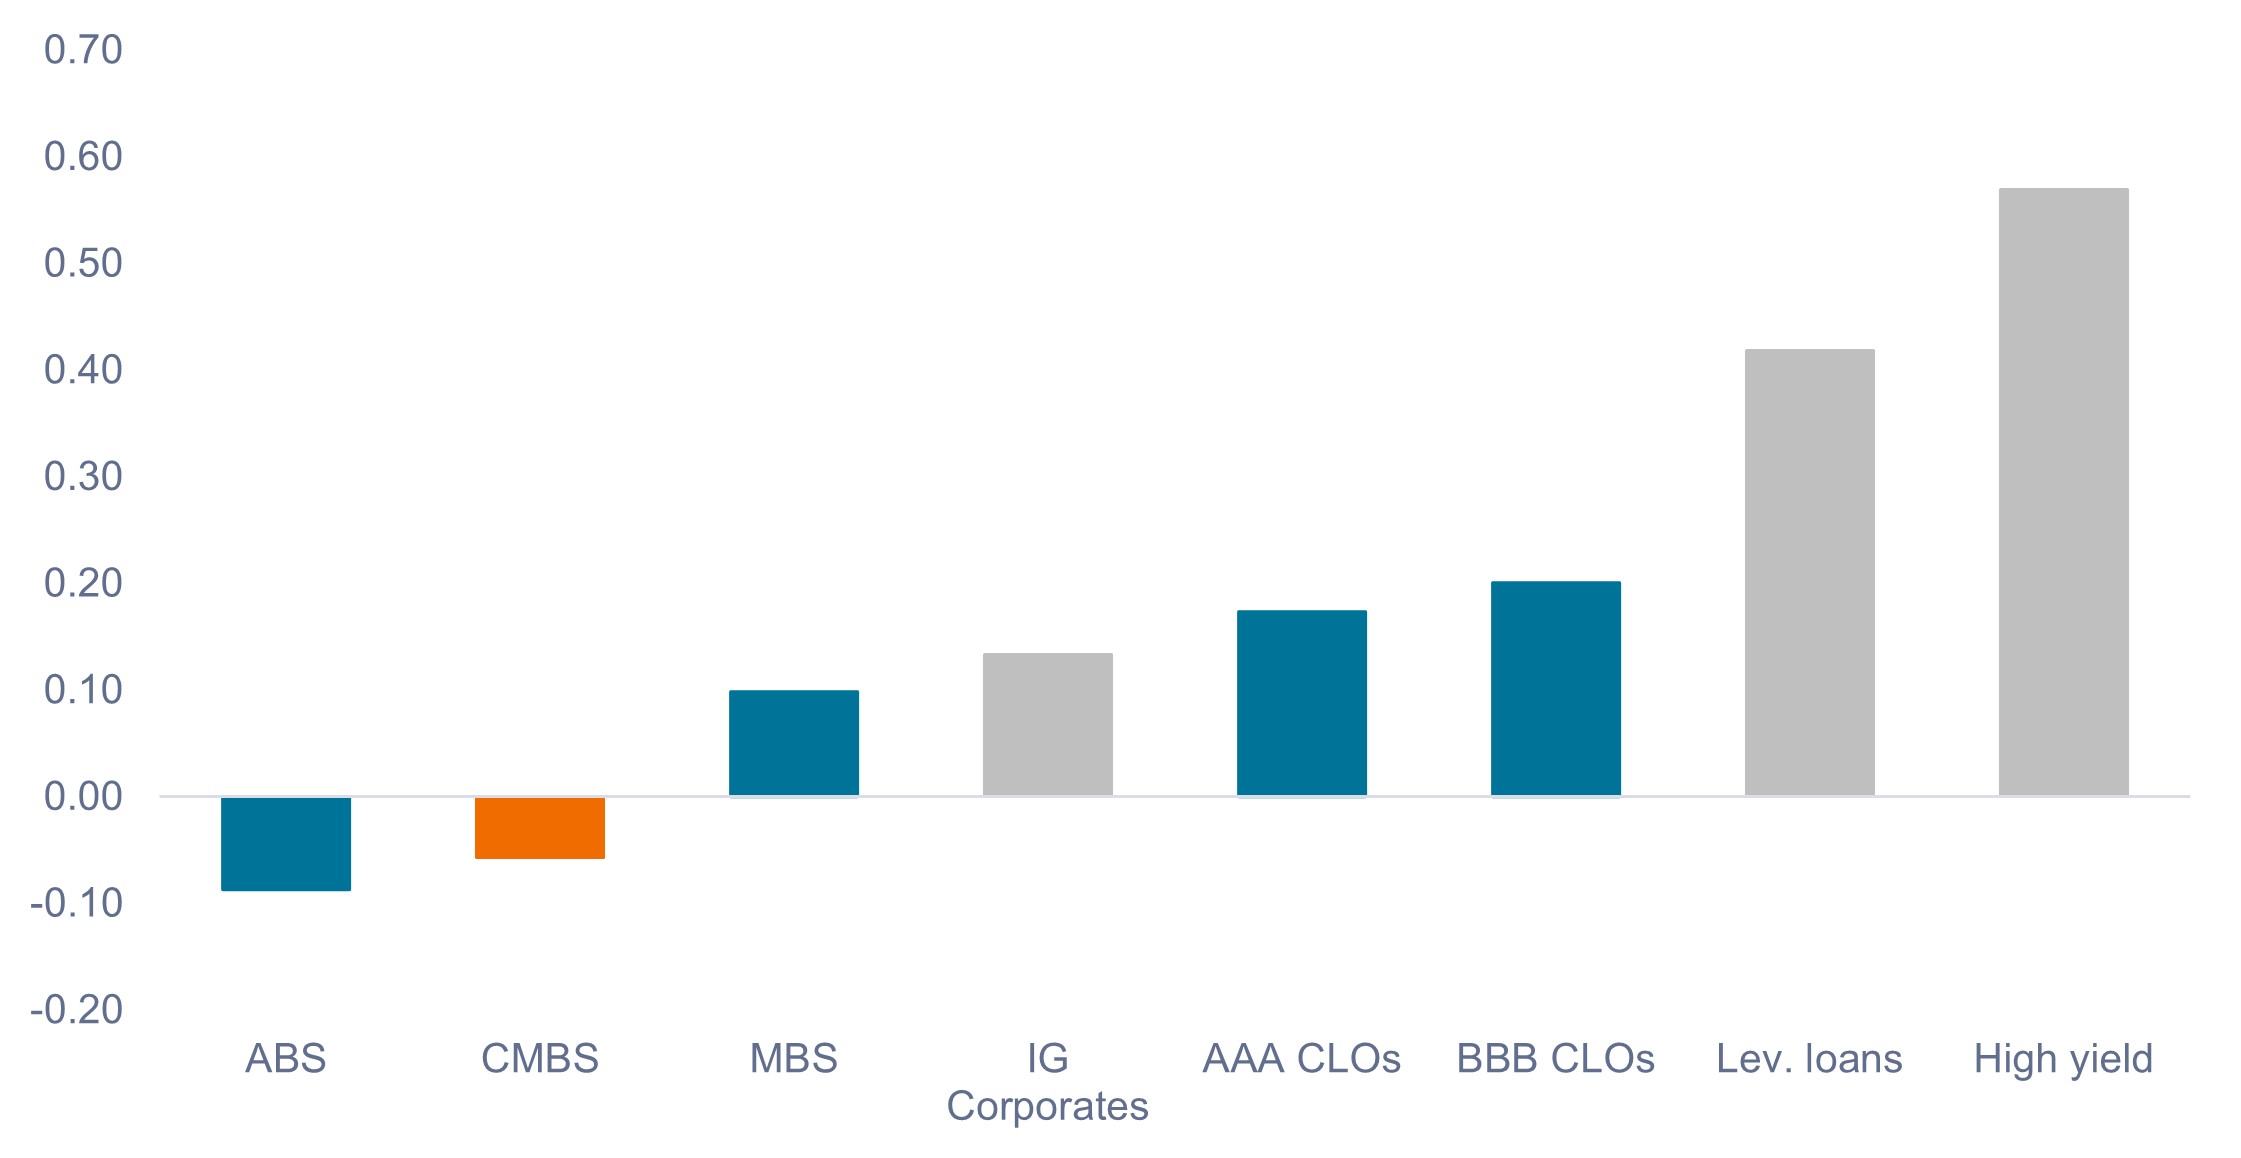
Source: Bloomberg, JP Morgan, Janus Henderson Investors, as of 30 April 2026. Daily correlations for 10-year period ended 30 April 2026. Indices used to represent asset classes: ABS = Bloomberg U.S. Aggregate Asset-Backed Securities Index, CMBS = Bloomberg U.S. Investment Grade Commercial Mortgage-Backed Securities Index, MBS = Bloomberg U.S. Mortgage-Backed Securities Index, IG Corporates = Bloomberg U.S. Corporate Investment Grade Bond Index, AAA and BBB CLOs = J.P. Morgan CLO Indices, Lev. Loans = Morningstar LSTA Leveraged Loan Index, High yield = Bloomberg U.S. High Yield Bond Index.
While the correlation benefits of adding CMBS to portfolios is compelling, the sector represents around 1% of the U.S. and Global Aggregate Bond Indices, making an active allocation through a dedicated securitized manager essential for investors seeking to add the asset class to a core fixed income allocation.
Investor implementation
Stresses within the CMBS market are most acute for older, commodity-like buildings with weaker tenant demand and near-term maturities. For investors, it is important to understand that performance within CMBS is driven by loan-level collateral, not sector averages. That distinction is important as headline office delinquency data masks widening dispersion at the property level.
Operating fundamentals, asset quality, and location drive collateral performance and illustrate why outcomes can differ meaningfully for conduit transactions versus the higher-quality collateral within SASB assets.
As NYC’s experience illustrates, CMBS fundamentals are not standing still. In select markets and property types, they are improving, and the recovery is increasingly showing up in returns. Despite negative office headlines, CMBS more broadly has returned 5.66% annualized over the last three years (as of 8 May 2026) versus 5.06% for investment-grade credit, with lower volatility, lower duration (3.46 years vs. 6.69 years), and materially higher average credit quality (Aa1 vs. Baa1).
CMBS remains a valuable portfolio allocation that can enhance diversification, support income generation, and help manage risk within core fixed income portfolios. However, the current environment creates both risk and opportunity for investors and emphasizes why we believe active management is critical when investing in CMBS.
IMPORTANT INFORMATION
Actively managed portfolios may fail to produce the intended results. No investment strategy can ensure a profit or eliminate the risk of loss.
Diversification neither assures a profit nor eliminates the risk of experiencing investment losses.
Fixed income securities are subject to interest rate, inflation, credit and default risk. The bond market is volatile. As interest rates rise, bond prices usually fall, and vice versa. The return of principal is not guaranteed, and prices may decline if an issuer fails to make timely payments or its credit strength weakens.
Real estate securities are sensitive to changes in real estate values and rental income, property taxes, interest rates, tax and regulatory requirements, supply and demand, and the management skill and creditworthiness of the company.
Securitized products, such as mortgage-backed securities and asset-backed securities, are more sensitive to interest rate changes, have extension and prepayment risk, and are subject to more credit, valuation and liquidity risk than other fixed-income securities.
1 Source: CMBS Delinquency Report January 2026: Trepp.
2 A trophy asset in the context of CMBS refers to a top-tier, iconic commercial property located in a prime, high-demand market, often featuring stable, long-term tenants. These properties, typically in the top 2% of their class, are used as collateral for single-asset, single-borrower (SASB) CMBS deals, potentially providing high investor confidence despite potential market volatility.
Basis point (bp) equals 1/100 of a percentage point. 1 bp = 0.01%, 100 bps = 1%.
The Bloomberg US Aggregate Index is a broad-based flagship benchmark that measures the investment grade, US dollar-denominated, fixed-rate taxable bond market. The index includes Treasuries, government-related and corporate securities, MBS (agency fixed-rate pass-throughs), ABS and CMBS (agency and non-agency).
The Bloomberg U.S. Commercial Mortgage-Backed Securities (CMBS) Investment Grade Index measures the investment-grade market of U.S. Agency and U.S. Non-Agency conduit and fusion CMBS deals with a minimum current deal size of $300m.
The Bloomberg Global Aggregate Index is a flagship measure of global investment grade debt from a multitude local currency markets. This multi-currency benchmark includes treasury, government-related, corporate and securitized fixed-rate bonds from both developed and emerging markets issuers.
Concentrated investments in a single sector, industry or region will be more susceptible to factors affecting that group and may be more volatile than less concentrated investments or the market as a whole.
Correlation measures the degree to which two variables move in relation to each other. A value of 1.0 implies movement in parallel, -1.0 implies movement in opposite directions, and 0.0 implies no relationship.
Credit quality ratings are measured on a scale that generally ranges from AAA (highest) to D (lowest).
Credit Spread is the difference in yield between securities with similar maturity but different credit quality. Widening spreads generally indicate deteriorating creditworthiness of corporate borrowers, and narrowing indicate improving.
Credit spread risk is the potential for a financial loss on a debt security due to a widening of the spread (difference in yield) between that security and a risk-free benchmark, such as a U.S. Treasury bond. It represents changes in market value caused by increased market perception of credit risk, distinct from the actual risk of borrower default.
Duration measures a bond price’s sensitivity to changes in interest rates. The longer a bond’s duration, the higher its sensitivity to changes in interest rates and vice versa.
Refinancing risk in commercial real estate (CRE) is the danger that a borrower cannot replace an expiring mortgage with a new loan under reasonable terms. Because CRE loans feature large “balloon” payments, owners must secure new debt to pay off the maturing balance.
Single asset single borrower CMBS (“SASB”) – A type of CMBS typically consisting of one, large loan for a single property or portfolio of properties that is securitized and sold on the secondary market.
Volatility measures risk using the dispersion of returns for a given investment.
Queste sono le opinioni dell'autore al momento della pubblicazione e possono differire da quelle di altri individui/team di Janus Henderson Investors. I riferimenti a singoli titoli non costituiscono una raccomandazione all'acquisto, alla vendita o alla detenzione di un titolo, di una strategia d'investimento o di un settore di mercato e non devono essere considerati redditizi. Janus Henderson Investors, le sue affiliate o i suoi dipendenti possono avere un’esposizione nei titoli citati.
Le performance passate non sono indicative dei rendimenti futuri. Tutti i dati dei rendimenti includono sia il reddito che le plusvalenze o le eventuali perdite ma sono al lordo dei costi delle commissioni dovuti al momento dell'emissione.
Le informazioni contenute in questo articolo non devono essere intese come una guida all'investimento.
Non vi è alcuna garanzia che le tendenze passate continuino o che le previsioni si realizzino.
Comunicazione di Marketing.
Important information
Please read the following important information regarding funds related to this article.
- Gli emittenti di obbligazioni (o di strumenti del mercato monetario) potrebbero non essere più in grado di pagare gli interessi o rimborsare il capitale, ovvero potrebbero non intendere più farlo. In tal caso, o qualora il mercato ritenga che ciò sia possibile, il valore dell’obbligazione scenderebbe.
- L’aumento (o la diminuzione) dei tassi d’interesse può influire in modo diverso su titoli diversi. Nello specifico, i valori delle obbligazioni si riducono di norma con l'aumentare dei tassi d'interesse. Questo rischio risulta di norma più significativo quando la scadenza di un investimento obbligazionario è a più lungo termine.
- Pur offrendo tassi di interesse generalmente più elevati rispetto alle obbligazioni investment grade, le obbligazioni ad alto rendimento (non-investment grade) sono più speculative e più sensibili a variazioni sfavorevoli delle condizioni di mercato.
- Titoli garantiti da attività (ABS) e altre forme di investimenti cartolarizzati possono essere soggetti a maggiori rischi di credito/inadempienza, liquidità, tasso d’interesse e di rimborso anticipato e proroga rispetto ad altri investimenti come i titoli di Stato o le obbligazioni emesse da società; ciò può avere un impatto negativo sul rendimento realizzato dall’investimento nei titoli.
- Alcune obbligazioni (obbligazioni callable) consentono ai loro emittenti il diritto di rimborsare anticipatamente il capitale o di estendere la scadenza. Gli emittenti possono esercitare tali diritti laddove li ritengano vantaggiosi e, di conseguenza, il valore del Fondo può esserne influenzato.
- Un’esposizione elevata a un determinato paese o a una specifica regione geografica comporta un livello di rischio più elevato rispetto a un Fondo più ampiamente diversificato.
- I derivati possono essere utilizzati per aiutare a raggiungere l’obiettivo di investimento. Ciò potrebbe determinare una “leva” (livelli più elevati di debito), che potrebbe amplificare i risultati dell’investimento Le perdite o i guadagni potrebbero superare il costo del derivato. I derivati comportano rischi aggiuntivi, in particolare il rischio che la controparte del derivato non adempia ai suoi obblighi contrattuali.
- Se il Fondo, o una sua classe di azioni con copertura, intende attenuare le fluttuazioni del tasso di cambio tra una valuta e la valuta di base, la stessa strategia di copertura potrebbe generare un effetto positivo o negativo sul valore del Fondo, a causa delle differenze di tasso d’interesse a breve termine tra le due valute.
- I titoli potrebbero diventare difficili da valutare o da vendere nel momento e al prezzo desiderati, specialmente in condizioni di mercato estreme caratterizzate da una discesa dei prezzi delle attività, con conseguente incremento del rischio di perdite sull’investimento.
- Il Fondo può sostenere un livello di costi di operazione più elevato per effetto dell’investimento su mercati caratterizzati da una minore attività di contrattazione o meno sviluppati rispetto a un fondo che investa su mercati più attivi/sviluppati.
- Il prelievo dal capitale di tutte le spese correnti, o di una parte di esse, e di altri costi del Fondo può erodere il capitale o ridurre il suo potenziale di crescita.
- Oltre al reddito, questa classe di azioni può distribuire plusvalenze di capitale realizzate e non realizzate e il capitale inizialmente investito. Sono dedotti dal capitale anche commissioni, oneri e spese. Entrambi i fattori possono comportare l’erosione del capitale e un potenziale ridotto di crescita del medesimo. Si richiama l’attenzione degli investitori anche sul fatto che le distribuzioni di tale natura possono essere trattate (e quindi imponibili) come reddito, secondo la legislazione fiscale locale.
- Potrebbero verificarsi perdite qualora una controparte non intendesse più o non fosse più in grado di adempiere ai propri obblighi, o a causa di un errore o di un ritardo nei processi operativi o di una negligenza di un fornitore terzo.