

Key takeaways:
- A broader, longer‑lasting commodities ‘Supercycle 2.0’ is emerging, driven by deglobalisation, decarbonisation, demographics and AI.
- Supply constraints are meeting structurally rising demand. Years of underinvestment across mining and processing are providing a supportive backdrop for sustained commodity pricing.
- An active approach can identify high-quality resource companies with world-class assets, strong balance sheets, low costs or high margins, good access to funding and strong or improving sustainability profiles in the pursuit of attractive long-term returns.
Q: What factors drove the strong returns for the natural resources sector in 2025?
A: A key driver of the S&P Global Natural Resources USD Index’s total return of 29.7% (MSCI ACWI +22.9%)1 was driven by the structural trend of deglobalisation, and within this, the shift towards nearshoring and self-reliance in key raw materials. Investment into non‑China supply chains has accelerated, with mining being a key beneficiary of this trend, including gold, copper, uranium, lithium, rare earths and tungsten. Lithium, which suffered from oversupply in recent years, did particularly well. Robust demand in the face of tighter demand translated into sharp increases for the lithium price.
Another important factor was US dollar debasement; investors reduced exposure to US assets because of global uncertainty, heightened market volatility concentration risk and President Trump’s tariff policies. The dollar has been under pressure as countries reassess reserve currencies, and lower their exposure to US Treasuries. That backdrop has been very supportive for gold and precious metals. Gold in particular had a spectacular year, with its dual role of being a commodity and a monetary asset. When it is viewed as a store of value – during times of uncertainty when risk assets are subject to longer periods of higher volatility – it becomes particularly compelling, as we have seen in 2025 and currently.
Q: How does ‘Supercycle 2.0’ compare to the China-led supercycle in the 2000s?
A: The supercycle of 2000–2011 was largely driven by China’s rapid industrialisation and urbanisation. This time round with ‘Supercycle 2.0’, the demand drivers from deglobalisation are broader, more global, and potentially longer term. Recreating critical minerals supply chains to facilitate the move towards deglobalisation is extremely commodity‑intensive, time consuming, and can often take decades to play out. It is also very capital intensive to build supply to meet future demand. Capital expenditure, for example, in mining is still at 30-year lows.2 A period of sustained capital investment is needed, not just in the mining of raw materials, but also the downstream supply chain, ie. refining, processing and manufacturing infrastructure.
Demographics is another key driver of this supercycle. During the China-led commodities supercycle, urban migration created unprecedented industrial demand. Unlike in the West, Japan and South Korea, where low fertility rates are leading to slower population growth, emerging and frontier populations – particularly in sub-Saharan Africa and Central Asia – are growing. Furthermore, we are seeing rapid urbanisation and a growing middle class, projected in 2025 to surpass four billion for the first time, in addition to another billion people within the next decade.3 These factors are pointing towards multi-decade durable incremental demand for key commodities, in terms of energy demand, water systems, construction materials for infrastructure, food and agriculture.
Decarbonisation efforts via electrification are significantly resource‑intensive, making it a key tailwind for the mining industry, as well as related resources companies. Copper is key for power generation, grids, electric vehicles and charging infrastructure, as well as batteries and storage systems. This is leading to increased demand for metals like lithium, nickel, aluminium, silver, rare earths and critical minerals. Solar, wind, hydro, geothermal and biomass energy are among the main alternative energy sources. The importance of decarbonisation can be encapsulated by the European Commission’s argument that the energy transition is no longer only a climate imperative; it is also a strategic and geopolitical necessity.
Q: What role is AI playing within the resources sector?
A: Facilitating the explosive demand for AI requires extremely energy‑intensive data centres, accelerating demand for investment in power infrastructure and, increasingly, nuclear energy. That has meaningful implications for uranium demand and nuclear fuel markets.
From a productivity, efficiency and cost perspective, resources is an incredibly data‑rich industry — from geological sampling and exploration to processing and plant optimisation. AI is increasingly used to analyse geological data, improve exploration efficiency, optimise blasting techniques, increase recovery rates, and reduce reagent usage in processing plants. These applications directly improve productivity and margins. The industry has a strong track record of adopting new technologies, and AI will increasingly support operational efficiency rather than simply being a downstream demand driver.
Q: Energy markets are typically volatile, and more so now. What is your near-term and medium-term view of the sector?
We have just entered the fourth biggest event for the global oil markets in the past 40 years. Following the start of the Iran conflict, the market has aggressively flipped from extreme complacency to hot panic about the closure of shipping through the Strait of Hormuz. On 9 March the oil price was up about 30% to US$119.48 per barrel (bbl), but the market closed that day up just 4%. Over the next two weeks, oil traded from US$77/bbl to US$102/bbl, and is US$92/bbl (at the time of writing on 23 March).4 The only other moves of this size were seen during the Gulf War invasion in 1990–1991, the recovery bounce following the 2008 Global Financial Crisis, and the 2020 post-COVID slump bounce.5 All these outsized moves were triggered by different events, but suggest at least US$150/bbl is likely if restrictions persist. For perspective, the normal price of oil is expected to be around US$80/bbl in a US$60/bbl to US$100/bbl range.
Q: Where can the most attractive opportunities in natural resources be found today?
A: In our view, structural themes and the current macro backdrop are more likely to favour mining and minerals, where the opportunity for active investors to generate alpha (returns higher than the benchmark) is materially greater under current conditions.
This is in contrast to agriculture, which tends to have efficient global trade flows that are difficult to disrupt as they are widely produced, and tend to be highly substitutable. Trade reroutes, alternative suppliers emerge, and prices normalise faster than in more fragmented sectors. Stock pickers have less opportunity to “buy scarcity” or bet on prolonged regional disruption. Commodity‑price exposure alone is less likely to deliver sustained excess returns.
Q: What is your outlook for natural resources for the remainder of the year and beyond?
A: The current backdrop, with supply chain restructuring, the building out of AI infrastructure, the energy transition and increased defence spending due to geopolitical uncertainty, and demographic tailwinds appears supportive for natural resources, and we believe the current supercycle remains in its early stages. As investment accelerates in infrastructure, manufacturing and energy, inflationary pressures are likely to follow. Resources benefit from acting as an inflation hedge. Strong demand tends to lead to higher prices, with many commodities benefiting directly from inflationary environments. Moreover, many resources stocks are still trading at attractive valuations relative to global equities.
Figure 1: Resource equities are trading at attractive valuations relative to broader equities
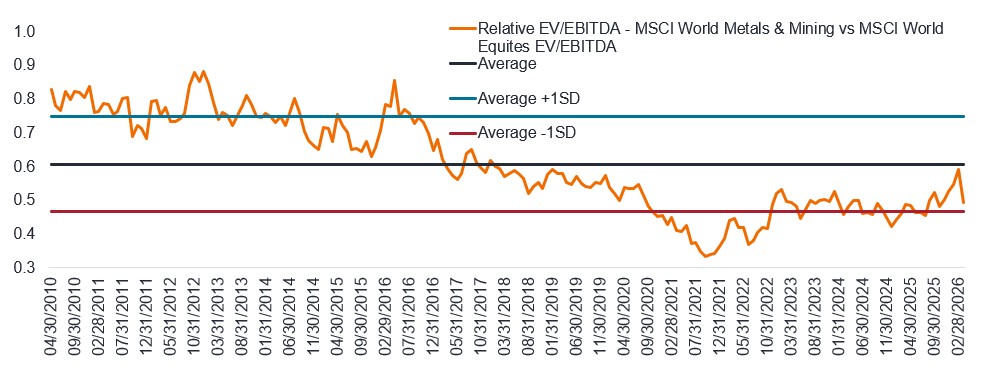
Source: Bloomberg, Janus Henderson Investors analysis, as at 23 March 2026. EV/EBITDA is a valuation ratio calculated by dividing enterprise value by earnings-before-interest, taxes, depreciation, and amortisation (EBITDA). EV/EBITDA is used to assess a company’s total value from the perspective of a buyer, taking into account any debt or cash levels in addition to its stock price. Standard deviation (SD) measures how far today’s valuation is from its historical average, scaled by how volatile that valuation typically is. A lower standard‑deviation reading indicates that valuations are cheaper than their long‑term average, the higher the SD the more expensive the valuation is. Past performance does not predict future returns.
Natural resources stocks have the potential to deliver attractive long‑term returns and offer valuable diversification benefits relative to broader global equities. We believe an active investment approach is well suited to this environment, focusing on high‑quality resource companies with sustainable competitive advantages such as world‑class assets, strong balance sheets, low costs or high margins, and improving sustainability profiles.
1 S&P Dow Jones, Refinitiv Datastream, total returns in USD 1 year to 31 December 2025. Past performance does not predict future returns.
2 Bloomberg company filings, Wood Mackenzie, ABARE EIA, China NBS, Johnson Mattheu, Jefferies estimates, as at 31 December 2023.
3 weforum.org; How the world has achieved middle-class dominance, against the odds; 18 July 2025.
4, 5 Trading Economics; Crude WTI prices to 23 March 2026.
Alpha: The difference between a portfolio’s return and its benchmark index after adjusting for the level of risk taken. This measure is used to help determine whether an actively managed portfolio has added value relative to a benchmark index, taking into account the risk taken. A positive alpha indicates that a manager has added value.
Balance sheet: Provides an indication of a company’s financial position. The balance sheet summarises a company’s assets, liabilities, and shareholders’ equity at a particular point in time. Each segment gives investors an idea as to what the company owns and owes, as well as the amount invested by shareholders.
Capital expenditure: Money that businesses set aside to buy, improve, and maintain physical assets such as real estate, machinery, or technology, to increasing operational capacity, foster growth and generate revenues. In mining projects, capex is the upfront investment required to bring a project from exploration or feasibility into production.
Decarbonisation: The process of reducing the amount of carbon, mainly carbon dioxide (CO2), sent into the atmosphere, to combat global warming and climate change.
Diversification: A way of spreading risk by mixing different types of assets or asset classes in a portfolio on the assumption that these assets will behave differently in any given scenario. Assets with low correlation should provide the most diversification.
US dollar debasement: Weakening of the US dollar versus other currencies.
Volatility: The rate and extent at which the price of a portfolio, security, or index moves up and down. If the price swings up and down with large movements, it has high volatility. If the price moves more slowly and to a lesser extent, it has lower volatility. The higher the volatility, the higher the risk of the investment.
All opinions and estimates in this information are subject to change without notice and are the views of the author at the time of publication. Janus Henderson is not under any obligation to update this information to the extent that it is or becomes out of date or incorrect. The information herein shall not in any way constitute advice or an invitation to invest. It is solely for information purposes and subject to change without notice. This information does not purport to be a comprehensive statement or description of any markets or securities referred to within. Any references to individual securities do not constitute a securities recommendation. Past performance is not indicative of future performance. The value of an investment and the income from it can fall as well as rise and you may not get back the amount originally invested.
Whilst Janus Henderson believe that the information is correct at the date of publication, no warranty or representation is given to this effect and no responsibility can be accepted by Janus Henderson to any end users for any action taken on the basis of this information.