Chart to Watch: Maximising income per unit of risk amid higher-for-longer rates
In recent years, benchmark indices such as the Bloomberg Global Aggregate Index (Global Agg) and the Bloomberg US Aggregate Bond Index (US Agg) have become proverbial one-trick ponies: With their weighting concentrated in longer-duration, lower-spread sectors, they are disproportionately skewed toward a high degree of interest-rate, or duration, risk. And in contrast to many securitised credit sectors, these benchmark indices capture very little credit spread income relative to their duration.
The chart below maps out yield to worst (YTW) versus duration risk across several major fixed income sectors. With the Federal Reserve (Fed) and most major global central banks currently on pause, albeit leaning more hawkish in response to higher oil prices, this landscape takes on new significance for portfolio positioning.
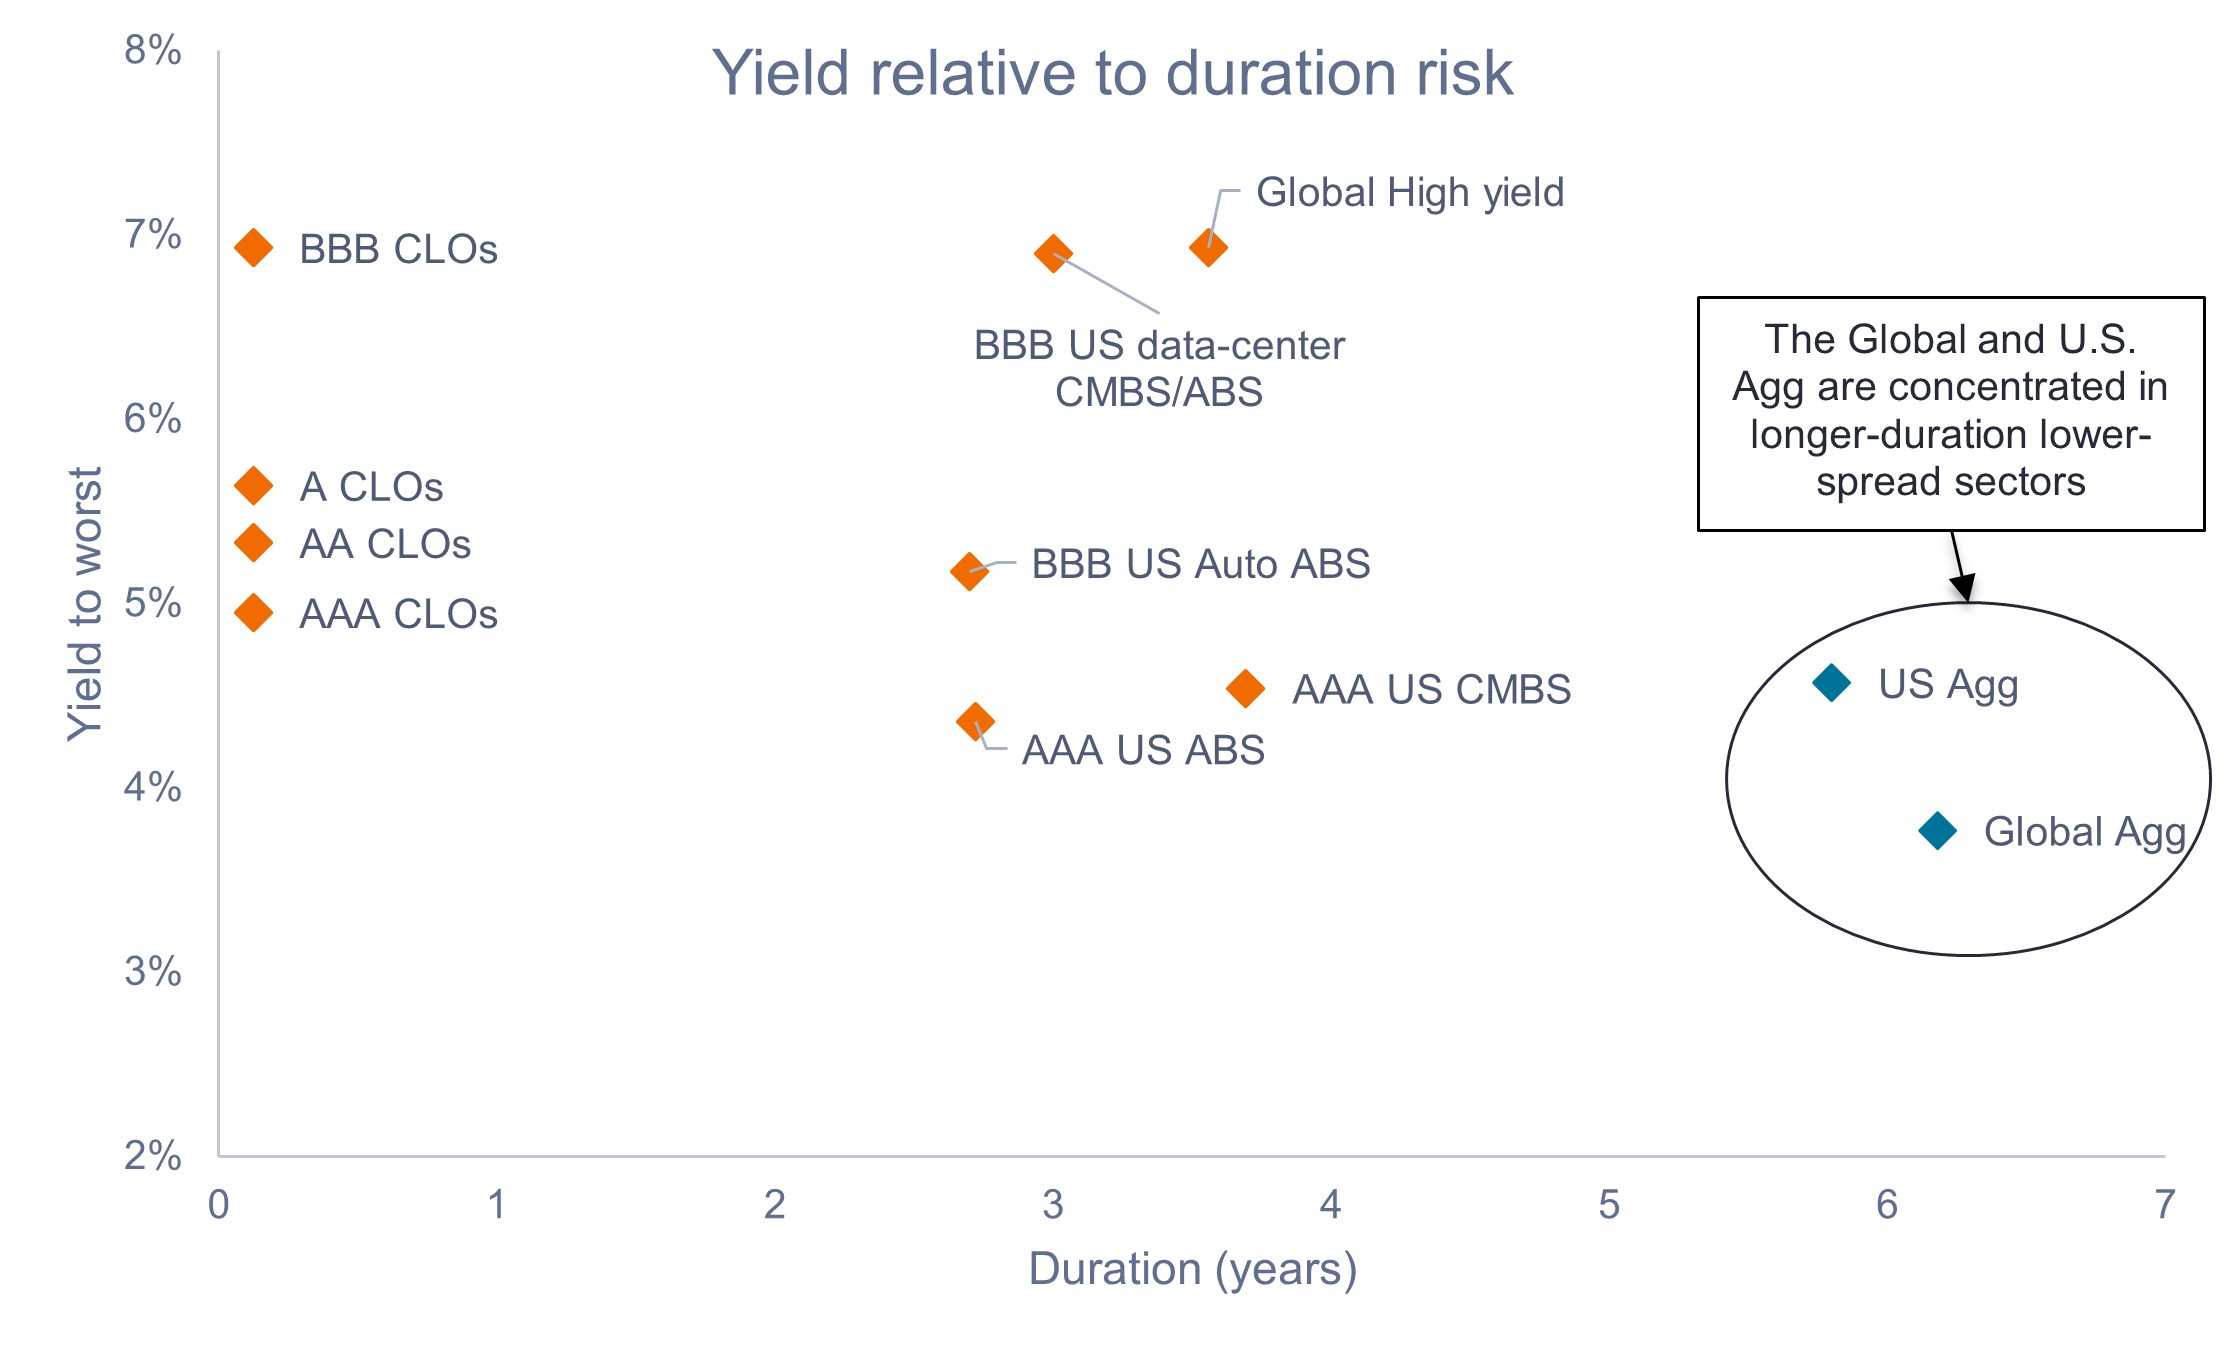
Source: Bloomberg, J.P. Morgan, Janus Henderson Investors, as of 28 April 2026. CLO sectors represented by JP Morgan CLOIE indices. U.S. Treasuries, agency mortgage-backed securities (MBS), IG corporates, asset-backed securities (ABS), commercial mortgage-backed securities (CMBS), and high yield represented by relevant Bloomberg indices. Data-center CMBS/ABS represented by indicative market pricing. Capital at risk. The value of an investment and the income from it can fall as well as rise and you may not get back the amount originally invested. Past performance does not predict future results.
Against a backdrop of heightened uncertainty and dispersion, we prioritize selective risk taking and security selection over macro calls or broad beta exposure. The $6 trillion U.S. securitised market ($15 trillion if you include agency MBS) is, in our view, an indispensable toolbox to help investors navigate the fixed income landscape and optimise income per unit of risk. – John Kerschner, Global Head of Securitised Products
Key Takeaways
- With the Fed currently on hold amid the uptick in inflation due to higher energy prices, we believe staying up in credit quality near the front end of the yield curve may offer attractive income with limited rate sensitivity.
- In our view, optimising income per unit of duration may enhance return consistency and reduce portfolio volatility.
- Given their inherently low duration, attractive spread income, and strong credit quality, we believe securitised credit sectors may combine to help investors maximize income per unit of risk by better balancing duration and credit spread exposure.
IMPORTANT INFORMATION
Actively-managed portfolios may fail to produce the intended results. No investment strategy can ensure a profit or eliminate the risk of loss.
Fixed income securities are subject to interest rate, inflation, credit and default risk. The bond market is volatile. As interest rates rise, bond prices usually fall, and vice versa. The return of principal is not guaranteed, and prices may decline if an issuer fails to make timely payments or its credit strength weakens.
High-yield or “junk” bonds involve a greater risk of default and price volatility and can experience sudden and sharp price swings.
Securitised products, such as mortgage- and asset-backed securities, are more sensitive to interest rate changes, have extension and prepayment risk, and are subject to more credit, valuation and liquidity risk than other fixed-income securities.
The Bloomberg U.S. Aggregate Bond Index is a broad-based flagship benchmark that measures the investment grade, US dollar-denominated, fixed-rate taxable bond market.
Agency MBS are issued or guaranteed by one of three US government or quasi-government agencies: Fannie Mae, Freddie Mac, and Ginnie Mae. Mortgage-backed security (MBS) is a security which is secured (or ‘backed’) by a collection of mortgages. Investors receive periodic payments derived from the underlying mortgages (similar to the coupon on bonds), like an asset-backed security. Mortgage-backed securities may be more sensitive to interest-rate changes. They are subject to ‘extension risk,’ where borrowers extend the duration of their mortgages as interest rates rise, and ‘prepayment risk,’ where borrowers pay off their mortgages earlier as interest rates fall. These risks may reduce returns.
Beta is a measure of the relationship that a portfolio or security has with the overall market. The beta of a market is always 1. A portfolio with a beta of 1 means that if the market rises 10%, so should the portfolio. A portfolio with a beta of more than 1 means it will likely move more than the market average (i.e., more volatility). A beta of less than 1 means that a security is theoretically less volatile than the market.
Credit quality ratings are measured on a scale that generally ranges from AAA (highest) to D (lowest).
A credit spread refers to the difference in yield between two bonds of similar maturity but different credit quality. It acts as a market indicator of credit risk—widening when risk rises and narrowing when it drops—and is typically measured in basis points.
Duration measures a bond’s price sensitivity to interest rate changes, expressed in years. A higher duration means greater price volatility when rates move.
Standard deviation (SD) is a statistical risk measure that quantifies the amount of variation or dispersion of a set of data values around their mean. A low SD indicates data points are clustered closely around the mean, while a high SD signifies they are spread over a wider range.
Volatility measures risk using the dispersion of returns for a given investment.
A yield curve is a line that plots the yields, or interest rates, of bonds that have equal credit quality but different maturity dates.
Yield to Worst (YTW) is a bond analysis metric calculating the lowest potential yield an investor can receive on a callable bond without the issuer defaulting. It assumes the bond is paid off at the earliest date allowed by its terms, such as through a call or early redemption.
These are the views of the author at the time of publication and may differ from the views of other individuals/teams at Janus Henderson Investors. References made to individual securities do not constitute a recommendation to buy, sell or hold any security, investment strategy or market sector, and should not be assumed to be profitable. Janus Henderson Investors, its affiliated advisor, or its employees, may have a position in the securities mentioned.
Past performance does not predict future returns. The value of an investment and the income from it can fall as well as rise and you may not get back the amount originally invested.
The information in this article does not qualify as an investment recommendation.
There is no guarantee that past trends will continue, or forecasts will be realised.
Marketing Communication.
Important information
Please read the following important information regarding funds related to this article.
- An issuer of a bond (or money market instrument) may become unable or unwilling to pay interest or repay capital to the Fund. If this happens or the market perceives this may happen, the value of the bond will fall.
- When interest rates rise (or fall), the prices of different securities will be affected differently. In particular, bond values generally fall when interest rates rise (or are expected to rise). This risk is typically greater the longer the maturity of a bond investment.
- The Fund invests in high yield (non-investment grade) bonds and while these generally offer higher rates of interest than investment grade bonds, they are more speculative and more sensitive to adverse changes in market conditions.
- Some bonds (callable bonds) allow their issuers the right to repay capital early or to extend the maturity. Issuers may exercise these rights when favourable to them and as a result the value of the Fund may be impacted.
- If a Fund has a high exposure to a particular country or geographical region it carries a higher level of risk than a Fund which is more broadly diversified.
- The Fund may use derivatives to help achieve its investment objective. This can result in leverage (higher levels of debt), which can magnify an investment outcome. Gains or losses to the Fund may therefore be greater than the cost of the derivative. Derivatives also introduce other risks, in particular, that a derivative counterparty may not meet its contractual obligations.
- When the Fund, or a share/unit class, seeks to mitigate exchange rate movements of a currency relative to the base currency (hedge), the hedging strategy itself may positively or negatively impact the value of the Fund due to differences in short-term interest rates between the currencies.
- Securities within the Fund could become hard to value or to sell at a desired time and price, especially in extreme market conditions when asset prices may be falling, increasing the risk of investment losses.
- The Fund may incur a higher level of transaction costs as a result of investing in less actively traded or less developed markets compared to a fund that invests in more active/developed markets.
- Some or all of the ongoing charges may be taken from capital, which may erode capital or reduce potential for capital growth.
- The Fund could lose money if a counterparty with which the Fund trades becomes unwilling or unable to meet its obligations, or as a result of failure or delay in operational processes or the failure of a third party provider.
- In addition to income, this share class may distribute realised and unrealised capital gains and original capital invested. Fees, charges and expenses are also deducted from capital. Both factors may result in capital erosion and reduced potential for capital growth. Investors should also note that distributions of this nature may be treated (and taxable) as income depending on local tax legislation.
- The Fund invests in Asset-Backed Securities (ABS) and other forms of securitised investments, which may be subject to greater credit / default, liquidity, interest rate and prepayment and extension risks, compared to other investments such as government or corporate issued bonds and this may negatively impact the realised return on investment in the securities.