
Key takeaways:
- Solvency II capital recalibration begins to correct a longstanding misalignment between regulatory treatment and underlying risk, materially improving capital efficiency for senior securitisations and reopening insurers’ access to the broader global opportunity set.
- Insurers can now optimise portfolios, accessing senior securitisations across jurisdictions to enhance diversification, improve return on capital and manage risk, while remaining within fixed Solvency II capital constraints.
- Successfully capturing these benefits requires partnering with asset managers offering deep local market expertise, robust structural analysis and integrated global portfolio construction to help navigate jurisdictional complexity, sourcing, liquidity and risk management under the revised regime.
Solvency II’s new securitisation capital charges: A game-changer for insurers
Last month, the European Commission finalised long-anticipated reforms to Solvency II capital charges, applicable to insurers, for investing in securitisation. Effective from January 2027, the regulation marks a game-changer for European standard-model insurers’ ability to re-enter the securitisation market. By sharply reducing the Solvency Capital Requirement (SCR)[1] for select securitised assets, the new rules remove a key barrier that has kept insurers on the sidelines for over a decade. It also offers another targeted channel to stimulate growth in the European securitised market.
A clear path back to the securitisation market
The impact of Solvency II’s introduction in 2016 on insurers’ appetite for securitisation was dramatic. Prior to implementation, insurers were key investors in European securitisations. Prior to Solvency II in 2010, approximately 8% of European insurers’ fixed-income portfolios were invested in securitised assets (Figure 1), making up a substantial portion of demand from ABS investors.
In the lead-up to implementation of Solvency II, insurers significantly reallocated away from securitised. According to the Association of Financial Markets in Europe (AFME) research, securitisations now make up less than 1% of European insurers’ total invested assets – only 1.6% of their bond portfolios.[2]
By contrast, US insurers continued to invest heavily in the sector. Under the National Association of Insurance Commissioners’ (NAIC) more reasonable capital regime, US life insurers currently allocate roughly 15% of their total assets to securitised credit, five to 10 times the share seen in Europe (Figure 1). This makes US insurers today among the largest investors in the global collateralised loan obligation (CLO) market, owning an estimated 25–30% of outstanding US CLO.[3]
This diverging transatlantic experience underscores the influence of capital rules on investment decisions; given appropriate capital treatment, insurers clearly have appetite for securitised assets.
Figure 1: US versus European insurers’ allocation to securitised investments as a percentage of their total bond portfolios
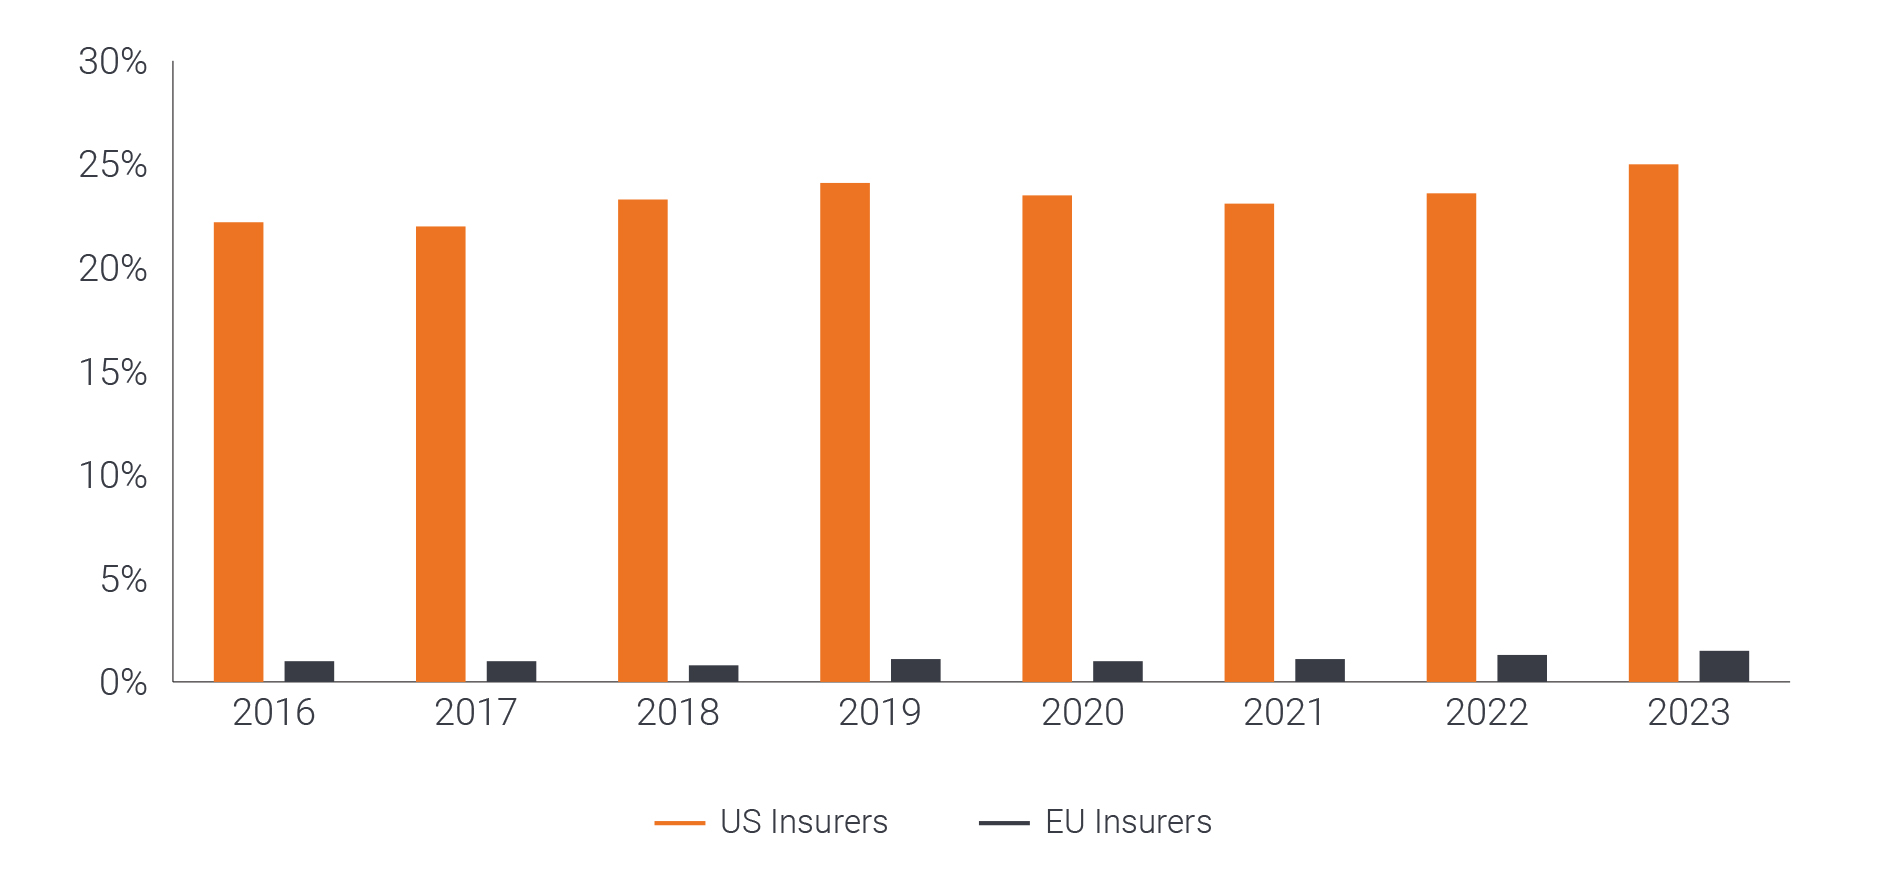
Source: AFME, US NAIC Capital Markets Bureau special reports and EIOPA Insurance Statistics, as at 31 December 2023.
More risk-sensitive treatment of securitisations in SCR revisions
The two investment profiles most benefiting from these revisions are:
- securitisations that can achieve the STS designation
- senior tranches of non-STS transactions
As part of the EU Securitisation Regulation (SECR), this STS[4] label was introduced in 2019 as a voluntary classification for securitisation transactions that are simple, transparent and have standardised risk and underwriting characteristics. They tend to fall in the prime residential mortgage-backed securities (RMBS) and ABS categories, such as auto loans, credit card receivables and other consumer debt. The UK also has a similar STS label, although that is not recognised by the EU for preferential capital treatment.
Non-STS transactions tend to cover the rest of the securitised sectors, such as CLOs and commercial mortgage-backed securities (CMBS). While there are SCR revisions for lower-rated tranches, they likely remain too unnecessarily punitive to enable these tranches to form more than a minority allocation. A summary of the changes for the key investment profiles is as follows:
- STS: Capital factors for senior STS securitisations will move in line with those for covered bonds or similarly-rated corporate bonds. This eliminates a longstanding inconsistency where high-quality securitisations were penalised more heavily than other assets of identical credit rating. In particular, the capital charge for a AAA STS will align with that of a AAA covered bond, reflecting their similar credit and return profile.
- Senior Non-STS: Regulators recognised that senior tranches were treated too harshly, leading to capital charges that were disproportionate to actual risk. From implementation in 2027, the capital charge for a senior investment-grade (IG) Non-STS tranche might fall by around 60–80% relative to the old calibration. For instance, a five-year AAA CLO tranche that used to require ~62.5% allocation of capital (SCR) could see that drop to ~10–15%, a sixfold improvement in capital efficiency. In effect, these senior positions will be treated more like BBB-rated corporate bonds in the standard formula, instead of like equity exposures. This aligns more with our view that these profiles are attractive alternatives to IG credit.
Figure 2 presents specific scalable and liquid securitised asset classes that are positioned to benefit significantly from the forthcoming changes. The current SCR is represented in blue, while the revised SCR is shown in orange. The most significant change is evident in the senior (AAA) tranches of Non-STS transactions across UK and Australian ABS, European CLO, as well as UK, US and Australian RMBS.
Figure 2: SCR benefits by type of transaction, sectors and jurisdictions
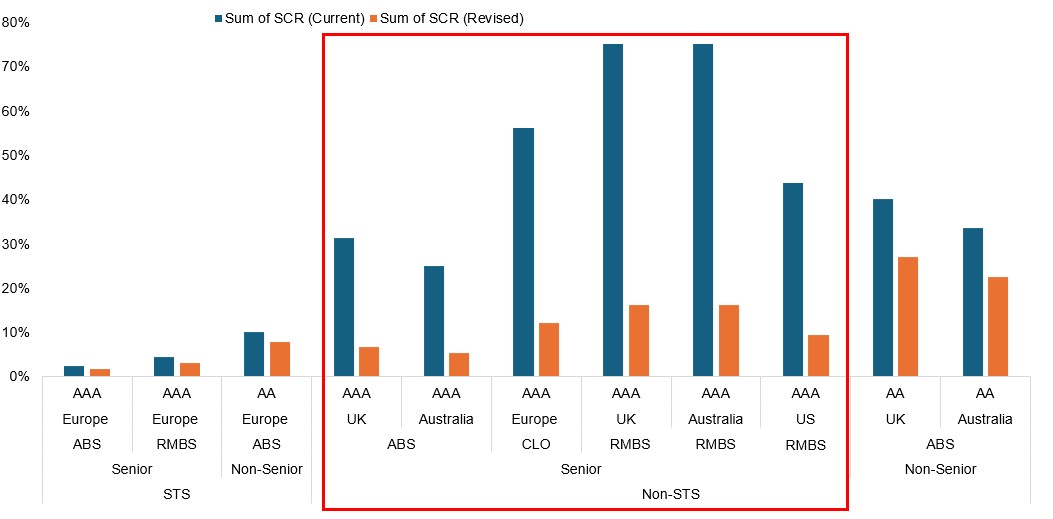
Source: Janus Henderson Investors, as at 28 February 2026. For illustrative purposes only. Past performance is not a guide to future returns. There is no guarantee that past trends will continue, or forecasts will be realised. For illustrative purposes only.
The sectors set to benefit most from the SCR revisions to the Non-STS senior tranches are often those with higher return profiles and many are located outside of the EU, such as Australia and the US. This emphasises the requirement for securitised investors to have deep local expertise and relationships in these regions to effectively analyse risk against opportunity and effectively scale in those markets.
Capital efficiency is typically a metric that insurers look at as return per unit of Solvency II capital. Figure 3 shows this metric covering the same sectors, with the blue bars indicating cumulative capital efficiency under the current Solvency II rules. The orange bars show the same metric under the revised calibration. The senior tranches of Non-STS transactions are still among the most attractive from a return on capital (RoC) perspective when considering current spreads. While the STS profiles achieve the highest RoC (as we show next), it is worth noting the actual spreads offered are typically among the tightest in the European securitised sector, while the opposite is generally the case for Non-STS.
Figure 3: Return on capital potential shown through higher capital efficiency
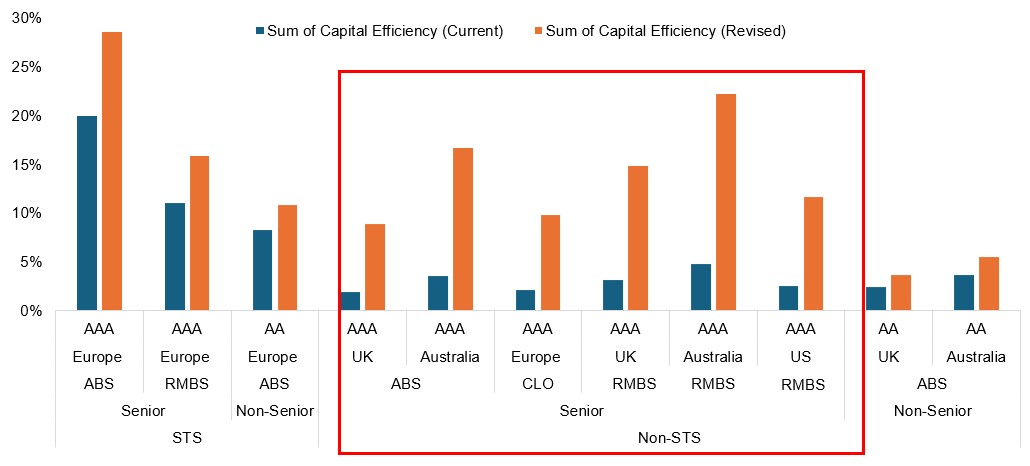
Source: Janus Henderson Investors, as at 28 February 2026. Return on capital is spread divided by SCR. Past performance is not a guide to future returns. There is no guarantee that past trends will continue, or forecasts will be realised.
Allocation in action: SCR and return impact on different portfolios
To delve deeper into the impact of the capital charge revisions, we have constructed four model portfolios that detail the SCR and RoC for each under both the current and future regimes.
- Portfolio 1 “High Capital Efficiency”: This ultra-conservative securitisation portfolio prioritises minimal capital charge at the expense of concentration and returns. It invests entirely in senior STS and mostly AAA-rated positions.
Portfolios 2-4 are subject to a 20% SCR budget and aim to maximise return within those parameters, hedged to a euro base currency.
- Portfolio 2 “European Balanced”: This portfolio offers enhanced diversification across various European securitised asset classes and jurisdictions, with a substantial increase in non-senior exposure. Nevertheless, it remains focused on Europe, including the UK. Prioritising European sectors results in greater concentration and more exposure to higher beta segments of the capital structure to maximise returns while remaining within the SCR budget.
- Portfolio 3 “Global Balanced”: This is a globally diversified securitisation portfolio. It builds on the balanced approach of Portfolio 2 but extends beyond Europe, allocating a portion to US and Australian securitisations – all in senior tranches. Those additions further optimise the portfolio in terms of capital charges, diversification and volatility. A notable reduction in non-senior exposure and broader diversification reduces mark-to-market volatility in risk-off environments.
- Portfolio 4 “100% CLO”: A singular allocation to a fundamentally diversified securitisation sector. Interestingly, this is the portfolio that achieves the highest spread and RoC, although it has the highest concentration in the higher beta and longest spread duration (sensitivity to the movement of credit spreads) sector, making it sensitive to risk-off environments. That said, all exposure is concentrated near the top parts of the capital structure, which have never experienced any defaults globally.
As mentioned earlier, the highest efficiency portfolio of STS transactions has the highest RoC potential. As Figure 4 shows, the two balanced portfolios more than doubled their RoC potential, with the global focus (including US and Australian securitisations) increasing the RoC potential without increasing overall SCR. This “Global Balanced” portfolio demonstrates that extending allocations beyond Europe reduces concentration risk, lowers reliance on higher‑beta non‑senior tranches, and improves diversification. Portfolio 4 – the CLO – experienced a tripling of RoC potential, but as the higher beta sector shows the value of this allocation as a building block of a diversified fixed income portfolio.
Figure 4: SCR and RoC impact across different portfolios in the new regime
| Portfolio 1 (Highest Efficiency) |
Portfolio 2 (European Balanced) |
Portfolio 3 (Global Balanced) |
Portfolio 4 (100% CLO) |
|||||
|---|---|---|---|---|---|---|---|---|
| Pre 2027 |
Post 2027 |
Pre 2027 |
Post 2027 |
Pre 2027 |
Post 2027 |
Pre 2027 |
Post 2027 |
|
| Average SCR | 3.3% | 2.3% | 40.3% | 19.4% | 46.2% | 18.1% | 60.5% | 19.5% |
| Average RoC | 16.8% | 23.5% | 2.8% | 5.8% | 2.7% | 6.8% | 2.2% | 6.7% |
| WA Spread | 55 | 112 | 124 | 131 | ||||
| WA Spread Duration | 3.1 | 4.1 | 3.9 | 4.8 | ||||
| CLO | 0% | 35% | 35% | 100% | ||||
| RMBS | 30% | 15% | 20% | 0% | ||||
| ABS | 70% | 40% | 35% | 0% | ||||
| CMBS | 0% | 10% | 10% | 0% | ||||
| Multi-Eurozone | 0% | 45% | 40% | 100% | ||||
| Germany | 15% | 10% | 5% | 0% | ||||
| France | 20% | 3% | 0% | 0% | ||||
| Italy | 10% | 10% | 5% | 0% | ||||
| Spain | 15% | 10% | 5% | 0% | ||||
| Portugal | 10% | 0% | 0% | 0% | ||||
| Netherlands | 20% | 5% | 0% | 0% | ||||
| Ireland | 10% | 3% | 0% | 0% | ||||
| UK | 0% | 15% | 5% | 0% | ||||
| Australia | 0% | 0% | 20% | 0% | ||||
| US | 0% | 0% | 20% | 0% | ||||
| STS | 100% | 40% | 15% | 0% | ||||
| Non-STS | 0% | 60% | 85% | 100% | ||||
| Senior | 100% | 60% | 70% | 83% | ||||
| Non-Senior | 0% | 40% | 30% | 18% | ||||
| AAA | 65% | 50% | 65% | 82.5% | ||||
| AA | 35% | 40% | 30% | 17.5% | ||||
| A | 0% | 10% | 5% | 0% | ||||
| BBB | 0% | 0% | 0% | 0% | ||||
| EUR | 100% | 85% | 55% | 100% | ||||
| GBP | 0% | 15% | 5% | 0% | ||||
| AUD | 0% | 0% | 20% | 0% | ||||
| USD | 0% | 0% | 20% | 0% | ||||
| Total | 100% | 100% | 100% | 100% | ||||
Source: Janus Henderson Investors analysis, as at 28 February. The example provided is hypothetical and used for illustrative purposes only. Past performance is not a guide to future returns. There is no guarantee that past trends will continue, or forecasts will be realised.
A global opportunity set for European insurers
The recalibration of Solvency II capital charges not only reopens the securitisation market for European insurers, but it crucially expands the opportunity set beyond Europe. By improving the capital efficiency for senior non-STS tranches – many of which are outside the EU – it enables insurers to access deep, liquid and long-established securitised markets. This allows the optimisation of portfolios on a risk-adjusted return basis, rather than via regulation. In parallel, the proportion of EU-compliant risk‑retention‑eligible issuance has increased from non-EU jurisdictions, as more deals are electing to satisfy such rules to access an expanded investor base. This is another tailwind for broadening the global securitised opportunity set for European investors.
This reform facilitates insurers’ access to the asset class, enabling them to leverage a range of key advantages. This includes floating-rate coupons for hedging interest rate risk, diversified exposure to granular pools of consumer and commercial credit across multiple jurisdictions, and structural protections designed to enhance resilience throughout economic cycles. It is a long-awaited realignment of regulation closer to economic reality. As a global asset manager with deep local market expertise across securitised credit, we are uniquely positioned to help insurers take advantage of the opportunities arising from this regulatory reform.
Footnotes
[1] This specifies the amount of capital an insurer must hold to withstand extreme market events to ensure they can continue to operate and meet claims with a high degree of confidence.
[2] Source: Janus Henderson Investors, as at 19 November 2025.
[3] Source: US NAIC Capital Markets Bureau, as at 31 December 2023.
[4] Simple, Transparent and Standardised.
These are the views of the author at the time of publication and may differ from the views of other individuals/teams at Janus Henderson Investors. References made to individual securities do not constitute a recommendation to buy, sell or hold any security, investment strategy or market sector, and should not be assumed to be profitable. Janus Henderson Investors, its affiliated advisor, or its employees, may have a position in the securities mentioned.
Past performance does not predict future returns. The value of an investment and the income from it can fall as well as rise and you may not get back the amount originally invested.
The information in this article does not qualify as an investment recommendation.
There is no guarantee that past trends will continue, or forecasts will be realised.
Marketing Communication.
Important information
Please read the following important information regarding funds related to this article.
- An issuer of a bond (or money market instrument) may become unable or unwilling to pay interest or repay capital to the Fund. If this happens or the market perceives this may happen, the value of the bond will fall.
- When interest rates rise (or fall), the prices of different securities will be affected differently. In particular, bond values generally fall when interest rates rise (or are expected to rise). This risk is typically greater the longer the maturity of a bond investment.
- The Fund invests in high yield (non-investment grade) bonds and while these generally offer higher rates of interest than investment grade bonds, they are more speculative and more sensitive to adverse changes in market conditions.
- Some bonds (callable bonds) allow their issuers the right to repay capital early or to extend the maturity. Issuers may exercise these rights when favourable to them and as a result the value of the Fund may be impacted.
- If a Fund has a high exposure to a particular country or geographical region it carries a higher level of risk than a Fund which is more broadly diversified.
- The Fund may use derivatives to help achieve its investment objective. This can result in leverage (higher levels of debt), which can magnify an investment outcome. Gains or losses to the Fund may therefore be greater than the cost of the derivative. Derivatives also introduce other risks, in particular, that a derivative counterparty may not meet its contractual obligations.
- When the Fund, or a share/unit class, seeks to mitigate exchange rate movements of a currency relative to the base currency (hedge), the hedging strategy itself may positively or negatively impact the value of the Fund due to differences in short-term interest rates between the currencies.
- Securities within the Fund could become hard to value or to sell at a desired time and price, especially in extreme market conditions when asset prices may be falling, increasing the risk of investment losses.
- The Fund may incur a higher level of transaction costs as a result of investing in less actively traded or less developed markets compared to a fund that invests in more active/developed markets.
- Some or all of the ongoing charges may be taken from capital, which may erode capital or reduce potential for capital growth.
- The Fund could lose money if a counterparty with which the Fund trades becomes unwilling or unable to meet its obligations, or as a result of failure or delay in operational processes or the failure of a third party provider.
- In addition to income, this share class may distribute realised and unrealised capital gains and original capital invested. Fees, charges and expenses are also deducted from capital. Both factors may result in capital erosion and reduced potential for capital growth. Investors should also note that distributions of this nature may be treated (and taxable) as income depending on local tax legislation.
- The Fund invests in Asset-Backed Securities (ABS) and other forms of securitised investments, which may be subject to greater credit / default, liquidity, interest rate and prepayment and extension risks, compared to other investments such as government or corporate issued bonds and this may negatively impact the realised return on investment in the securities.