Chart to Watch: What’s behind the divergence between gold and real Treasury yields?
Co-Heads of Asset Allocation Strategies Philip Maymin and Allan Maymin explain why the relationship between gold and real U.S. Treasury yields isn't broken, just operating from a higher base.
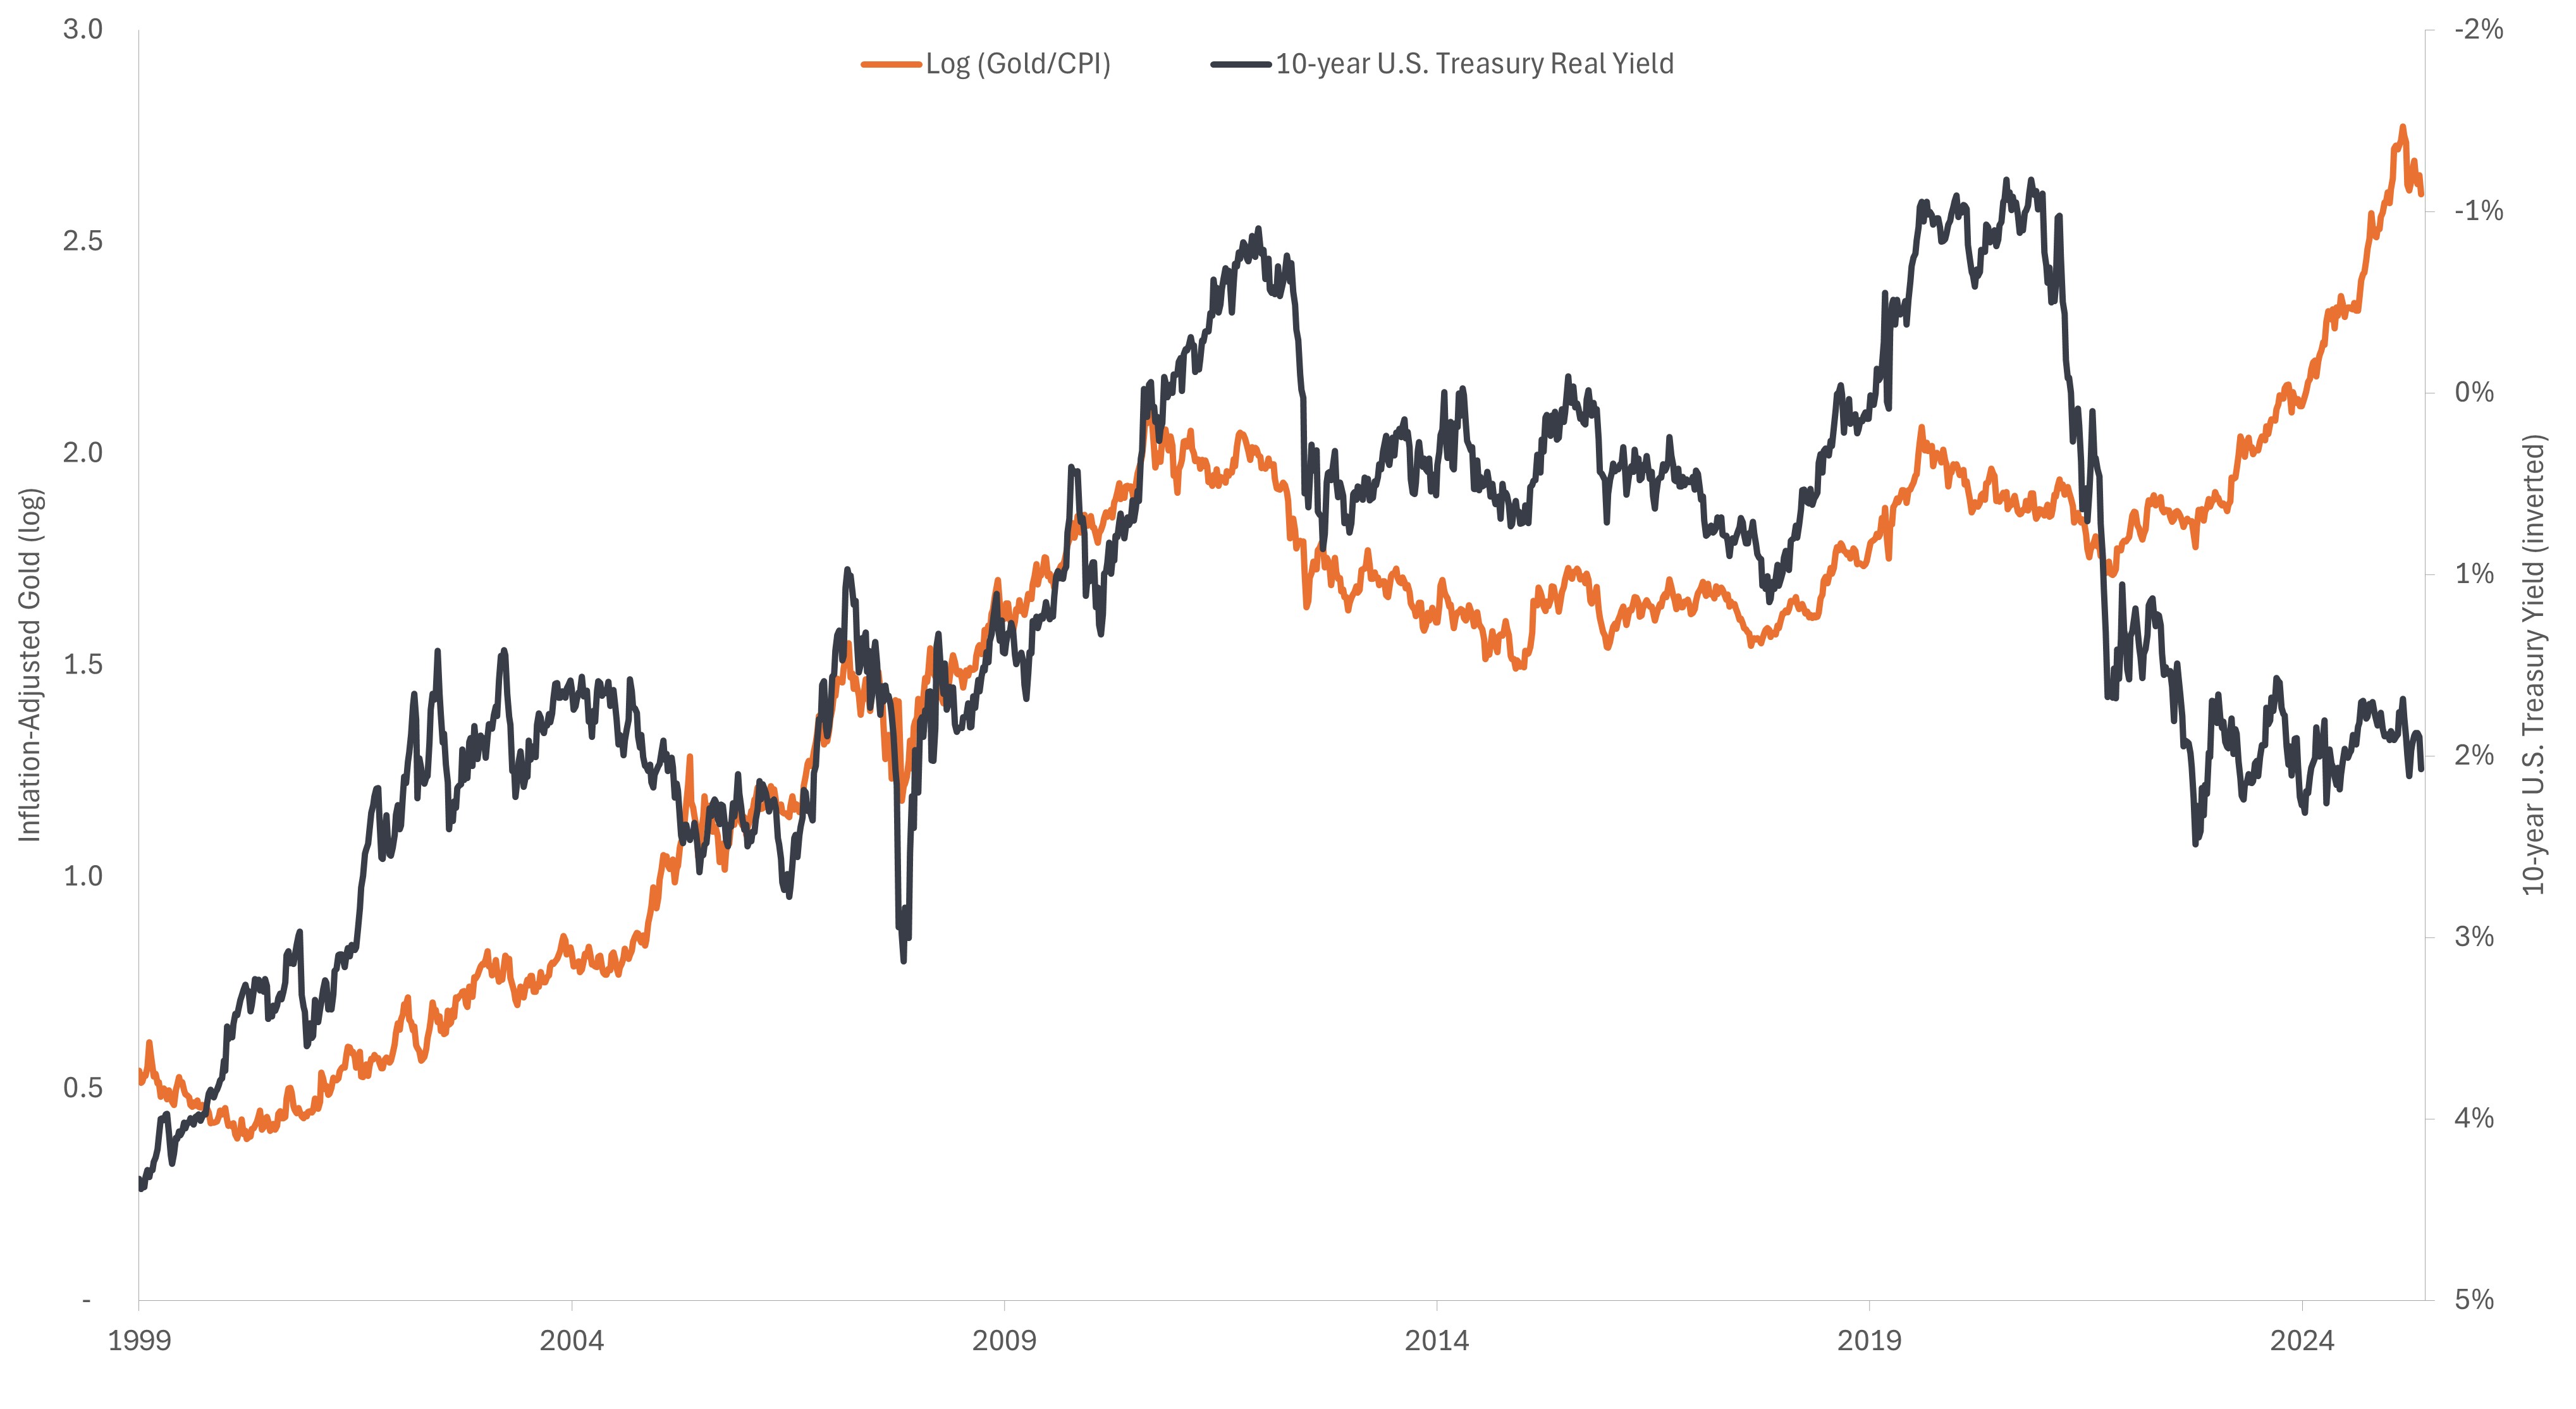
Source: Janus Henderson Investors, Bloomberg, as of 14 May 2026.
Even with the early-year sell-off, inflation-adjusted gold has largely held steady. But rather than real interest rates being the driving force – they are positive, after all – emerging market central bank purchases are likely behind recent demand.
Key takeaways
- For two decades, gold tracked real U.S. Treasury yields closely. When real rates fell, the opportunity cost of holding a non-yielding asset fell with them, and gold rose.
- Since 2022, central bank purchases have likely pushed gold's long-term baseline higher.
- Real yields still drive direction over short horizons, but they no longer set the floor.
From the late 1990s through 2020, inflation-adjusted gold and inverted real 10-year U.S. Treasury yields moved together almost mechanically. Since 2022, a wide gap has opened. Gold has climbed to new highs in both nominal and inflation-adjusted terms, while real yields have stayed elevated, currently around 2.0%. Real gold prices and real yields have never been simultaneously this high in the prior two decades.
Look closer at the past 18 months and a different picture emerges: Gold is still following real yields, but from a permanently higher base. The early-2026 correction raised the question of whether gold was finally reverting to the reality of higher real yields or just pausing at a new, elevated level.
We think it’s the latter, and the reason is central bank demand. Since 2022, central banks across emerging markets have been buying gold at the fastest pace in decades, averaging roughly 1,000 tons per year from 2022 through 2024 compared to about 500 tons, annually, over the prior decade. We view the shift as strategic rather than cyclical as these banks move away from dollar-denominated reserves.
That structural bid explains the level shift in the chart: Gold trades far above where real yields alone would put it. The past six months, however, tell the subtler story: When real yields rise, gold falls. And when yields drop, gold recovers. The mechanism is intact; it just operates from a higher base. Real yields still drive direction, but the floor under gold is no longer set by rates alone.
10-Year Treasury Yield is the interest rate on U.S. Treasury bonds that will mature 10 years from the date of purchase.
These are the views of the author at the time of publication and may differ from the views of other individuals/teams at Janus Henderson Investors. References made to individual securities do not constitute a recommendation to buy, sell or hold any security, investment strategy or market sector, and should not be assumed to be profitable. Janus Henderson Investors, its affiliated advisor, or its employees, may have a position in the securities mentioned.
Past performance does not predict future returns. The value of an investment and the income from it can fall as well as rise and you may not get back the amount originally invested.
The information in this article does not qualify as an investment recommendation.
There is no guarantee that past trends will continue, or forecasts will be realised.
Marketing Communication.