
Key takeaways:
- Small caps are trading at one of their cheapest levels relative to large caps in 50 years, despite earnings growing that is roughly in lockstep with large caps.
- The earnings quality factor posted its worst performance in 30 years through September 2025, while unprofitable small-cap stocks rallied. However, over the past 20 years, high-quality stocks have outperformed low quality.
- We believe investors are better served by seeking balanced exposure to multiple factors, including valuation, quality, momentum, and capital efficiency, rather than relying on any single factor exposure. Diversified models have historically demonstrated greater long-term efficacy through varying market environments.
As we kick off 2026, two notable gaps stand out. First, small-cap valuations are trading at a historic discount to large caps. Second, there was a divergence in short-term performance between quality and momentum factors in 2025 that does not align with longer-term performance trends.
Small caps trading at historic discount
Small caps have historically traded in line with large caps on a relative valuation basis. This pattern held until about five years ago. Since then, large caps have drifted away through multiple expansion even as small-cap earnings have continued to grow roughly in lockstep with large caps.
We now see one of the biggest variations between small caps and large caps on a valuation basis going back 50 years. When we look at the forward price-to-earnings ratio of large caps versus small caps – focusing only on profitable companies – small caps are trading at about a 20% discount to parity. Excluding the COVID 2020 recession, this represents the cheapest small caps have traded in the 50-year period dating back to 1975.1 This displacement has been the prevailing story post-COVID, and it has not moved from this medium-term dislocation. We believe this makes the small-cap asset class quite attractive relative to large caps.
Several factors explain why small-cap valuations have been depressed on a relative basis. The market has largely been driven by momentum and artificial intelligence themes prevalent in large-cap stocks. A higher-rate environment typically favors large caps, and the growth of the Magnificent Seven stocks has pulled apart valuations. Recent geopolitical stress hasn’t helped, as tariff and trade policy have created uncertainty and raised input costs.
Momentum has surged while quality has lagged
This momentum-driven environment shaped not only small-cap versus large-cap asset class performance, but also returns within the small-cap asset class during 2025. About one-third of the names in the Russell 2000 Index are unprofitable with negative earnings. These unprofitable stocks rallied substantially in the second half of 2025.
The unprofitable small-cap segment hit its trough in April 2025, but when Liberation Day occurred, an increased focus on domestic companies combined with expectations for future rate cuts made small caps more attractive. This was especially true for companies with less profitable near-term outlooks. When investor optimism grows around potential Federal Reserve rate cuts, the most speculative growth-oriented bets – typically small, unprofitable but high-potential firms – tend to rally hardest around the idea that cheaper funding increases the net present value of future returns.
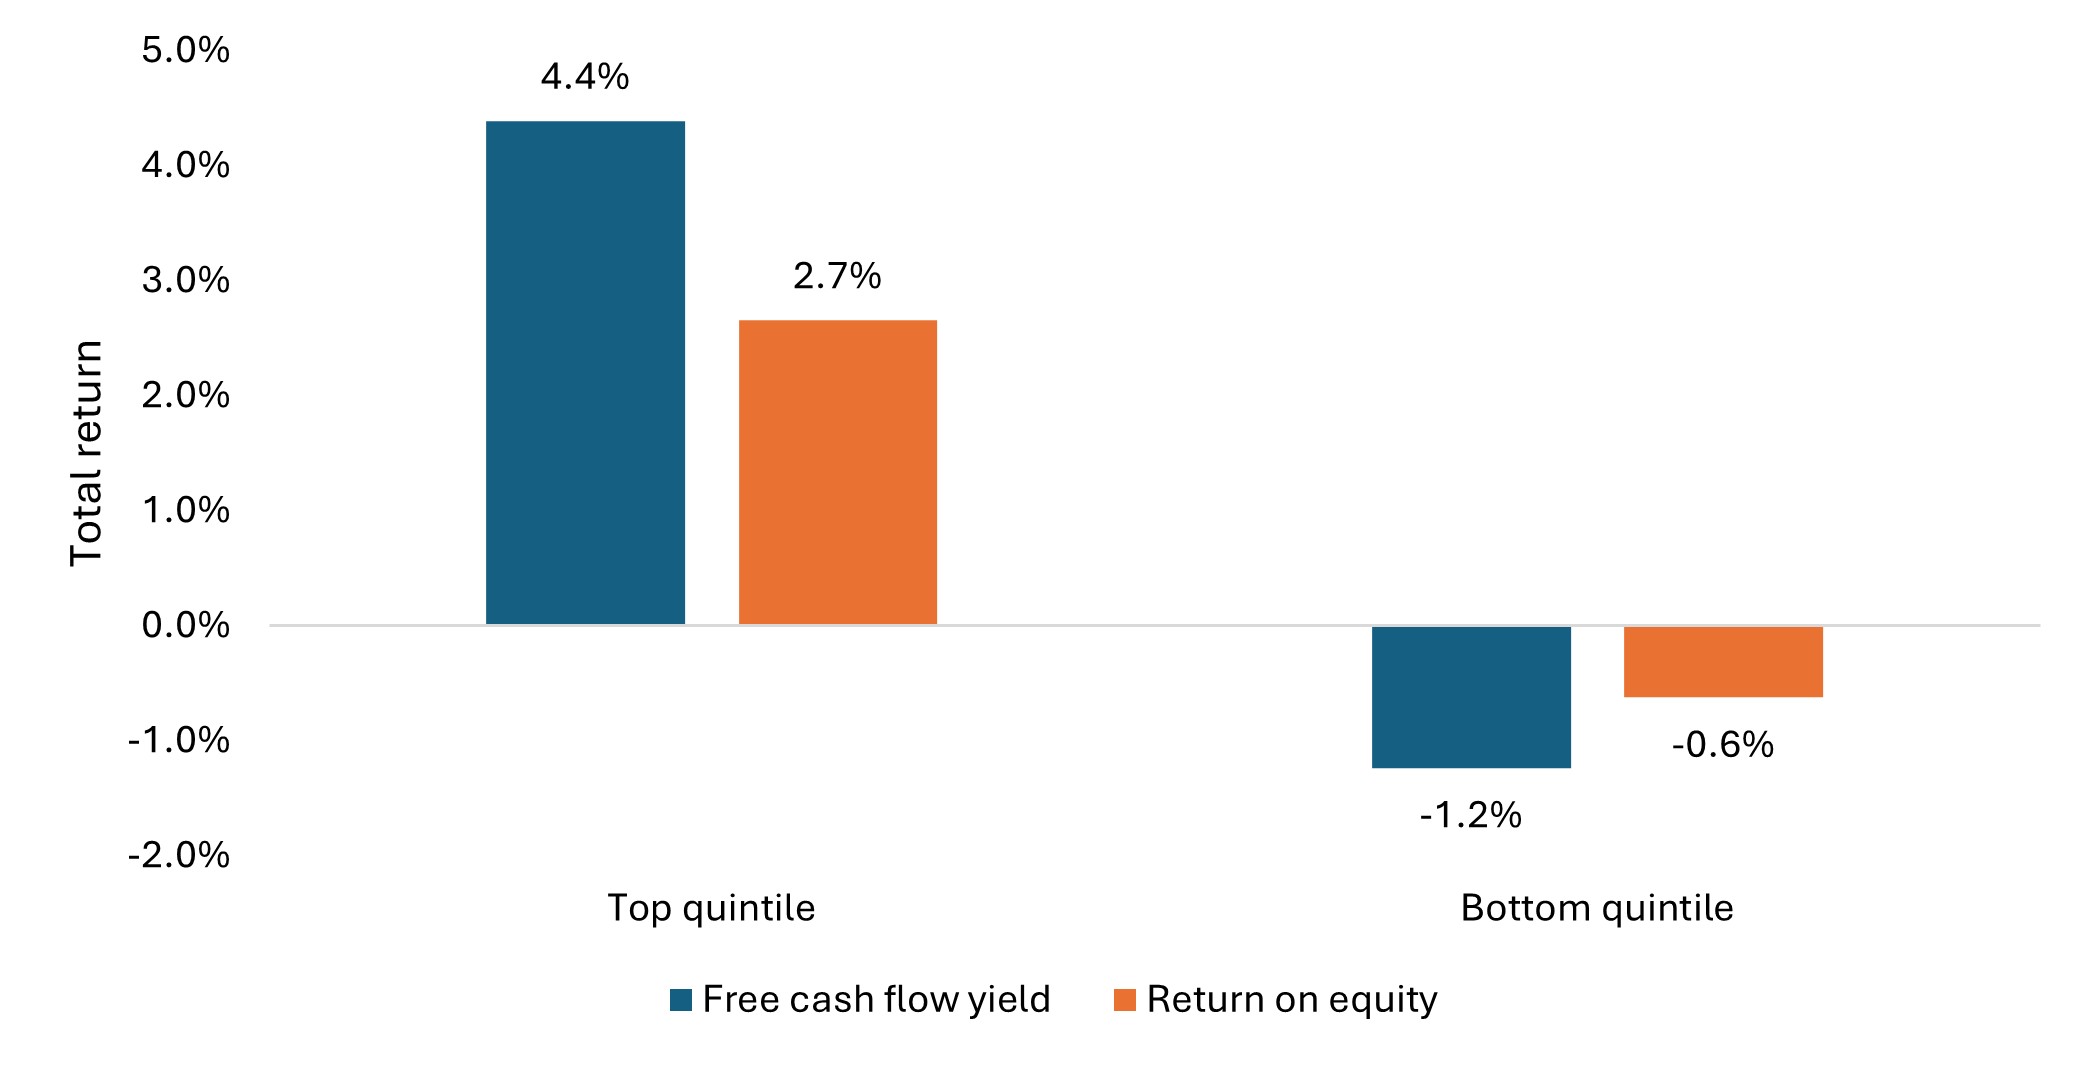
We can quantify this momentum effect by dividing stocks in the small-cap growth universe into quintiles based on their free cash flow yield. In the last three quarters following Liberation Day, the bottom quintile – those burning the most cash – outperformed the top quintile of cash producers by about 8% per quarter. Similarly, the bottom quintile ranked by return on equity (ROE) outperformed the top quintile by nearly 4% (Exhibit 1). Thus, for most of 2025, valuation and quality did not matter.
Exhibit 1: Following the first quarter of 2025, small-cap growth stocks with the highest free cash flow yield and ROE substantially lagged those with the lowest.
Source: Factset data, Russell 2000 Growth Index universe, JHI analysis. Quarterly data, 31 March 2025 to 31 December 2025.
When we examined the earnings quality factor, it declined about 8.7% in 2025. Not only was earnings quality the worst performing factor of the year, but 2025 also marked the factor’s worst year since 1995. In general, it was a very difficult year for quality-related factors and a very strong year for the momentum factor.
That said, we believe the current environment is setting up to be an excellent entry point into quality on a relative basis, because longer-term data tells a different story than 2025’s results.
A longer view of quality
Historically over longer time horizons, quality has been a compensated factor. In other words, from a relative performance perspective, investors have benefited from exposure to companies that have strong, consistent earnings growth. During the Global Financial Crisis, quality was up over 10% in 2008 and posted strong years in 2009, 2010, and 2011. Following recessions, quality has typically outperformed other factors because the factor has historically offered shelter from economic downturns.
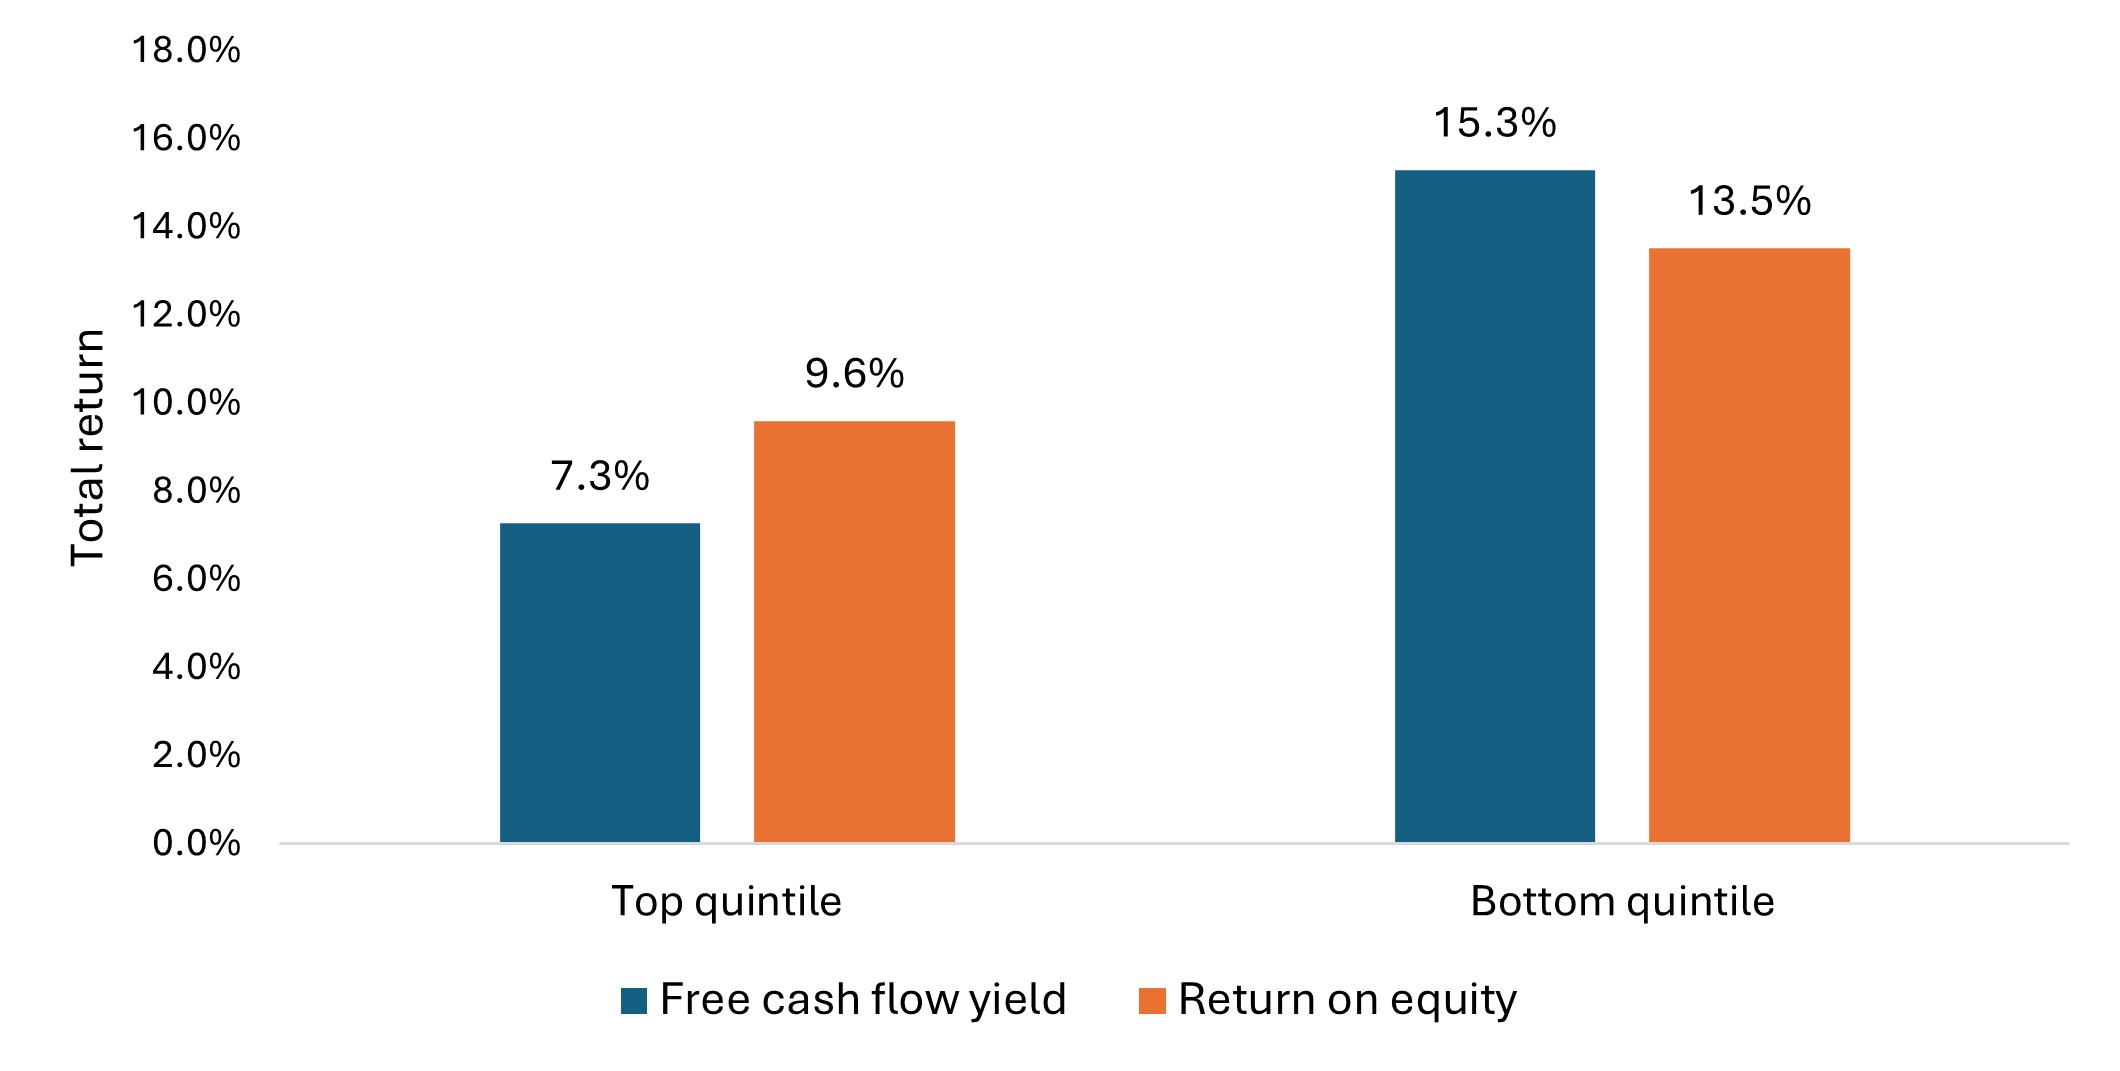
Another measure of quality – free cash flow yield – has historically been a strong indicator of value, and investors have typically been well rewarded for focusing on it. Over the past 20 years, the top quintile by free cash flow yield outperformed the bottom quintile by 5.62% per quarter on average, and the top quintile by ROE outperformed the bottom quintile by 3.28% per quarter (Exhibit 2).
Exhibit 2: Over a 20-year period, small-cap growth stocks with the highest free cash flow yield and ROE have substantially outperformed those with the lowest.
Source: Factset data, Russell 2000 Growth Index universe, JHI analysis. Quarterly data, 31 December 2005 to 31 December 2025.
Balancing exposure for varied market environments
No one can predict precisely when a momentum-driven rally will run out of steam, but the current rally will not persist forever. Long-term data demonstrates the value of being diversified across multiple factors rather than relying on any single factor (Exhibit 3).
Exhibit 3: Over a 20-year period, a diversified model that incorporates valuation, quality, and capital efficiency alongside momentum has shown greater efficacy than momentum alone.
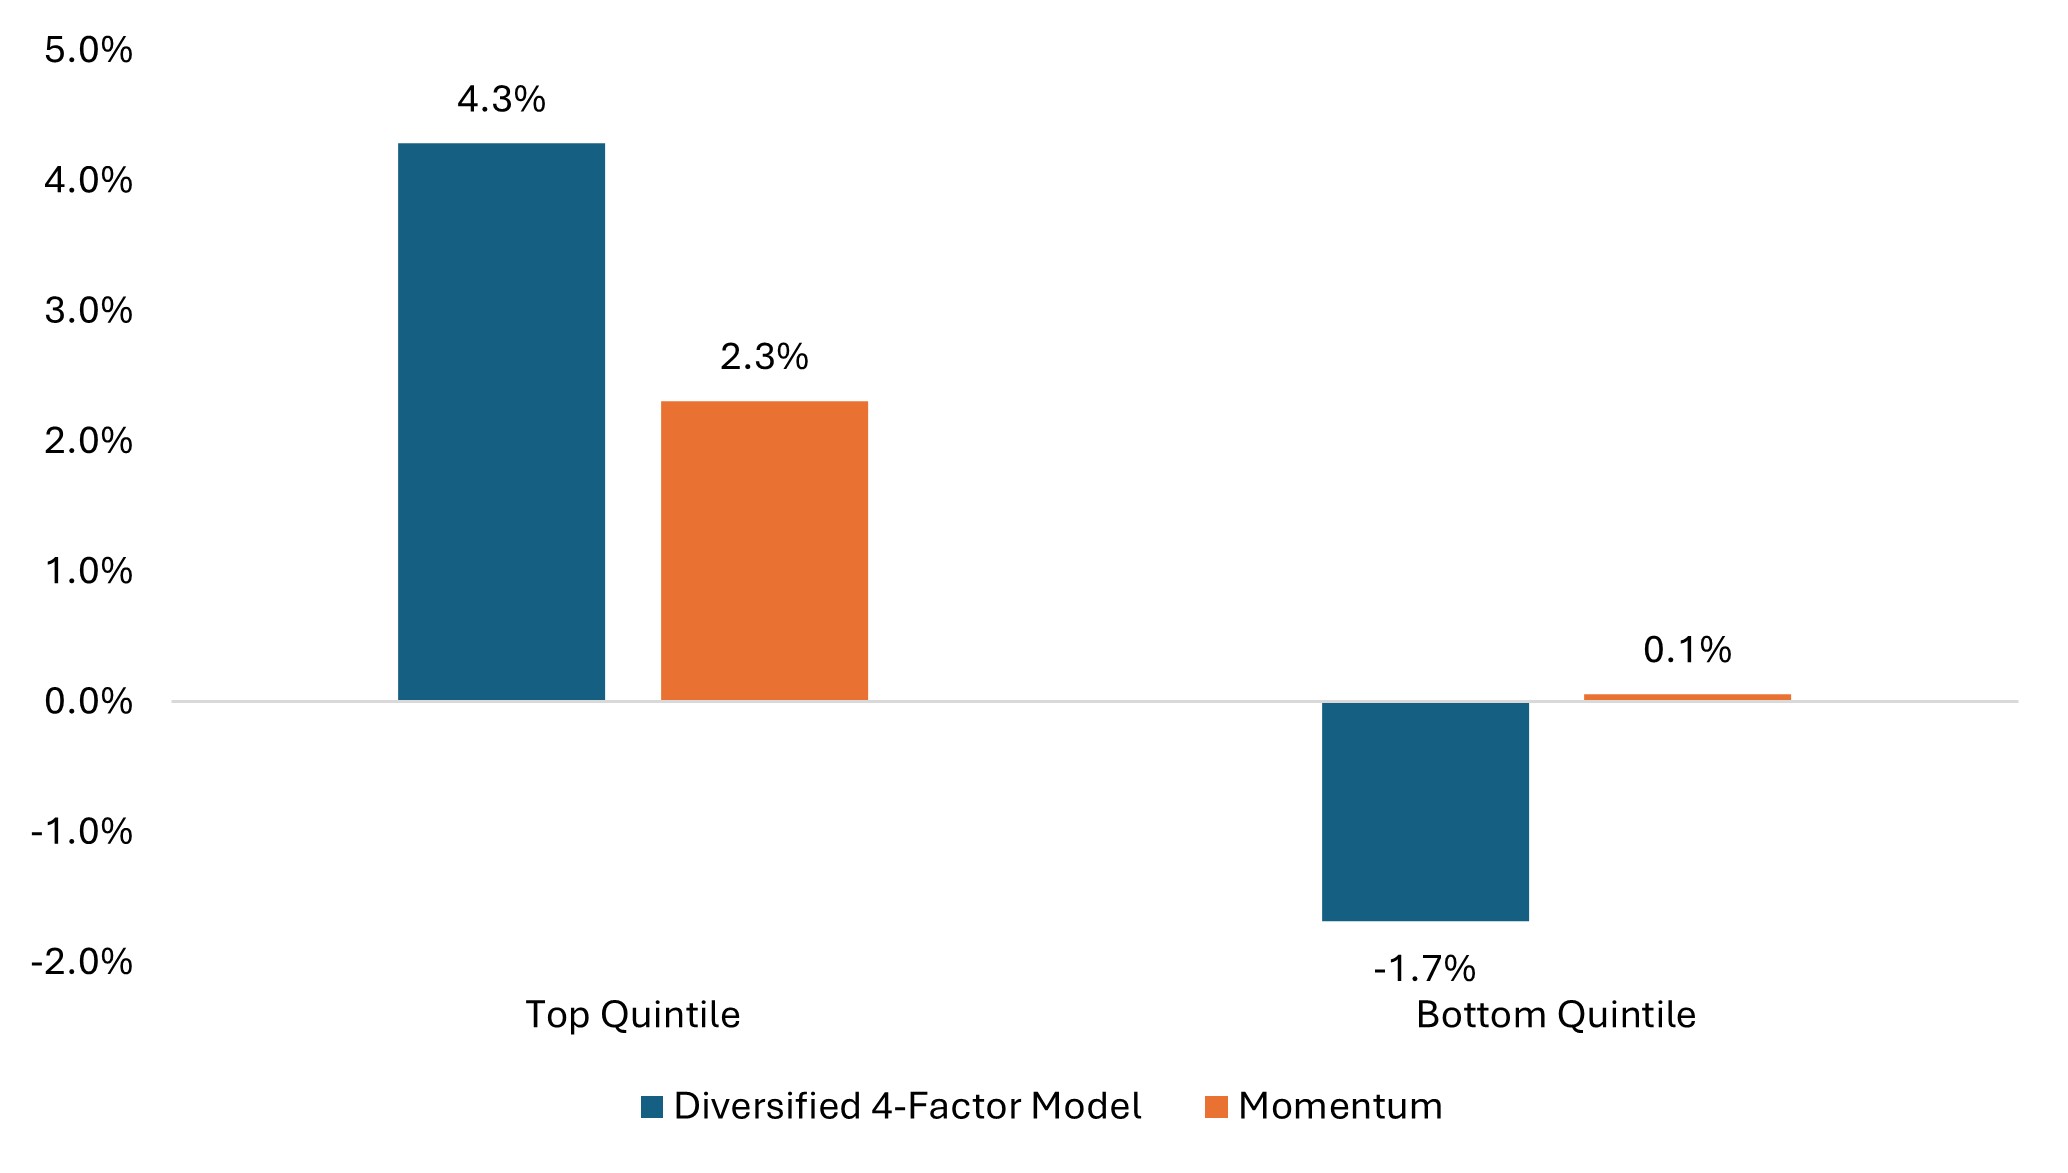
Source: Factset data, Russell 2000 Growth Index universe, JHI analysis. Quarterly data, 31 December 2005 to 31 December 2025.
We believe investors are best served with balanced exposure to multiple factors. This may help portfolios withstand different market environments rather than depending on any single factor to drive returns.
The historic valuation discount in small caps combined with quality’s worst performance in 30 years creates what we view as noteworthy setup as we start 2026. These dislocations suggest opportunity for investors with longer-term horizons willing to look past 2025’s momentum-driven market.
1 Empirical Research Partners Analysis, Portfolio Strategy, October 2025.
A capital efficiency factor captures return premium associated with companies that generate more profit or cash flow per unit of capex employed. Typical metrics used include gross cash flow to capital expenditure, capex growth.
The earnings quality factor as defined by MSCI refers to a measure of the sustainability and reliability of a company’s reported earnings. It evaluates how much of a firm’s earnings are derived from core, recurring business operations versus non-recurring or accounting-driven items.
Free Cash Flow Yield is calculated as last 12-month free cash flow divided by market cap.
Momentum measures the return premium of stocks with high past returns over stocks with low past returns, typically measured using price trends over a certain period.
Price-to-Earnings (P/E) Ratio measures share price compared to earnings per share for a stock or stocks in a portfolio.
A quality factor captures the return premium associated with companies that exhibit strong, stable fundamentals—such as high profitability, low leverage, stable earnings, and efficient management. Typical metrics used include return on equity, return on invested capital, earnings variability, EPS growth, debt-to-equity ratio.
Return on Equity (ROE) is calculated as the earnings per share divided by the book price per share.
The Russell 2000 Index is a small-cap U.S. stock market index that is made up of the smallest 2,000 stocks in the Russell 3000 Index.
A valuation factor captures the return premium associated with cheap (undervalued) vs. expensive stocks, typically measured using a valuation ratio such as: Price-to-Earnings, Price-to-Book, Free Cash Flow Yield.
IMPORTANT INFORMATION
Diversification neither assures a profit nor eliminates the risk of experiencing investment losses.
Smaller capitalization securities may be less stable and more susceptible to adverse developments, and may be more volatile and less liquid than larger capitalization securities.