
Key takeaways:
- Developed markets outside the U.S. offer a large and diverse investment universe with greater exposure to sectors such as financials, industrials, and materials, creating a markedly different investment landscape than the technology-heavy U.S. market.
- The breadth and fragmentation of international equity markets may create inefficiencies that a disciplined factor-based approach can seek to capitalize on, while certain subfactors, such as dividend yield, have historically played a larger role outside the U.S.
- While factor signals can differ across regions, our research suggests factors are more similar across countries than different over the long run. We believe diversification across quality, valuation, capital efficiency, and business momentum offers a more durable approach than relying on any single factor to drive results.
Over the past 15 years, international equity markets have largely taken a backseat to U.S. large caps in the eyes of many investors. However, after a breakout year for non-U.S. equities, that dynamic may be beginning to shift.
The MSCI EAFE Index, a widely followed measure of developed-market equities outside North America, gained 32% in 2025 and outperformed the S&P 500® Index by its widest margin since 1993.1 That strong relative performance has continued thus far in 2026. If the trend holds, it would mark the first consecutive years of ex-U.S. outperformance since 2007, which capped a six-year stretch in which the EAFE outperformed its U.S. counterpart.
While artificial intelligence remains a dominant force across global equities, elevated U.S. market concentration, improving earnings expectations across several developed markets, and a still-meaningful valuation discount relative to U.S. peers have encouraged some investors to look more broadly across the global equity landscape.
We believe the breadth and diversity of developed markets outside the U.S. make them particularly well suited to a disciplined multi-factor approach.
A large and diverse opportunity set
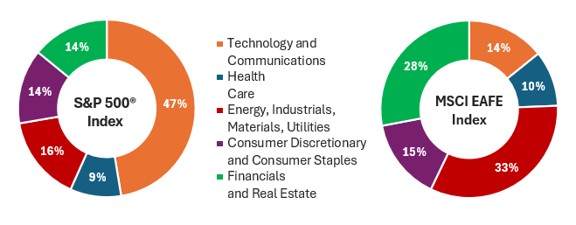
International equity markets offer investors access to hundreds of companies across different geographies, sectors, currencies, and business cycles. The opportunity set also looks markedly different from the U.S. market. While technology and communication services account for nearly half of the S&P 500, the MSCI EAFE Index has far greater representation from financials, industrials, materials, and other economically sensitive sectors.
Exhibit 1: A more diverse, less tech-heavy sector mix outside the U.S.
S&P 500 Index and MSCI EAFE Index GICS sector weightings
Source: S&P Global, MSCI. Data as of 31 August 2026. The MSCI EAFE Index reflects the equity market performance of developed markets, excluding the U.S. and Canada. The S&P 500 Index reflects U.S. large-cap equity performance and represents broad U.S. equity market performance.
In addition to serving as a counterbalance to tech-heavy U.S. exposure, this less homogeneous market composition provides access to a wider range of potential return drivers. In our view, the fragmented nature of international equity markets also has the potential to create inefficiencies that a multi-factor investment framework can seek to capitalize on, much as it has historically done within U.S. small- and mid-cap equities.
The value of a balanced multi-factor framework
No single factor has consistently outperformed across every market environment. Quality, valuation, capital efficiency, and business momentum can each experience extended periods of relative strength and weakness. And as market leadership shifts over time, investors who become overly reliant on any one factor may be exposed to periods of underperformance. Conversely, a multi-factor approach offers the potential to participate when certain factors come into favor, while diversification can help smooth the ride when market dynamics shift.
Business momentum provides a useful example. Broadly speaking, this factor seeks to identify companies exhibiting improving business momentum, such as upward revisions to earnings estimates, alongside positive share-price appreciation – in other words, where fundamentals and market expectations appear to be moving in the same direction. Business momentum has been a powerful driver of returns in recent years, particularly through the latter half of 2025 and again in the spring of this year. However, a sharp reversal during late June and July served as an important reminder about the potential for outsized volatility following stretches of strong outperformance.
By balancing factor exposures, characteristics such as quality and valuation, which have historically exhibited different performance patterns than business momentum, can help provide exposure to a broader set of return drivers. Moreover, that diversification benefit has the potential to contribute to returns across market regimes and over longer time horizons.
While many of the same high-level factors that have historically been effective within U.S. equities have also proven effective internationally, the signals that underpin those factors can differ meaningfully.
Factors through the lens of ex-U.S. equity markets
Value has been one of the most persistent factors across both U.S. and international markets. However, certain valuation subfactors have historically been more powerful in overseas markets. Dividend yield, for example, has been a dominant force in international developed markets. In the U.S., soaring tech valuations, a more growth-oriented sector mix (whose companies often favor reinvestment over dividend payouts), and a general preference for share repurchases have driven down dividend yields over time.
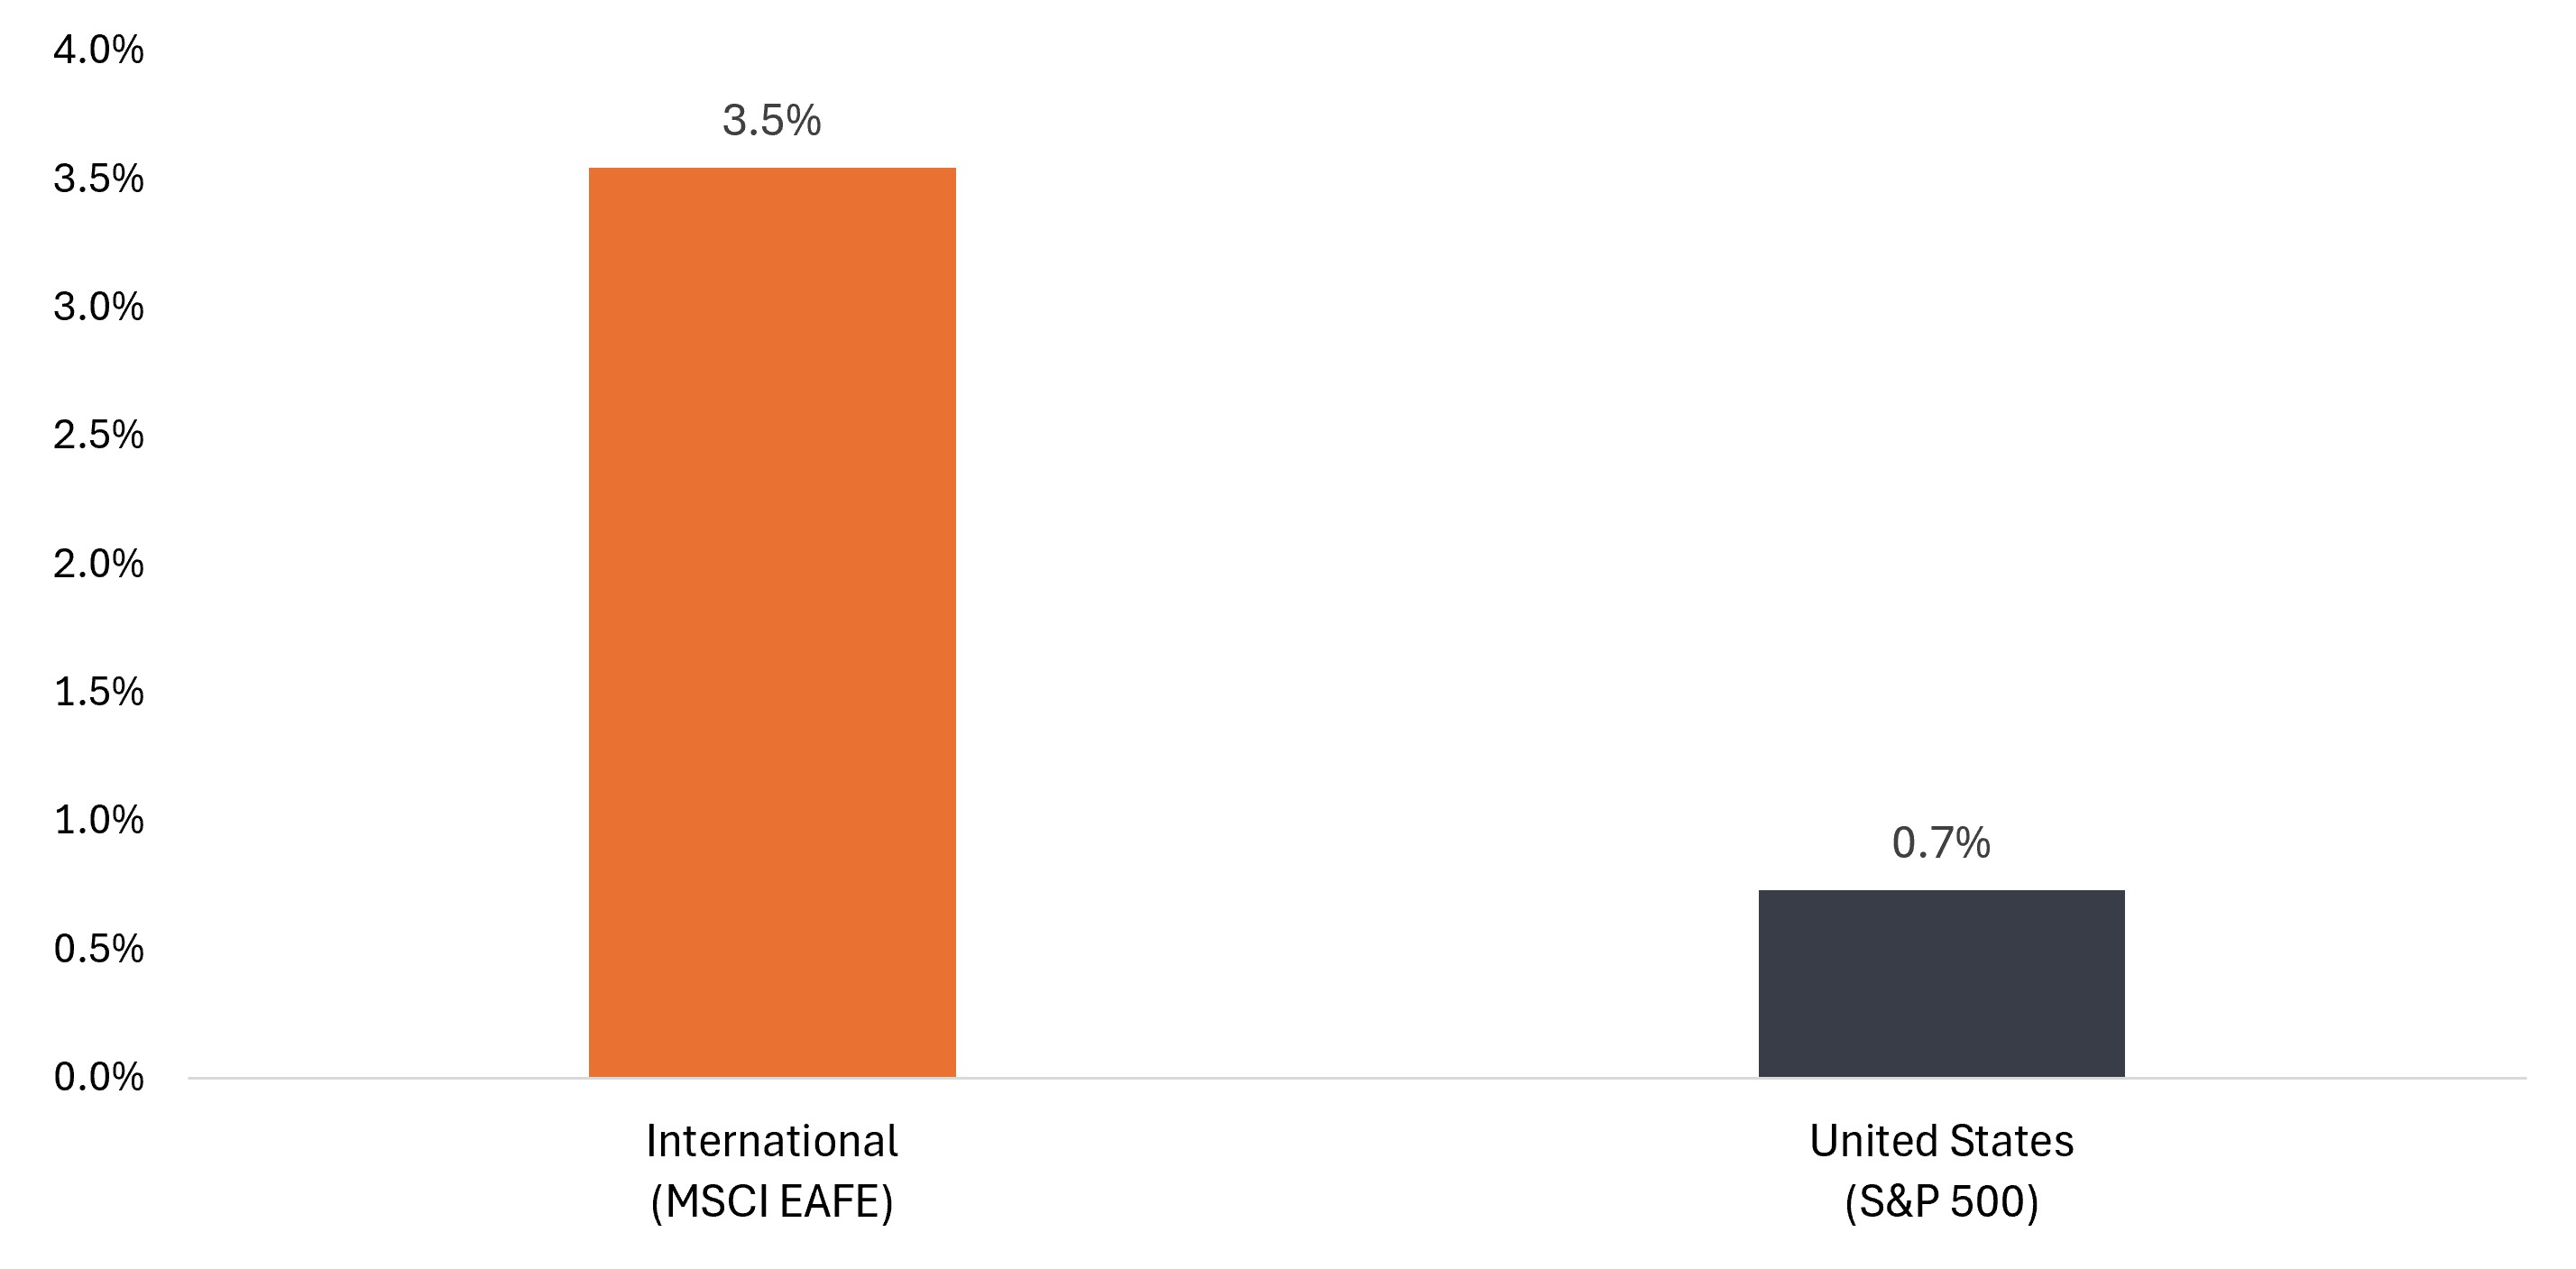
One way we can quantify the difference is by sorting stocks into quintiles based on dividend yield and comparing the returns of the highest- and lowest-ranked cohorts. When viewed through that lens, the contrast is striking. Over the past 20 years, stocks in the highest dividend-yield quintile across the MSCI EAFE universe outperformed those in the lowest quintile by 3.5% annually on average. Over that same timeframe, the performance gap between top and bottom dividend payers in the U.S. was just 0.7%.
Exhibit 2: Dividend yield has been a much stronger return driver in international markets
Total return differential between top and bottom quintiles (quarterly data, annualized)
Source: FactSet data, MSCI EAFE Index universe, JHI analysis. Quarterly data, annualized, from 30 June 2006 to 30 June 2026. Figures show the total return difference between stocks ranked in the top and bottom quintiles for the dividend yield factor. Past performance is no guarantee of future results.
Similar nuances can be found across the quality factor. While profitability metrics such as return on equity (ROE) dominate the tech-heavy U.S. market, these measures can be less influential in developed markets outside the U.S., where the asset-light technology subset plays a smaller role. The heavier weighting in financials also gives more power to quality subfactors such as return-on-assets (ROA) overseas, while return-on-invested-capital (ROIC) and ROE tend to play a larger role in the U.S. market.
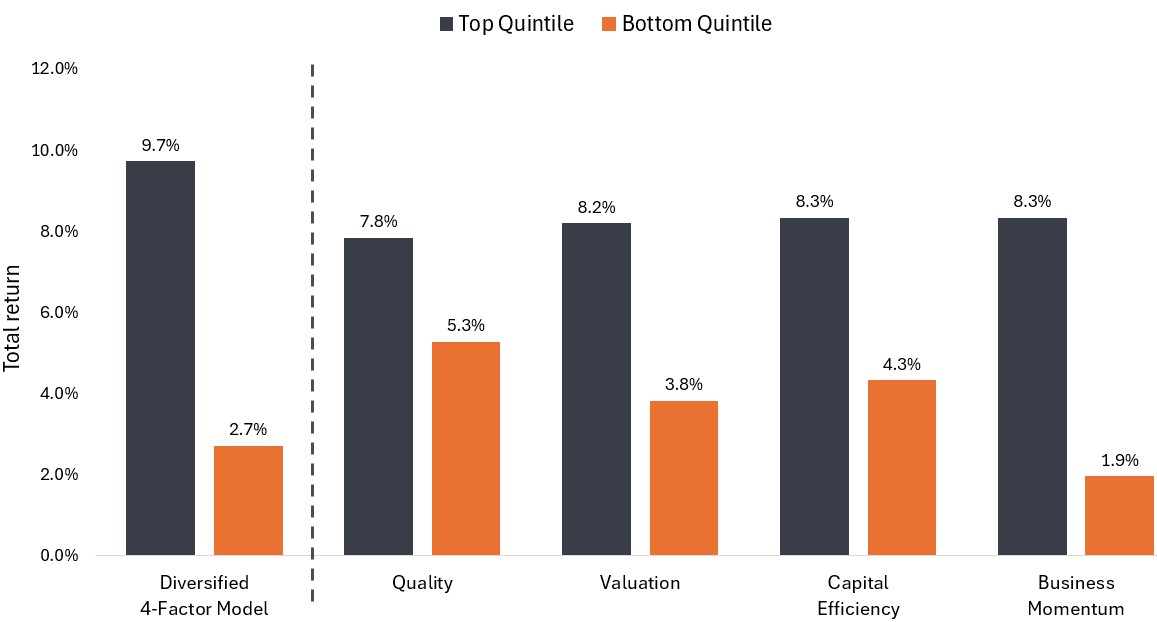
Still, while certain subfactors may carry greater weight in some markets than others, this doesn’t mean investors should chase individual factors that seem to be working at a given moment or attempt to time shifts in regional dynamics. Our research has shown factors to be more similar across countries than different over the long run. Rather, we believe diversification across and within factors offers a more durable approach in managing volatility and navigating evolving market dynamics.
Exhibit 3: Over a 20-year period, a diversified model that incorporates quality, valuation, and capital efficiency alongside business momentum has shown greater efficacy than any one factor alone.
Source: FactSet data, MSCI EAFE Index universe, JHI analysis. Quarterly data, annualized, from 30 June 2006 to 30 June 2026. Past performance is no guarantee of future results.
Bottom line for investors
For investors looking beyond U.S. market leadership, international developed markets offer a large and diverse investment universe, with a broad set of return drivers less tethered to the fortunes of a handful of mega-cap technology companies. They can also provide exposure to different currencies, which may offer diversification benefits should the U.S. dollar weaken.
Yet with that opportunity comes the complexity of investing across varied geographies, business cycles, and policy backdrops. We believe investors are best served by maintaining balanced exposure across multiple factors, which may help portfolios navigate different market environments rather than relying on any single factor to drive results.
1 Source: Bloomberg, data from 31 December 1992 to 31 August 2026, based on annual total returns.
Dividend yield reflects the annual income generated by a stock relative to its share price. It is calculated by dividing annual dividends per share by the share price and is expressed as a percentage.
MSCI EAFE (Europe, Australasia, and Far East) Index reflects the equity market performance of developed markets, excluding the U.S. and Canada.
Return on Assets (ROA) is the measure of a company’s net income divided by the value of its total assets, expressed as a percentage. The ratio measures how effectively a company uses its assets to generate profits.
Return on Equity (ROE) is the measure of a company’s annual return (net income) divided by the value of its total shareholders’ equity, expressed as a percentage. The number represents the total return on equity capital i.e., the profits made for each dollar from shareholders’ equity.
Return on invested capital (ROIC) measures how efficiently a company generates profits from the capital invested in its business. It is calculated by dividing after-tax operating profit by invested capital.
S&P 500® Index reflects U.S. large-cap equity performance and represents broad U.S. equity market performance.
Volatility measures risk using the dispersion of returns for a given investment.
IMPORTANT INFORMATION
Actively managed investment portfolios are subject to the risk that the investment strategies and research process employed may fail to produce the intended results. Accordingly, a portfolio may underperform its benchmark index or other investment products with similar investment objectives.
Artificial intelligence (“AI”) focused companies, including those that develop or utilize AI technologies, may face rapid product obsolescence, intense competition, and increased regulatory scrutiny. These companies often rely heavily on intellectual property, invest significantly in research and development, and depend on maintaining and growing consumer demand. Their securities may be more volatile than those of companies offering more established technologies and may be affected by risks tied to the use of AI in business operations, including legal liability or reputational harm.
Diversification neither assures a profit nor eliminates the risk of experiencing investment losses.
Energy industries can be significantly affected by fluctuations in energy prices and supply and demand of fuels, conservation, the success of exploration projects, and tax and other government regulations.
Equity securities are subject to risks including market risk. Returns will fluctuate in response to issuer, political and economic developments.
Financials industries can be significantly affected by extensive government regulation, subject to relatively rapid change due to increasingly blurred distinctions between service segments, and significantly affected by availability and cost of capital funds, changes in interest rates, the rate of corporate and consumer debt defaults, and price competition.
Foreign securities are subject to additional risks including currency fluctuations, political and economic uncertainty, increased volatility, lower liquidity and differing financial and information reporting standards, all of which are magnified in emerging markets.
Technology industries can be significantly affected by obsolescence of existing technology, short product cycles, falling prices and profits, competition from new market entrants, and general economic conditions. A concentrated investment in a single industry could be more volatile than the performance of less concentrated investments and the market as a whole.