
Soft or hard landing: does it matter for investment grade bonds?
Portfolio Managers James Briggs and Tim Winstone look back at previous Eurozone economic downturns for their impact on investment grade corporate bonds and whether parallels exist with today.


7 minute read
Key takeaways:
- There have been four economic contractions in the Eurozone since 2000, with investment grade corporate bonds outperforming sovereign bonds in three of the four episodes.
- Extending the holding period around the downturn (to account for lack of precision when contractions start and end) typically smooths extremes in excess return and turns total return positive in all four periods.
- Looking at starting characteristics of past downturns, today’s investment grade corporate bond market has some commonalities with a deep economic downturn despite being priced more for a shallow downturn, in our view, warranting some caution.
Soft or hard? That’s the dilemma facing markets and we’re not talking about cheese. Can central banks engineer a soft landing for the economy or will they provoke a hard landing with a deep recession? We take a look at previous economic downturns in the Eurozone and whether there might be lessons for today’s euro investment grade (IG) corporate bond market.
During the last 25 years the Eurozone has had four contraction/recessionary episodes, as represented by periods of negative quarterly real gross domestic product (GDP) growth. The automatic assumption might be that holding government bonds over corporate bonds would be a good strategy in a period of economic weakness. History suggests that is only true in hard landings.
The four eurozone economic contractions are:
- 2003 Iraq War (Q1 2003 short contraction)
- 2008/9 Global Financial Crisis (Q2 2008 to Q1 2009 deep recession)
- 2011/13 Eurozone Debt Crisis (Q4 2011 to Q1 2013 protracted shallow recession)
- 2020 COVID Pandemic (Q1 2020 to Q4 2020 V-shaped recession)
The ICE BofA Euro Corporate Index is a basket of Euro investment grade corporate bonds. Returns data is available for both total return (combined income and capital movements) and excess returns. The excess return isolates the portion of performance that is attributed solely to credit and is equal to the corporate bond(s) total return minus the total return on a risk-matched basket of government bonds. It essentially displays the excess return on an index that comes from the additional yield that corporate bonds accrue over government bonds of the same maturity and the effect of any change in credit spreads over the period.
Figure 1 shows that in three out of the four periods, holding investment grade corporate bonds was more rewarding than holding government bonds. Incidentally, investment grade bonds also outperformed equities (as represented by the MSCI Europe ex UK Total Return Index) in three out of the four periods (the exception being the 2011-13 debt crisis).1
Figure 1: Total and excess returns of Euro investment grade corporate bonds during economic contractions (annualised figures)
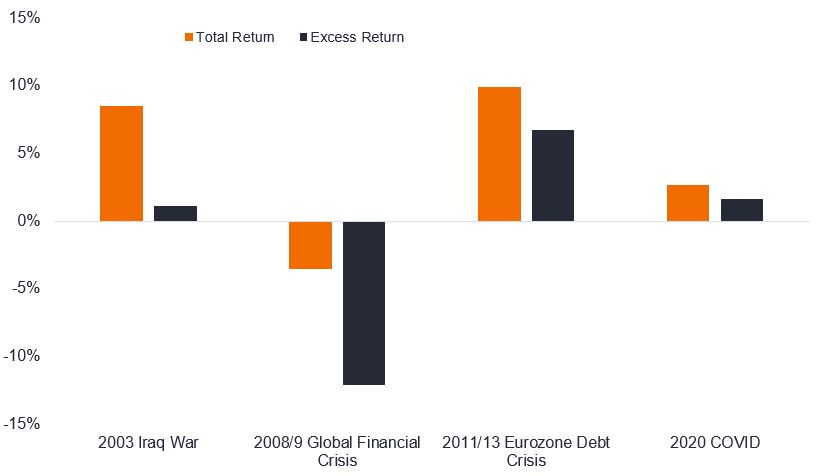
Source: Janus Henderson, Bloomberg, ICE BofA Euro Corporate Index, total returns and excess returns in euro. All economic contraction periods are inclusive (Iraq War = Q1 2003, Global Financial Crisis = Q2 2008 to Q1 2009, Eurozone debt crisis = Q4 2011 to Q1 2013, COVID = Q1 2020 to Q4 2020). Annualised figures convert the cumulative return for a period into an an annual rate. Past performance does not predict future returns.
To correct for the fact that recessions do not just start and finish at the same time for all companies, i.e. some corporates will be affected earlier or later by economic weakness, in Figure 2 we expanded the period around the contractions to cover the preceding six months and the following six months. This turns total return positive in all the longer periods and tends to soften the extremes of excess return, i.e. lowers strong positive excess return and reduces negative excess return.
Figure 2: Total and excess returns of Euro investment grade corporate bonds during economic contractions plus six months either side (annualised figures)
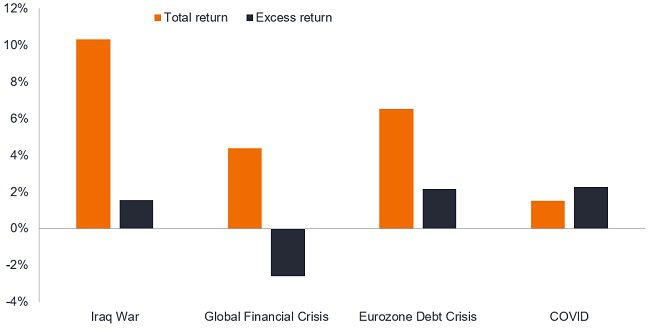
Source: Source: Janus Henderson, Bloomberg, ICE BofA Euro Corporate Index, total returns and excess returns in euro. Periods in bold in brackets reflect the period shown, which comprises the six months before the contraction, the contraction period itself plus the six months after the contraction, all periods are inclusive. Iraq War = Q1 2003 (Q3 2002 to Q3 2003), Global Financial Crisis = Q2 2008 to Q1 2009 (Q4 2007 to Q3 2009), Eurozone debt crisis = Q4 2011 to Q1 2013 (Q2 2011 to Q3 2013), COVID = Q1 2020 to Q4 2020 (Q3 2019 to Q2 2021). Past performance does not predict future returns.
Given the uncertainty in the market about whether we will experience a hard or soft landing, the previous episodes are instructive. They reveal that it has historically made more sense to own investment grade corporate bonds over government bonds in all but the most severe economic contractions.
Accounting for differences
Of course, each of the four contractionary periods was different. But that can be helpful. We can look for similarities and differences among past contractions compared with today. In the table below we have colour coded green where factors are similar to today.
Figure 3: Eurozone economic and Euro Investment Grade (IG) factors at start of contraction
| Factor at start of contraction | 2003 Iraq War | 2008 Global Financial Crisis | 2011 Debt Crisis | 2020 COVID | 28 February 2023 |
|---|---|---|---|---|---|
| Extent of GDP contraction during downturn | -0.3% | -5.7% | -1.8% | -4.1% | ? |
| Inflation rate | 2.3% | 3.6% | 3.0% | 1.3% | 8.5% (Jan ’23) |
| Inflation falling or rising | Flat | Rising | Rising | Rising | Falling |
| ECB policy rate (refinance) | 2.75% | 4.0% | 1.5% | 0.0% | 3.0% |
| ECB policy rate falling or rising trend | Falling | Rising | Rising | Flat | Rising |
| Effective duration | 4.24 | 4.47 | 3.91 | 5.22 | 4.64 |
| Yield to worst on Euro IG | 4.41% | 5.63% | 4.06% | 0.51% | 4.32% |
| Yields falling or rising | Falling | Rising | Rising | Rising | Rising |
| Credit spread on Euro IG (basis points) | 96 | 179 | 299 | 94 | 147 |
| Unemployment rate | 9.0% | 7.4% | 10.5% | 7.5% | 6.6% (Dec ’22) |
| PMI manufacturing | 48.4 | 52 | 48.5 | 46.3 | 48.5 |
| Price (% of par weight on Euro IG) | 104 | 95 | 100 | 106 | 89 |
Source: Janus Henderson, Bloomberg: Eurozone real GDP at 2010 prices, inflation = Eurozone Harmonised Index of Consumer Prices, year on year % change, European Central Bank (ECB) policy refinancing rate, Eurostat Eurozone unemployment rate, Eurozone Manufacturing Purchasing Manager Index (a figure below 50 indicates contraction); ICE BofA Euro Corporate Index: yield to worst, credit spread = Govt option-adjusted spread (OAS), basis point (bp) equals 1/100 of a percentage point. 1 bp = 0.01%, 100 bps = 1%, effective duration, par weight price (price of a bond as a % of its face value, showing weighted average for the index). Figures in columns consecutively dated as at 31/12/2002, 31/03/2008, 30/09/2011, 31/12/2019 and 28/02/2023 (or latest figure available). Past performance does not predict future returns.
At first glance it looks disparate, but we should expect that as today’s environment is not a perfect match with any of the past contractions. If it were, investing might be a lot easier. The clearest distinction is inflation. In all previous episodes it was either flat or rising. Today it has rolled over and is coming down from a peak but the recent peak was much higher than at the start of previous economic downturns. How quickly it subsides will affect central bank policymaking so it remains a key variable for interest rate risk.
The colour coding in the table ominously has the most commonalities with the 2008 Global Financial Crisis (GFC) recession. Recall this was the downturn that resulted in negative excess return. Today’s yield and spread are below the levels at the start of 2008, which marries with our view that today’s market warrants some caution as it is not pricing in a severe recession. Despite the geopolitical risks emanating from Russia/Ukraine, however, we do not see the same systemic risk within the financial system that existed within the banking sector pre-GFC. Today, the banking sector is better capitalised and the coming downturn in our view is a more traditional economic downturn focused on consumer/corporate retrenchment, which ought to be less severe than a financial crisis.
Today’s yields and spreads are similar or higher than shallow recessions, potentially justifying current market pricing if the economy achieves a soft landing or shallow contraction. Another notable difference is that prices today are well below par values, creating a helpful pull to par. Judging against these parameters, Euro investment grade corporate bonds may be fairly priced for a shallow downturn and potentially offer value if the economy could avoid a recession altogether. Much will rest on how quickly inflation can recede and the response of central banks.
1Source: Janus Henderson, Bloomberg, MSCI Europe ex UK, ICE BofA Euro Corporate Index, total returns in USD. Periods as per Figure 1. Past performance does not predict future returns.
Credit spread: The difference in yield between securities with similar maturity but different credit quality. Widening spreads generally indicate deteriorating creditworthiness of corporate borrowers, and narrowing indicate improving.
Effective duration: The percentage change in the price of a bond given a parallel shift in the government bond yield curve. For an index, it is the average of its constituent security effective durations, weighted by full market value. For example, an effective duration of 5 means a rise in yield of 100 basis points or 1% would be expected to cause a fall in the bond price of 5%, and vice versa.
ICE BofA Euro Corporate Index: A measure of Euro denominated investment grade corporate debt publicly issued in the euro domestic or Eurobond markets.
Inflation: The annual rate of change in prices, typically expressed as a percentage rate. The Consumer Price Index (CPI) is a measure of the average change over time in the prices paid by urban consumers for a market basket of consumer goods and services.
Interest rate risk: The risk to bond prices caused by changes in interest rates. Bond prices move in the opposite direction to their yields, so a rise in rates and yields causes bond prices to fall and vice versa.
Investment grade: A bond typically issued by governments or companies perceived to have a relatively low risk of defaulting on their payments. The higher quality of these bonds is reflected in their higher credit ratings.
Monetary policy: The policies of a central bank, aimed at influencing the level of inflation and growth in an economy. It includes controlling interest rates and the supply of money.
Par value: The face value of the security, the amount that will be paid back on maturity.
Recession: A significant decline in economic activity lasting longer than a few months. A soft landing is a slowdown in economic growth that avoids a recession or the recession is shallow. A hard landing is a deep recession.
Volatility: The rate and extent at which the price of a portfolio, security or index moves up and down. If the price swings up and down with large movements, it has high volatility. If the price moves more slowly and to a lesser extent, it has lower volatility. The higher the volatility means the higher the risk of the investment.
Yield: The level of income on a security or index, typically expressed as a percentage rate.
Yield to worst (YTW) is the lowest yield a bond can achieve provided the issuer does not default and accounts for any applicable call feature (i.e. the issuer can call the bond back at a date specified in advance). At an index or portfolio level, this statistic represents the weighted average YTW for all the underlying issues.
Queste sono le opinioni dell'autore al momento della pubblicazione e possono differire da quelle di altri individui/team di Janus Henderson Investors. I riferimenti a singoli titoli non costituiscono una raccomandazione all'acquisto, alla vendita o alla detenzione di un titolo, di una strategia d'investimento o di un settore di mercato e non devono essere considerati redditizi. Janus Henderson Investors, le sue affiliate o i suoi dipendenti possono avere un’esposizione nei titoli citati.
Le performance passate non sono indicative dei rendimenti futuri. Tutti i dati dei rendimenti includono sia il reddito che le plusvalenze o le eventuali perdite ma sono al lordo dei costi delle commissioni dovuti al momento dell'emissione.
Le informazioni contenute in questo articolo non devono essere intese come una guida all'investimento.
Comunicazione di Marketing.
Important information
Please read the following important information regarding funds related to this article.
- Gli emittenti di obbligazioni (o di strumenti del mercato monetario) potrebbero non essere più in grado di pagare gli interessi o rimborsare il capitale, ovvero potrebbero non intendere più farlo. In tal caso, o qualora il mercato ritenga che ciò sia possibile, il valore dell'obbligazione scenderebbe.
- L’aumento (o la diminuzione) dei tassi d’interesse può influire in modo diverso su titoli diversi. Nello specifico, i valori delle obbligazioni si riducono di norma con l'aumentare dei tassi d'interesse. Questo rischio risulta di norma più significativo quando la scadenza di un investimento obbligazionario è a più lungo termine.
- Il Fondo investe in obbligazioni ad alto rendimento (non investment grade) che, sebbene offrano di norma un interesse superiore a quelle investment grade, sono più speculative e più sensibili a variazioni sfavorevoli delle condizioni di mercato.
- Alcune obbligazioni (obbligazioni callable) consentono ai loro emittenti il diritto di rimborsare anticipatamente il capitale o di estendere la scadenza. Gli emittenti possono esercitare tali diritti laddove li ritengano vantaggiosi e, di conseguenza, il valore del Fondo può esserne influenzato.
- Un Fondo che presenta un’esposizione elevata a un determinato paese o regione geografica comporta un livello maggiore di rischio rispetto a un Fondo più diversificato.
- Il Fondo potrebbe usare derivati al fine di conseguire il suo obiettivo d'investimento. Ciò potrebbe determinare una "leva", che potrebbe amplificare i risultati dell'investimento, e le perdite o i guadagni per il Fondo potrebbero superare il costo del derivato. I derivati comportano rischi aggiuntivi, in particolare il rischio che la controparte del derivato non adempia ai suoi obblighi contrattuali.
- Qualora il Fondo detenga attività in valute diverse da quella di base del Fondo o l'investitore detenga azioni o quote in un'altra valuta (a meno che non siano "coperte"), il valore dell'investimento potrebbe subire le oscillazioni del tasso di cambio.
- Se il Fondo, o una sua classe di azioni con copertura, intende attenuare le fluttuazioni del tasso di cambio tra una valuta e la valuta di base, la stessa strategia di copertura potrebbe generare un effetto positivo o negativo sul valore del Fondo, a causa delle differenze di tasso d’interesse a breve termine tra le due valute.
- I titoli del Fondo potrebbero diventare difficili da valutare o da vendere al prezzo e con le tempistiche desiderati, specie in condizioni di mercato estreme con il prezzo delle attività in calo, aumentando il rischio di perdite sull'investimento.
- Le spese correnti possono essere prelevate, in tutto o in parte, dal capitale, il che potrebbe erodere il capitale o ridurne il potenziale di crescita.
- I CoCo (Obbligazioni contingent convertible) possono subire brusche riduzioni di valore in caso d’indebolimento della solidità finanziaria di un emittente e qualora un evento trigger prefissato comporti la conversione delle obbligazioni in azioni dell’emittente o il loro storno parziale o totale.
- Il Fondo potrebbe perdere denaro se una controparte con la quale il Fondo effettua scambi non fosse più intenzionata ad adempiere ai propri obblighi, o a causa di un errore o di un ritardo nei processi operativi o di una negligenza di un fornitore terzo.
Specific risks
- Gli emittenti di obbligazioni (o di strumenti del mercato monetario) potrebbero non essere più in grado di pagare gli interessi o rimborsare il capitale, ovvero potrebbero non intendere più farlo. In tal caso, o qualora il mercato ritenga che ciò sia possibile, il valore dell'obbligazione scenderebbe.
- L’aumento (o la diminuzione) dei tassi d’interesse può influire in modo diverso su titoli diversi. Nello specifico, i valori delle obbligazioni si riducono di norma con l'aumentare dei tassi d'interesse. Questo rischio risulta di norma più significativo quando la scadenza di un investimento obbligazionario è a più lungo termine.
- Un Fondo che presenta un’esposizione elevata a un determinato paese o regione geografica comporta un livello maggiore di rischio rispetto a un Fondo più diversificato.
- Il Fondo potrebbe usare derivati al fine di conseguire il suo obiettivo d'investimento. Ciò potrebbe determinare una "leva", che potrebbe amplificare i risultati dell'investimento, e le perdite o i guadagni per il Fondo potrebbero superare il costo del derivato. I derivati comportano rischi aggiuntivi, in particolare il rischio che la controparte del derivato non adempia ai suoi obblighi contrattuali.
- Qualora il Fondo detenga attività in valute diverse da quella di base del Fondo o l'investitore detenga azioni o quote in un'altra valuta (a meno che non siano "coperte"), il valore dell'investimento potrebbe subire le oscillazioni del tasso di cambio.
- Se il Fondo, o una sua classe di azioni con copertura, intende attenuare le fluttuazioni del tasso di cambio tra una valuta e la valuta di base, la stessa strategia di copertura potrebbe generare un effetto positivo o negativo sul valore del Fondo, a causa delle differenze di tasso d’interesse a breve termine tra le due valute.
- I titoli del Fondo potrebbero diventare difficili da valutare o da vendere al prezzo e con le tempistiche desiderati, specie in condizioni di mercato estreme con il prezzo delle attività in calo, aumentando il rischio di perdite sull'investimento.
- Le spese correnti possono essere prelevate, in tutto o in parte, dal capitale, il che potrebbe erodere il capitale o ridurne il potenziale di crescita.
- Il Fondo potrebbe perdere denaro se una controparte con la quale il Fondo effettua scambi non fosse più intenzionata ad adempiere ai propri obblighi, o a causa di un errore o di un ritardo nei processi operativi o di una negligenza di un fornitore terzo.
Specific risks
7 minute read
Key takeaways:
- There have been four economic contractions in the Eurozone since 2000, with investment grade corporate bonds outperforming sovereign bonds in three of the four episodes.
- Extending the holding period around the downturn (to account for lack of precision when contractions start and end) typically smooths extremes in excess return and turns total return positive in all four periods.
- Looking at starting characteristics of past downturns, today’s investment grade corporate bond market has some commonalities with a deep economic downturn despite being priced more for a shallow downturn, in our view, warranting some caution.