
Key takeaways:
- Step back a year and bond investors had a difficult journey in 2022 but the starting point today is one of relatively high yields and refreshed diversification potential within a portfolio.
- The time gap between cause and effect means accumulated policy tightening is likely to be felt more forcefully by weaker borrowers in coming months, underscoring the need for careful credit assessment.
- Receding inflation and a potential turn in the hiking cycle augur well for rate sensitive areas of the market. But investors may face some volatility given the potential for a reduction in liquidity in the second half of 2023.
Delivered in firm voices, the safety announcements are hard to miss. “Step back” insists Washington’s Metro, while London’s Underground compels you to “mind the gap”. Both are commands worth heeding not just for one’s personal safety when travelling but as useful instructions in helping understand the risks and opportunities in today’s fixed income markets.
Step back #1
Fixed income markets have moved a long way in 18 months, and it is worth reflecting where they have come from. In 2022, they were understandably unloved as concerted monetary tightening by central banks led to a sharp rise in yields and fall in bond prices. Today, sentiment towards bonds is very different.
Global flows into fixed income are firmly in positive territory. EPFR Global reports US$152 billion entered fixed income funds year to date.1 The principal driver is the income available: Yields of nearly 5% are achievable on 1-year US Treasury Bills and even 1-year German Bunds yield 3.2%, a world away from the negative yields on offer as recently as May 2022.
The higher yields cascade down the quality spectrum, with the average yield on global investment grade corporate bonds offering 5.1% and high yield (sub-investment grade) bonds offering 9.0% as represented by the ICE BofA Global Corporate Index and the ICE BofA Global High Yield Index.2 With the economic outlook uncertain, investors are once again finding attractions in an asset class offering income, relative capital security and a potential diversifier to equity holdings. We expect this to continue.
Step back #2
The past is still affecting us. We may think that the COVID emergency ended a while ago, but its effects linger. It was only in the first quarter of this year that China moved to fully reopen. In many sectors across the world, revenues and costs remain out of kilter as tourism and leisure spending bounces back yet goods spending fades. Stimulus checks and accumulated savings during COVID are only just now being exhausted. The supply chain disruption that contributed to rising costs in the last couple of years has reversed.
Figure 1: Pricing pressures dissipate as global supply chain pressures ease
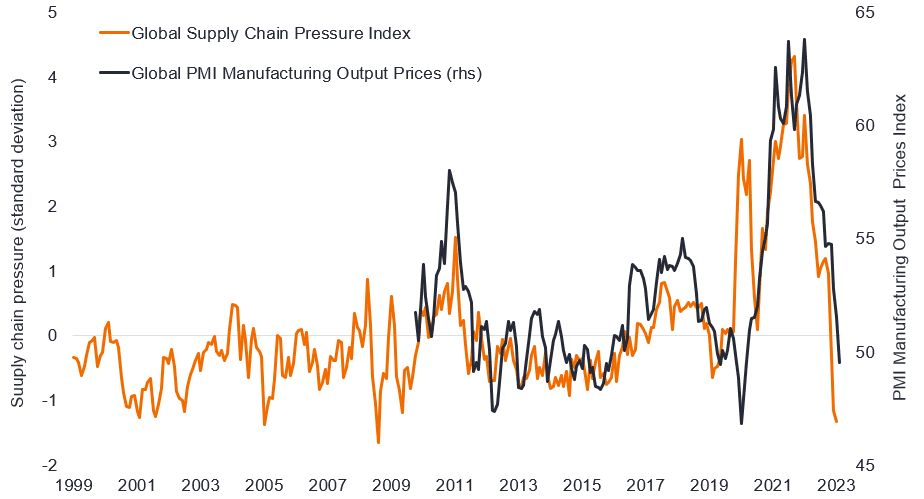
Source: Refinitiv Datastream, Federal Reserve of New York, April 1999 to April 2023. Supply chain pressure index is normalised, such that zero indicates an average value, with positive values representing greater pressure, negative values less pressure (in standard deviations). S&P Global Manufacturing Purchasing Manager Index (PMI) Manufacturing Output Prices, a figure above 50 indicates rising prices while a figure below 50 indicates falling prices.
All of this makes trying to get a handle on economic and corporate performance challenging as year-on-year comparisons remain distorted. Is disinflation a welcome sign that supply chains are back to normal or an early warning of demand destruction? These are all factors that policymakers are grappling with and may incline them to wait for clear trends in data before changing policy.
Mind the gap #1
Time lags have muddied the signals from lead indicators and continue to affect inflation data. For instance, housing costs continue to climb in official US inflation figures, even as more timely coincidental rental data show a fading in rental inflation. Inverted yield curves (longer dated bonds yielding less than shorter-dated bonds of similar credit quality) have historically been a signal that a recession is forthcoming.
Lags, however, are highly variable. Research showed that since 1969, the time gap between the 3-month/10-year yield curve inverting (for at least 10 consecutive trading days) and the beginning of a recession ranged from five to 16 months.3 Stress in this cycle will take longer to unfold, a reflection of the extreme disconnect between nominal and real growth. Yes, there is a slowdown, but nominal growth has been flattered by higher inflation. US nominal gross domestic product (GDP) growth was a stunning +10.7% in 2021 and only slowed to +9.2% in 2022 – two of the strongest readings in the last four decades.4 We tend to forget that there are winners from unforeseen inflation – namely borrowers.
Mind the gap #2
Higher interest rates have exposed financing gaps. One of the ironies of the recent banking turmoil was that it was not recession or an economic slowdown that brought down Silicon Valley Bank but the combination of large unrealised losses and the gap between the speed at which it could raise funds and meet withdrawals from depositors. This is not a normal credit cycle, and banks are on the losing end of the above ‘nominal/real disconnect’, which has played out in inflicting bond losses in 2022.
The turmoil has shone a spotlight on the health of balance sheets and financing costs across companies. Again, if we step back a year or two, many companies did a lot of refinancing at low rates and termed out their debt. For now, there is no big maturity wall until 2025, although markets and companies tend to start thinking about refinancing 12 months ahead. Many companies have several bonds in issue that mature sequentially over time, so they can typically cope with a sharp jump in rates as it only affects a small proportion of their debt. The concern is for companies with large proportions of floating rate debt or large fixed debt maturities requiring refinancing. For example, those that issued a bond several years ago at 4% now face having to pay a yield of 9% to refinance. Defaults are coming.
Struggling companies are unlikely to find banks especially receptive. Banks were tightening lending standards even before the recent banking turmoil, which has only served to tighten credit conditions further. Tighter credit conditions typically herald weaker GDP growth and higher default rates, warranting caution towards stressed borrowers in more cyclical sectors.
Figure 2: Will corporate defaults follow the typical historical path?
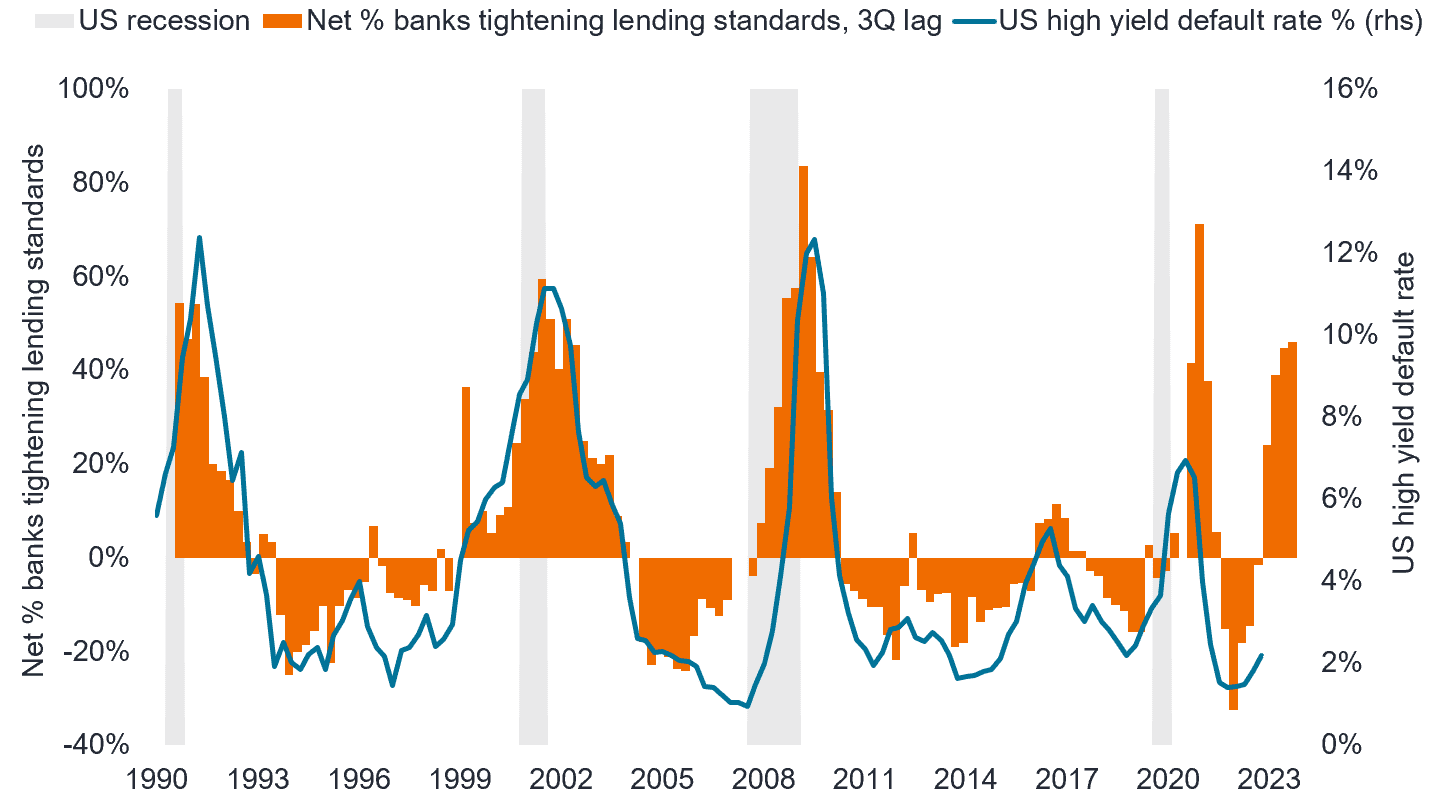
Source: Deutsche Bank, Janus Henderson Investors, Bloomberg, Federal Reserve Senior Loan Officer Opinion Survey, net % of banks tightening lending standards (large and medium firms), US high yield default rate, 30 June 1990 to 30 April 2023. There is no guarantee that past trends will continue or forecasts will be realised. Past performance does not predict future returns.
Mind the gap #3
Liquidity fuels markets. One of the curiosities of the past six months was that while the US Federal Reserve (Fed) was engaging in quantitative tightening (QT), allowing its balance sheet to shrink by up to US$95bn a month, equity markets and other risk assets continued to perform well. This was partly explained by balance sheet expansion by other central banks, such as the People’s Bank of China, offsetting the Fed, together with emergency funding to prevent financial instability following the banking turmoil in March. Even the debt ceiling impasse in the US had the effect of releasing nearly US$500bn into the economy as the Treasury General Account (TGA) was drawn down.
The second half of 2023 is likely to see heavy Treasury Bill issuance as the US government seeks to rebuild funds in the TGA, while the Fed is draining dollars from the system with QT. Throw into the mix QT from the European Central Bank and the Bank of England, and the stage could be set for further volatility.
The light at the end of the tunnel
The enemy of bonds has always been inflation, but with that threat beginning to recede and interest rates likely to peak in the coming months, duration is becoming less of an ugly word. Historically, one of the best times to own fixed income has been when policymakers make their last rate hike in a hiking cycle, which could augur well for rate-sensitive areas such as government bonds and investment grade corporates in the second half of 2023.
Strong nominal growth has arguably postponed the impact of tighter policy, but tighter credit conditions are expected to make themselves felt. Credit spreads on high yield bonds hover near historical averages.5 While this provides some buffer against an economic slowdown, we think they are vulnerable to widening. Valuations among financials and commercial mortgage-backed securities gapped wider in the recent banking panic. This cheapening opened up some opportunities, but it also serves as a reminder that sentiment towards credit markets can shift rapidly. To stay on the right track, it will be more important than ever to have a good understanding of a borrower’s fundamentals. As with all turns in the cycle, ‘average’ is not a helpful concept. Signs of stress will not emerge everywhere, but every industry will have its winners and losers.
Credit conditions: The ease with which finance can be accessed by companies and households. When credit conditions are tighter it is harder or more costly for people and businesses to access finance.
Credit ratings: A score given by a credit rating agency such as S&P Global Ratings, Moody’s and Fitch on the creditworthiness of a borrower. For example, S&P ranks high yields bonds from BB through B down to CCC in terms of declining quality and greater risk, i.e. CCC rated borrowers carry a greater risk of default.
Credit spread is the difference in yield between securities with similar maturity but different credit quality. Widening spreads generally indicate deteriorating creditworthiness of corporate borrowers, and narrowing indicate improving.
Cyclical: Companies that sell discretionary consumer items, such as cars, or industries highly sensitive to changes in the economy, such as miners. The prices of equities and bonds issued by cyclical companies tend to be strongly affected by ups and downs in the overall economy, when compared to non-cyclical companies.
Default: The failure of a debtor (such as a bond issuer) to pay interest or to return an original amount loaned when due. The default rate is typically expressed as a percentage rate reflecting the face value of bonds in an index defaulting over a 12-month period compared with the total face value of bonds in the index at the start of the period.
Federal Reserve or Fed is the central banking system of the United States.
Fixed income securities are subject to interest rate, inflation, credit and default risk. The bond market is volatile. As interest rates rise, bond prices usually fall, and vice versa. The return of principal is not guaranteed, and prices may decline if an issuer fails to make timely payments or its credit strength weakens.
Gross domestic product (GDP): The value of all finished goods and services produced by a country, within a specific time period (usually quarterly or annually). It is usually expressed as a percentage comparison to a previous time period, and is a broad measure of a country’s overall economic activity.
High yield bond: A bond that has a lower credit rating than an investment grade bond. Sometimes known as a sub- or below investment grade bond. These bonds carry a higher risk of the issuer defaulting on their payments, so they are typically issued with a higher coupon (regular interest payment) to help compensate for the additional risk.
ICE BofA Global Corporate Index tracks the performance of investment grade corporate debt publicly issues in the major domestic and eurobond markets.
ICE BofA Global High Yield Index tracks the performance of USD, CAD, GBP and EUR denominated below investment grade corporate debt publicly issued in the major domestic or eurobond markets.
Inflation: The annual rate of change in prices, typically expressed as a percentage rate. The Consumer Price Index (CPI) is a measure of the average change over time in the prices paid by urban consumers for a market basket of consumer goods and services.
Investment grade: A bond typically issued by governments or companies perceived to have a relatively low risk of defaulting on their payments. The higher quality of these bonds is reflected in their higher credit ratings.
Leverage: This is a measure of the level of debt in a company. Gross leverage is debt as a ratio of earnings before interest, tax, depreciation and amortisation.
Monetary policy: The policies of a central bank, aimed at influencing the level of inflation and growth in an economy. It includes controlling interest rates and the supply of money. Easing refers to a central bank increasing the supply of money and lowering borrowing costs. Tightening refers to central bank activity aimed at curbing inflation and slowing down growth in the economy by raising interest rates and reducing the supply of money.
Purchasing Managers’ Index (PMI) is an index of the prevailing direction of economic trends in the manufacturing and service sectors, based on a survey of private sector companies.
Quantitative tightening: contractionary monetary policy in which central banks decrease the supply of money in the economy by shrinking their balance sheets – this can be achieved by passively allowing bonds to mature and deleting them from its cash balances or actively selling bonds to drain money from the wider system.
Recession: A significant decline in economic activity lasting longer than a few months. A soft landing is a slowdown in economic growth that avoids a recession.
Treasury General Account: This is the US government’s operating account that is maintained by designated depositaries, primarily Federal Reserve Banks to handle daily public money transactions.
Yield: The level of income on a security, typically expressed as a percentage rate. For a bond, at its most simple, this is calculated as the coupon payment divided by the current bond price.
Yield curve: A graph that plots the yields of similar quality bonds against their maturities. In a normal/upward sloping yield curve, longer maturity bond yields are higher than short-term bond yields. A yield curve can signal market expectations about a country’s economic direction.
Volatility: The rate and extent at which the price of a portfolio, security or index moves up and down. If the price swings up and down with large movements, it has high volatility. If the price moves more slowly and to a lesser extent, it has lower volatility. The higher the volatility means the higher the risk of the investment.
1 EPFR Global, year to date to 17 May 2023.
2 Bloomberg, Generic 1 year US Government Bond, Generic 1-year German Government Bond, ICE BofA Global Corporate Index, ICE BofA Global High Yield Index. Yields as at 31 May 2023. Yields may vary over time and are not guaranteed.
3 Bianco Research, 3 February 2023.
4 Bloomberg, Bureau of Economic Analysis, US Nominal GDP, annual calendar year-on-year percentage change going back to 1983. Data correct at 31 May 2023.
5 Bloomberg, ICE BofA Global High Yield Index, option adjusted spread over government bonds, monthly data points, 20 years to 31 May 2023.
These are the views of the author at the time of publication and may differ from the views of other individuals/teams at Janus Henderson Investors. References made to individual securities do not constitute a recommendation to buy, sell or hold any security, investment strategy or market sector, and should not be assumed to be profitable. Janus Henderson Investors, its affiliated advisor, or its employees, may have a position in the securities mentioned.
Past performance does not predict future returns. The value of an investment and the income from it can fall as well as rise and you may not get back the amount originally invested.
The information in this article does not qualify as an investment recommendation.
There is no guarantee that past trends will continue, or forecasts will be realised.
Marketing Communication.