
Key takeaways:
- Yields have climbed sharply in recent weeks, but the move is driven more by a rise in real yields rather than a shift in inflation expectations.
- Behind the move in real yields appears to be a reassessment of bond supply contributing to a higher term premium.
- The reset in yields has created some compelling opportunities in fixed income and with real yields at historically restrictive levels that are likely to slow the economy we believe risk/reward is skewing in favour of bonds and away from risk assets.
The yield on the US 10-year Treasury reached 4.8% in the first week of October, the highest level since 2007. The pain in bond markets has been contagious, as equities fell and credit spreads widened in response to spiralling interest rates. For fixed income investors, the prospect that longer-dated US Treasuries could be set to deliver a third year of negative returns – something that has never happened in history – became uncomfortably real.
What’s in a word?
‘Real’ is the operative word here. For much of the past two years, inflation has been the factor that has driven fixed income markets. But core inflation peaked in the US a year ago and in Europe earlier this year. Headline consumer price inflation has tumbled and core inflation is gradually heading down, moving closer to the US Federal Reserve’s (Fed) target, although the mixed data in the US CPI release covering September demonstrated that the path lower may be uneven. Inflation expectations are under control as Figure 1 indicates. What has jumped is real yields.
Figure 1: Real yields are driving yields higher
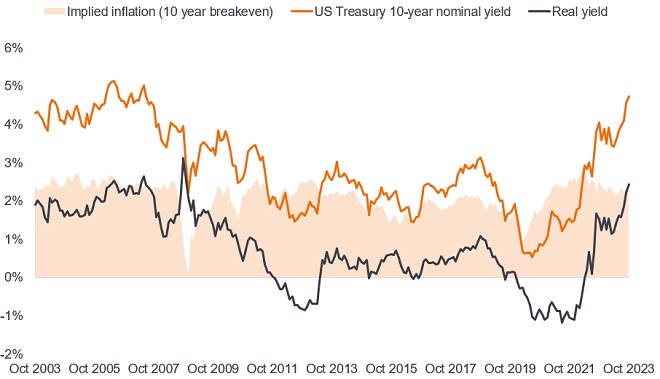
Source: Bloomberg, US Treasury 10-year nominal yield, US Treasury 10-year Inflation Protected Securities (TIPS) yield (real yield). The 10-year breakeven rate is a measure of expected inflation, implying what market participants expect inflation to be in the next 10 years, on average. It is derived from subtracting the yield on TIPS from nominal bond yields of the same maturity. 31 October 2003 to 6 October 2023. Yields may vary over time and are not guaranteed.
What are real yields?
We can think of real yields as the annualised return a fixed income investor can expect to earn after inflation. They are important as they often provide an insight into expectations of future economic growth and monetary policy. Real yields turned negative when investors were worried about the economy and monetary policy was extremely loose. They have since turned positive as the economy heals.
Longer-dated yields are driven by a combination of:
- The forward path of policy rates. This is why the market pays close attention to central bank guidance for a steer on where policy rates are likely to be headed. The market’s recent expectation for impending rate cuts has shifted to a “higher for longer” mantra. A similar re-evaluation of the equilibrium, or neutral, policy rate has also been moving higher.
- The term premium. This is essentially the extra compensation that a bondholder wants paying for the risk of lending for longer periods. This is a function of inflation, uncertainty and supply/demand dynamics. This term premium is not directly observable but models that estimate it such as one developed by New York Fed economists known as the ACM model suggests term premium has been rising recently.1
What has driven real yields higher?
There are a number of factors that seem to have driven real yields higher.
First, there has been a fresh focus on bond supply. It was not so long ago that proponents of Modern Monetary Theory were suggesting that governments could print money and spend with abandon, as inflation could easily be controlled. The recent inflationary episode appears to have consigned that theory to the trash. To be fair, fiscal policy was critical in helping the world to recover quickly from the pandemic. Questions are, however, rightly being raised as to why governments are still so heavily in the red. The US government is on course to borrow more in 2023 than it did in 2022. The latest projection is for the 2023 US deficit to reach 5.8% of GDP (7% if we exclude the reduction in outlays associated with student loan forgiveness reversal). For a full employment economy, this is reckless fiscal spending and is contributing to the rise in supply of Treasuries. But the US is far from alone, as Figure 2 demonstrates.
Figure 2: Government budget deficits are much larger than pre-Global Financial Crisis
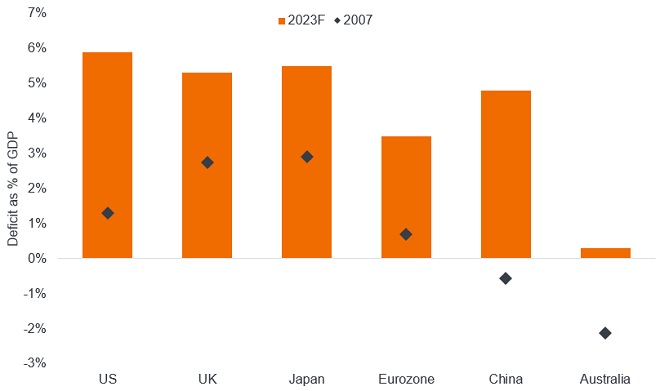
Source: Bloomberg, Government budget deficit as % of gross domestic product (GDP). 2023F figures represent forecasts representing composite of private contributors on Bloomberg. Latest available figures as at 30 September 2023. There is no guarantee that past trends will continue or forecasts will be realised.
Second, this high level of supply is occurring at a time when central banks have moved from price insensitive buyers of bonds (quantitative easing) to price insensitive sellers (quantitative tightening). The market is therefore looking for the next marginal buyer.
Third, confidence that rates will move lower – the expectation that produced a steeply inverted yield curve – has been evaporating. Some of this is a belief that further drops in inflation may be difficult to engineer, but it also reflects fear that there may not be a viable path to fiscal retrenchment across the G20.
Fourth, we are in an uncertain phase. Mixed economic data (for example, strong jobs data contrasting with weaker loan growth and rising credit card delinquencies) means the market is struggling to determine the overall direction of the economy and the likely monetary policy path. Even the excitement around artificial intelligence is muddying the picture as economic participants try to grasp what it might mean for productivity and jobs. The volatility in rates is the process of a market trying to find an equilibrium.
Today’s yields are an opportunity
Taken together, rising yields are unwelcome for existing holders of fixed rate bonds. Yet we should not lose sight of the fact that the reset in yields has restored the attractiveness of the asset class. Yields today are at levels that we find compelling. For example, fair value on the US 10-year Treasury, based on long-term historical relationships, is 4.25-4.5% (the sum of expected inflation, term premium and long-term policy rates). Today, we are at 4.7%.2 Volatility remains elevated, and further overshoots are certainly possible, but long-term investors are likely to take note of the value in today’s markets.
Bonds also compare favourably with equities. Today, an investor can achieve an average yield of 6.6% on BBB-rated US investment grade corporate bonds, compared with an earnings yield of 5.1% from US equities as reflected by the S&P 500.3
Bond investors are being given options. Shorter-dated bonds provide attractive yields, an extremely high probability of positive total returns, and limited volatility now that central banks are nearing their policy peaks. Meanwhile, the yield reset means longer-dated bonds could present patient investors with an opportunity to capture both income and capital gain if yields start to retreat.
Higher real yields also sow the seeds of their own collapse. Real yields at 2.5% are historically restrictive and with the lagged effects of monetary policy arguably still to be felt, are likely to contribute to a slowing economy and a shift in central bank policy away from further tightening. We have said it before, but it is worth reiterating. Investment grade bonds typically perform well (yields fall, prices rise) following the last hike in any specific rate cycle.
Figure 3: The last hike is typically good for investment grade bonds
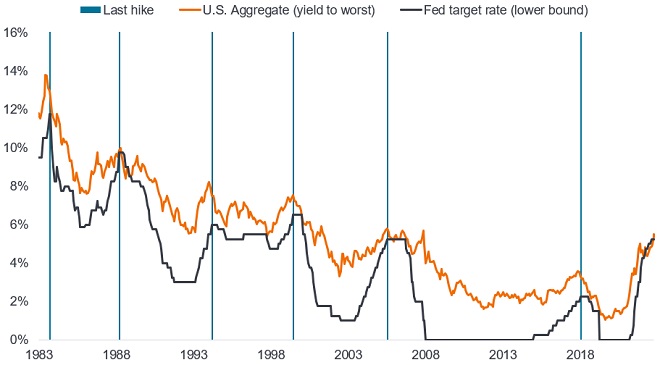
Source: Bloomberg, Bloomberg U.S. Aggregate Index Yield to Worst, US Federal Funds Target Rate (lower bound). 31 January 1983 to 5 October 2023. The yield to worst is the lowest yield a bond (index) can achieve provided the issuer(s) does not default; it takes into account special features such as call options (that give issuers the right to call back a bond at a specified date). The Bloomberg U.S. Aggregate Index is an index of US investment grade fixed rate bonds. Yields may vary over time and are not guaranteed.
We are living through a regime shift for policymakers. The Global Financial Crisis touched off an era of unrelenting easy money, depressing long-dated real yields. It also stoked inflation, defining the boundaries of prudent policy. As investors demand higher compensation for this adjustment, value has emerged, and bonds should begin to play their traditional role as an attractive source of portfolio diversification.
1Source: Current and former New York Fed economists Tobias Adrian, Richard K. Crump and Emanuel Moench developed a statistical model to describe the joint evolution of Treasury yields and term premia across time and maturities, known as the ACM model.
2Source: Bloomberg, Generic US 10-year Treasury yield, 6 October 2023.
3Source: ICE BofA US BBB Corporate Index (yield to worst), S&P500 earnings yield (reciprocal of price/earnings ratio), 6 October 2023.
ICE BofA BBB US Corporate Index tracks the US dollar denominated investment grade corporate debt publicly issued in the US domestic market and rated BBB1 through BBB3 inclusive.
S&P 500® Index reflects U.S. large-cap equity performance and represents broad U.S. equity market performance.
Annualised: Expressing a rate of interest, or return on an investment as an annual rate.
Credit ratings: A score given by a credit rating agency such as S&P Global Ratings, Moody’s and Fitch on the creditworthiness of a borrower.
Credit risk: The risk that a borrower will default on its contractual obligations, by failing to meet the required debt payments.
Default: The failure of a debtor (such as a bond issuer) to pay interest or to return an original amount loaned when due.
Diversification: A way of spreading risk by mixing different types of assets/asset classes in a portfolio. It is based on the assumption that the prices of the different assets will behave differently in a given scenario. Assets with low correlation should provide the most diversification.
Duration: The sensitivity of a bond or fixed income portfolio to changes in interest rates. The larger the figure the more sensitive it is to movements in interest rates. Going long duration refers to extending a portfolio’s average duration.
Fiscal policy: Connected with government taxes, debts and spending. Government policy relating to setting tax rates and spending levels. It is separate from monetary policy, which is typically set by a central bank. Fiscal austerity refers to raising taxes and/or cutting spending in an attempt to reduce government debt. Fiscal expansion (or ‘stimulus’) refers to an increase in government spending and/or a reduction in taxes.
Global Financial Crisis: The 2007-9 financial crisis refers to the period of extreme stress in the global financial markets and banking system between 2007 and early 2009. It precipitated a severe recession and the subsequent era of loose monetary policy.
Gross domestic product (GDP): The value of all finished goods and services produced by a country within a specific time period (usually quarterly or annually). It can be used to measure the size and rate of growth in an economy.
G20:The Group of 20 is made up of 19 sovereign nations plus the African Union and the European Union, representing around 85% of global gross domestic product.
Inflation: The annual rate of change in prices, typically expressed as a percentage rate. The Consumer Price Index (CPI) is a measure of the average change over time in the prices paid by urban consumers for a market basket of consumer goods and services.
Investment grade: A bond typically issued by governments or companies perceived to have a relatively low risk of defaulting on their payments. The higher quality of these bonds is reflected in their higher credit ratings.
Lead indicator: A piece or set of economic data that can help provide an early signal of where we are in an economic cycle.
Monetary policy: The policies of a central bank, aimed at influencing the level of inflation and growth in an economy. It includes controlling interest rates and the supply of money. Easing refers to a central bank increasing the supply of money and lowering borrowing costs. Tightening refers to central bank activity aimed at curbing inflation and slowing down growth in the economy by raising interest rates and reducing the supply of money. Restrictive policy is where policy is being tightened.
Neutral rate: The interest rate at which the economy is neither stimulating nor restricting economic growth
Recession: A significant decline in economic activity lasting longer than a few months. A soft landing is a slowdown in economic growth that avoids a recession. A hard landing is a deep recession.
Treasury: a debt security issued by the US government. A Treasury Bill is for 12 months or less, while a Treasury Bond is for longer.
Volatility: The rate and extent at which the price of a portfolio, security or index, moves up and down.
Yield: The level of income on a security, typically expressed as a percentage rate. The 10-year Treasury yield is the interest rate on US Treasury bonds that will mature 10 years from the date of purchase.
These are the views of the author at the time of publication and may differ from the views of other individuals/teams at Janus Henderson Investors. References made to individual securities do not constitute a recommendation to buy, sell or hold any security, investment strategy or market sector, and should not be assumed to be profitable. Janus Henderson Investors, its affiliated advisor, or its employees, may have a position in the securities mentioned.
Past performance does not predict future returns. The value of an investment and the income from it can fall as well as rise and you may not get back the amount originally invested.
The information in this article does not qualify as an investment recommendation.
There is no guarantee that past trends will continue, or forecasts will be realised.
Marketing Communication.