Please ensure Javascript is enabled for purposes of website accessibility Global Sustainable Equity Fund - Janus Henderson Investors
For Institutional Investors in the US

JEUIX Global Sustainable Equity Fund

By focusing on companies that contribute to the development of a more sustainable global economy, our low-carbon investment approach aims to deliver compounding growth and attractive investment returns.

NAV
$16.15
As of 11/07/2024

1-Day Change
$0.08 (0.50%)
As of 11/07/2024

YTD Return
16.94%
As of 11/07/2024

Overview

DEFINING CHARACTERISTICS OF OUR STRATEGY

  • 30 year anniversary sustainable equityEstablished strategy built on a 30-year history of sustainable investing and innovative thought leadership
  • High-conviction portfolio of companies selected for their potential to deliver compounding growth and their ability to contribute to the development of a more sustainable global economy
  • Committed to provide clients with high standards of engagement, transparency and measurement

WHAT WE BELIEVE

We believe there is a strong link between sustainable development, innovation and long-term compounding growth.

Our investment framework leads us to invest in companies that we believe contribute to the development of a more sustainable global economy, through their revenue alignment with ten environmental and social themes. At the same time, it helps us stay on the right side of disruption by seeking to avoid companies we consider to be involved in activities that are harmful to the environment and society.

We believe this approach will provide clients with a persistent return source, deliver future compound growth and help mitigate downside risk.

The guiding principle of our investment philosophy evolves around: Is the world a better place because of this company?”

Hamish Chamberlayne, CFA
Head of Global Sustainable Equity |Portfolio Manager

Investment Considerations
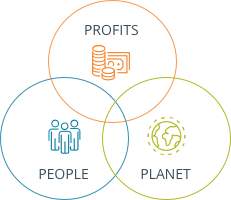
Global Sustainable Equity Fund Venn Diagram
Companies are analyzed and selected using a triple bottom line framework, considering how companies generate profits and their outcomes on people and the planet.

Portfolio Management

Hamish Chamberlayne, CFA

Head of Global Sustainable Equities | Portfolio Manager

Industry since 2003. Joined Firm in 2007.

Aaron Scully, CFA

Portfolio Manager

Industry since 1998. Joined Firm in 2001.

Performance

RETURNS (%) (As of 09/30/2024)
Global Sustainable Equity Fund – I Shares MSCI World IndexSM
 
3M YTD 1YR 3YR Since Inception
(06/25/2020)
Global Sustainable Equity Fund – I Shares 3.57 17.52 33.42 5.27 12.63
MSCI World IndexSM 6.36 18.86 32.43 9.08 14.95
RETURNS (%) (As of 09/30/2024)
Global Sustainable Equity Fund – I Shares MSCI World IndexSM
 
3M YTD 1YR 3YR Since Inception
(06/25/2020)
Global Sustainable Equity Fund – I Shares 3.57 17.52 33.42 5.27 12.63
MSCI World IndexSM 6.36 18.86 32.43 9.08 14.95
Calendar Year Returns (%)
Global Sustainable Equity Fund – I Shares MSCI World IndexSM
2023 2022 2021
Global Sustainable Equity Fund – I Shares 22.57 -24.23 16.21
MSCI World IndexSM 23.79 -18.14 21.82

Morningstar Percentile

 (As of 09/30/2024)
1 YR 3 YR 5 YR 10 YR SINCE INCEPTION
Percentile Ranking 41 38 - - 24
Global Large-Stock Growth | Rank/Count 154/344 119/329 -/- -/- 83/312
 (As of 10/31/2024)
1 YR 3 YR 5 YR 10 YR SINCE INCEPTION
Percentile Ranking 56 40 - - 27
Global Large-Stock Growth | Rank / Count 216/346 127/330 -/- -/- 88/312
Annual Fees & Expenses (As of the most recent prospectus)
CLASS I SHARES
Management Fees 0.75%
Other Expenses 1.23%
Total Gross Expenses 1.98%
Waivers -0.97%
Total Net Expenses 1.01%

Portfolio

Index represents the MSCI World Index

Top Holdings (As of 09/30/2024)
% of Fund
Microsoft Corp 5.72
NVIDIA Corp 4.27
Schneider Electric SE 3.40
Westinghouse Air Brake Technologies Corp 3.30
Progressive Corp 3.16
T-Mobile US Inc 2.78
Intact Financial Corp 2.57
Xylem Inc/NY 2.53
Uber Technologies Inc 2.48
Humana Inc 2.45
TOTAL 32.66
View full holdings
Portfolio Characteristics (As of 09/30/2024)
  FUND INDEX
Number of Holdings
Equity Issues
54 1410
Market Capitalization
Weighted Average
$381.36B $672.87B
Portfolio Turnover Rate
(1-year trailing)
24.57% -
Price/Earnings Ratio
(1-year forward)
22.33 18.90
Price/Book Ratio
4.39 3.35
Earnings Growth Rate
(1-year forward)
19.23% 15.54%
Sector Allocation % of Fund % of Index % of Fund % of Index As of 09/30/2024
Regional Allocation % of Fund % of Index % of Fund % of Index As of September 30, 2024
Developed vs Emerging Markets % of Fund % of Index % of Fund % of Index As of September 30, 2024
Market Capitalization Range of Equity Holdings % of Fund % of Index % of Fund % of Index As of 09/30/2024

Documents