For Institutional Investors in the US

JSMGX Triton Fund

Our in-depth fundamental research strategy seeks differentiated small-cap companies with the potential to quickly grow into mid-size companies.

NAV
$26.26
As of 06/02/2023

1-Day Change
$0.59 (2.30%)
As of 06/02/2023

YTD Return
6.49%
As of 06/02/2023

Morningstar Rating

As of 04/30/2023

Overview

ABOUT THIS FUND

A moderately positioned, small-mid-cap growth fund seeking to provide consistent relative returns with lower volatility than the index. The Fund invests in small-cap companies with differentiated business models and sustainable competitive advantages that are positioned to grow market share regardless of economic conditions.

WHY INVEST IN THIS FUND

Unique Business Models
Seeks small-cap companies that stand out from competitors – through differentiated business models, innovative approaches or unique products or services – that are using their competitive advantages to grow over a multi-year time frame.

Deep, Specialized Team
In-depth fundamental research supported by a team of analysts, a team of small mid-cap specialists and a portfolio management team with experience looking for small-cap companies early in their life cycle that have the potential to grow into mid-size companies.

Moderate Approach to Growth
The Fund offers the potential for capital appreciation through exposure to small companies having the potential to quickly grow into mid-size companies with a focus on resilient business models positioned to weather a variety of market environments.

Strong Risk-Adjusted Performance vs. Peers

10-Year Rankings in Morningstar Small Growth Category (533 funds) as of 3/31/23 Triton Fund Proof Point Chart Q1 2023

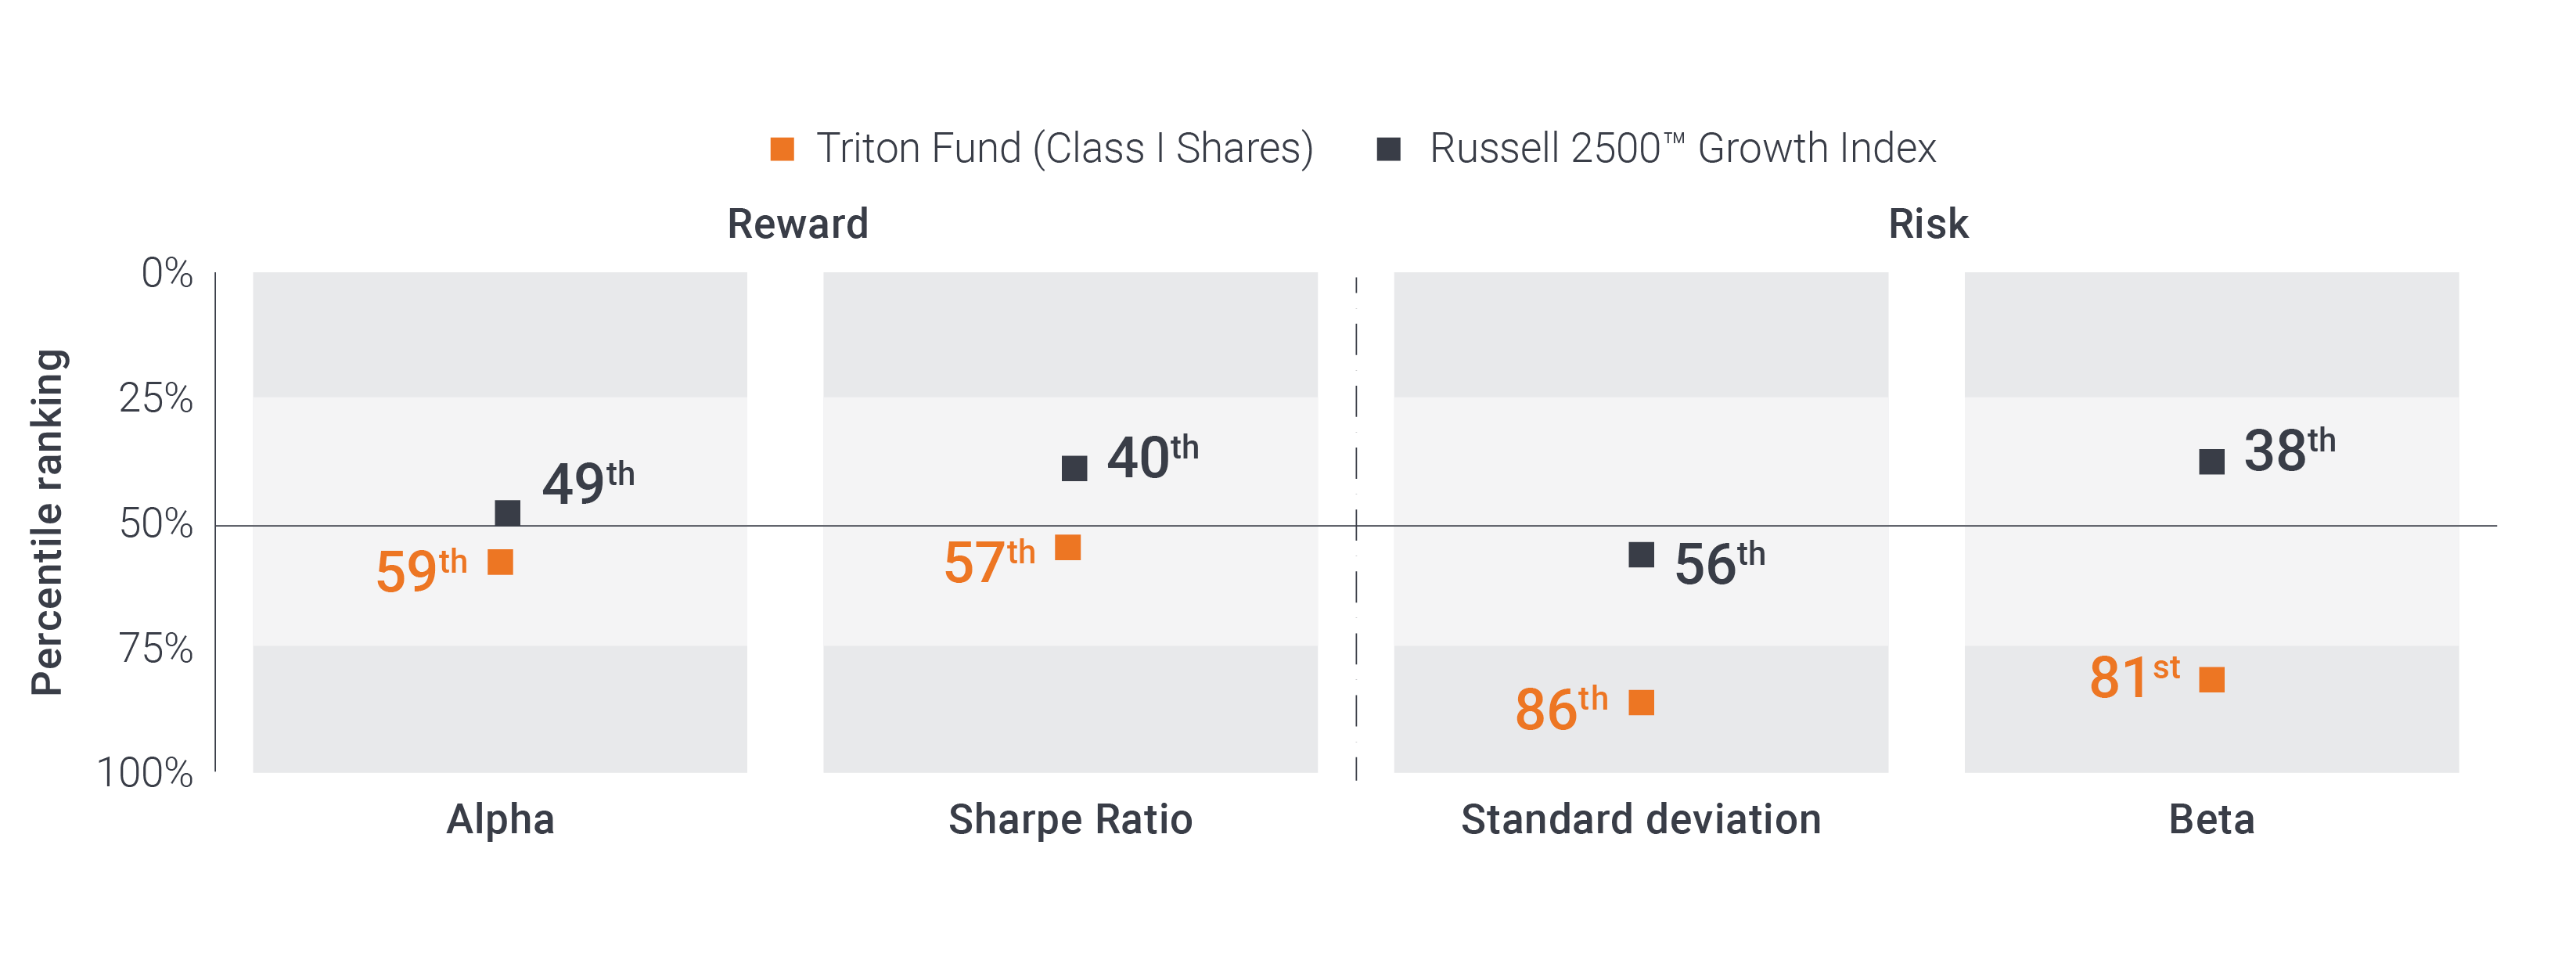
Triton Fund 3-Year rankings in Morningstar Small Growth Category as of 3/31/23: Alpha – 46th percentile ranked 228 of 597 funds, Sharpe Ratio – 43rd percentile ranked 219 of 597 funds, Standard Deviation – 85th percentile ranked 508 of 597 funds and Beta – 76th percentile ranked 468 of 597 funds.

PORTFOLIO MANAGEMENT

Jonathan Coleman, CFA

Portfolio Manager

Industry since 1994. Joined Firm in 1994.

Scott Stutzman, CFA

Portfolio Manager | Research Analyst

Industry since 2001. Joined Firm in 2007.

Performance

RETURNS (%) (As of 03/31/2023)
Triton Fund - Class I Shares Russell 2500™ Growth Index Russell 2000® Growth Index
 
3M YTD 1YR 3YR 5YR 10YR Since Inception
(02/25/2005)
Triton Fund - Class I Shares 6.41 6.41 -10.24 15.73 5.42 10.23 11.16
Russell 2500™ Growth Index 6.54 6.54 -10.35 14.75 6.82 10.05 9.06
Russell 2000® Growth Index 6.07 6.07 -10.60 13.36 4.26 8.49 7.87
RETURNS (%) (As of 05/31/2023)
Triton Fund - Class I Shares Russell 2500™ Growth Index Russell 2000® Growth Index
 
3M YTD 1YR 3YR 5YR 10YR Since Inception
(02/25/2005)
Triton Fund - Class I Shares -4.26 3.00 -2.71 5.70 3.97 9.50 10.85
Russell 2500™ Growth Index -2.94 5.08 2.30 5.16 5.56 9.41 8.89
Russell 2000® Growth Index -3.58 4.86 2.68 4.62 2.74 7.90 7.73
Calendar Year Returns (%)
Triton Fund - Class I Shares Russell 2500™ Growth Index
2022 2021 2020 2019 2018 2017 2016 2015 2014 2013
Triton Fund - Class I Shares -23.63 7.10 28.54 28.45 -5.13 27.07 10.59 1.35 9.58 36.52
Russell 2500™ Growth Index -26.21 5.04 40.47 32.65 -7.47 24.46 9.73 -0.19 7.05 40.65

MORNINGSTAR PERCENTILE

(As Of 03/31/2023)
1 YR 3 YR 5 YR 10 YR SINCE INCEPTION
Percentile Ranking 38 51 78 31 2
Small Growth | Rank/Count 219/612 268/597 429/576 175/533 9/439
(As Of 05/31/2023)
1 YR 3 YR 5 YR 10 YR SINCE INCEPTION
Percentile Ranking 62 53 67 31 1
Small Growth | Rank / Count 384/596 263/581 368/561 166/521 6/425

RETURNS-BASED STATISTICS (As of 04/30/2023 Class I Shares)

RISK / REWARD
VS. Russell 2500™ Growth Index
3YR 5YR
Information Ratio 0.17 -0.26
Alpha 1.76 -0.88
Tracking Error 5.69 5.12
Beta 0.88 0.94
R-squared (%) 93.44 95.24
UP/DOWN MARKET CAPTURE (%)
VS. Russell 2500™ Growth Index
3YR 5YR
Up Capture Ratio 90.33 88.68
Down Capture Ratio 86.99 93.36
STANDARD DEVIATION 3YR 5YR
Triton Fund 19.76 22.55
Russell 2500™ Growth Index 21.69 23.43
SHARPE RATIO 3YR 5YR
Triton Fund 0.44 0.17
Russell 2500™ Growth Index 0.35 0.22
ANNUAL FEES & EXPENSES (As of Fiscal Year End, 09/30/2022)
CLASS I SHARES
Management Fees 0.64%
Other Expenses 0.12%
Total Gross Expenses 0.76%
Waivers 0.00%
Total Net Expenses 0.76%

Portfolio

Index represents the Russell 2500™ Growth Index.

Top Holdings (As of 04/30/2023)
% of Fund
Rentokil Initial PLC (ADR) 2.65
Crown Holdings Inc 2.25
SS&C Technologies Holdings Inc 2.11
OSI Systems Inc 1.87
Blackbaud Inc 1.85
Sensient Technologies Corp 1.81
Catalent Inc 1.68
ON Semiconductor Corp 1.67
Alight Inc 1.65
Hostess Brands Inc 1.52
Total 19.06
View full holdings
Portfolio Characteristics (As of 04/30/2023)
  FUND INDEX
Number of Holdings
Equity Issues
127 1318
Market Capitalization
Weighted Average
$7.22B $5.75B
Portfolio Turnover Rate
(1-year trailing)
14.62% -
Price/Earnings Ratio
(1-year forward)
16.82 16.60
Price/Book Ratio
2.96 3.99
Earnings Growth Rate
(1-year forward)
12.30% 18.53%
Sector Allocation % OF FUND % of Index % OF FUND % of Index (As of 04/30/2023)
Regional Allocation % OF FUND % of Index % OF FUND % of Index (As of April 30, 2023)
Market Capitalization Range of Equity Holdings % OF FUND % of Index % OF FUND % of Index (As of 04/30/2023)
Developed vs Emerging Markets % OF FUND % of Index % OF FUND % of Index (As of April 30, 2023)

Documents