Please ensure Javascript is enabled for purposes of website accessibility Henderson International Income Trust plc - Janus Henderson Investors - UK financial professionals
For financial professionals in the UK

HINT Henderson International Income Trust plc

HINT aims to offer investors a genuinely diversified source of dependable, growing income, drawn from investments beyond the UK.

ISIN
GB00B3PHCS86

Share price
171.50p
As of 08/05/2025

Estimated NAV
176.04p
As of 08/05/2025

Discount / Premium
-2.58%
As of 08/05/2025

Yield
4.37%
As of 07/05/2025

Overview

INVESTMENT OBJECTIVE

The Company seeks to provide shareholders with a growing total annual dividend, as well as capital appreciation.

The value of an investment and the income from it can fall as well as rise as a result of market and currency fluctuations and you may not get back the amount originally invested. Potential investors must read the latest annual report and where relevant, the key information document before investing. This website is for promotional purposes and does not qualify as an investment recommendation.

ABOUT THIS COMPANY

In 2011, Henderson International Income Trust was launched to provide an investment solution for investors seeking attractive income and capital growth opportunities.

The Company invests in some of the best global income ideas, well diversified by sector and region outside the UK, generated by the Janus Henderson Global Equity Income team. Global diversification helps mitigate political and economic risks and provides exposure to additional opportunities. The portfolio is split into three regions, North America, Europe and Asia Pacific, with none representing more than 50% of assets and no individual stock over 5% of the portfolio at the time of investment.

As well as the ability to borrow up to 25% of net assets to enhance returns, the mandate includes the ability to own up to 25% in fixed interest assets to enhance income generation and diversification.

DIVERSIFIER FOR UK INCOME-DRIVEN INVESTORS

The ex-UK aspect of the portfolio allows investors to be confident of true stock specific diversification as many UK investors’ income portfolios are often overweight the UK FTSE dividend payers. The dividends paid by UK companies (represented below by the FTSE 100) are highly reliant on a small number of companies. The same is not the case for a global index or for the HINT portfolio.


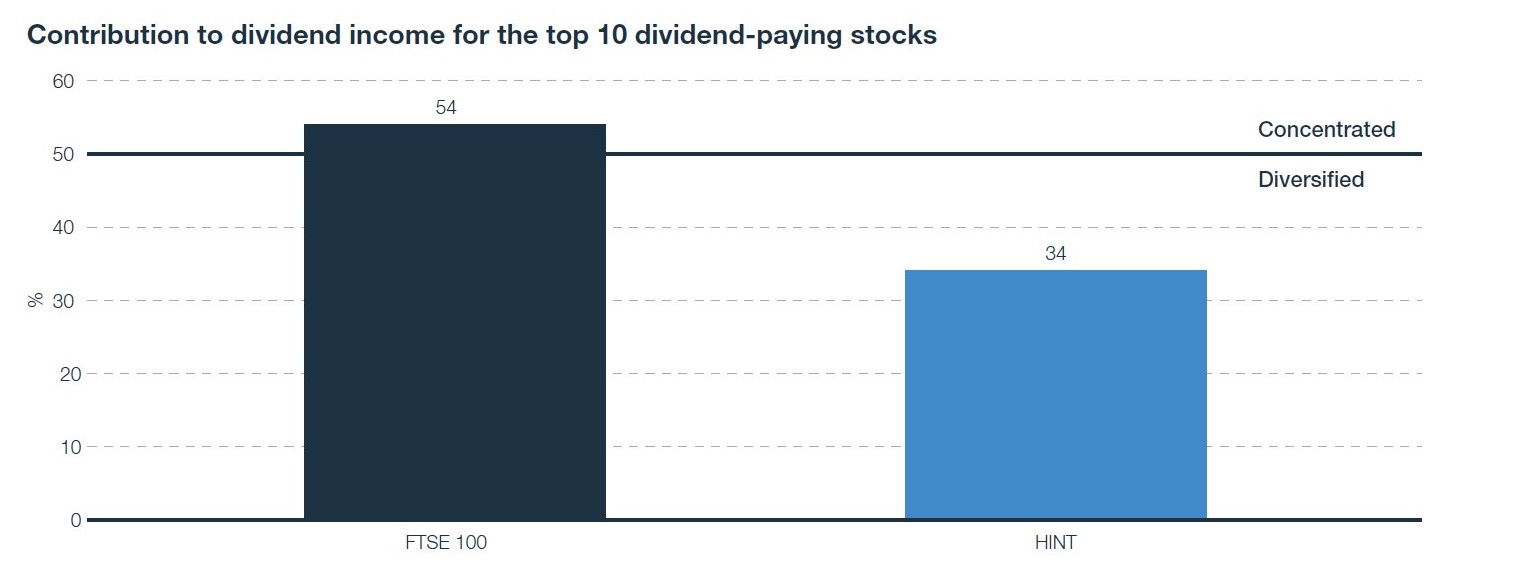
Source: Link Group UK Dividend Monitor for the year to December 2021. HINT dividend contribution for the one year period to 31 August 2022.

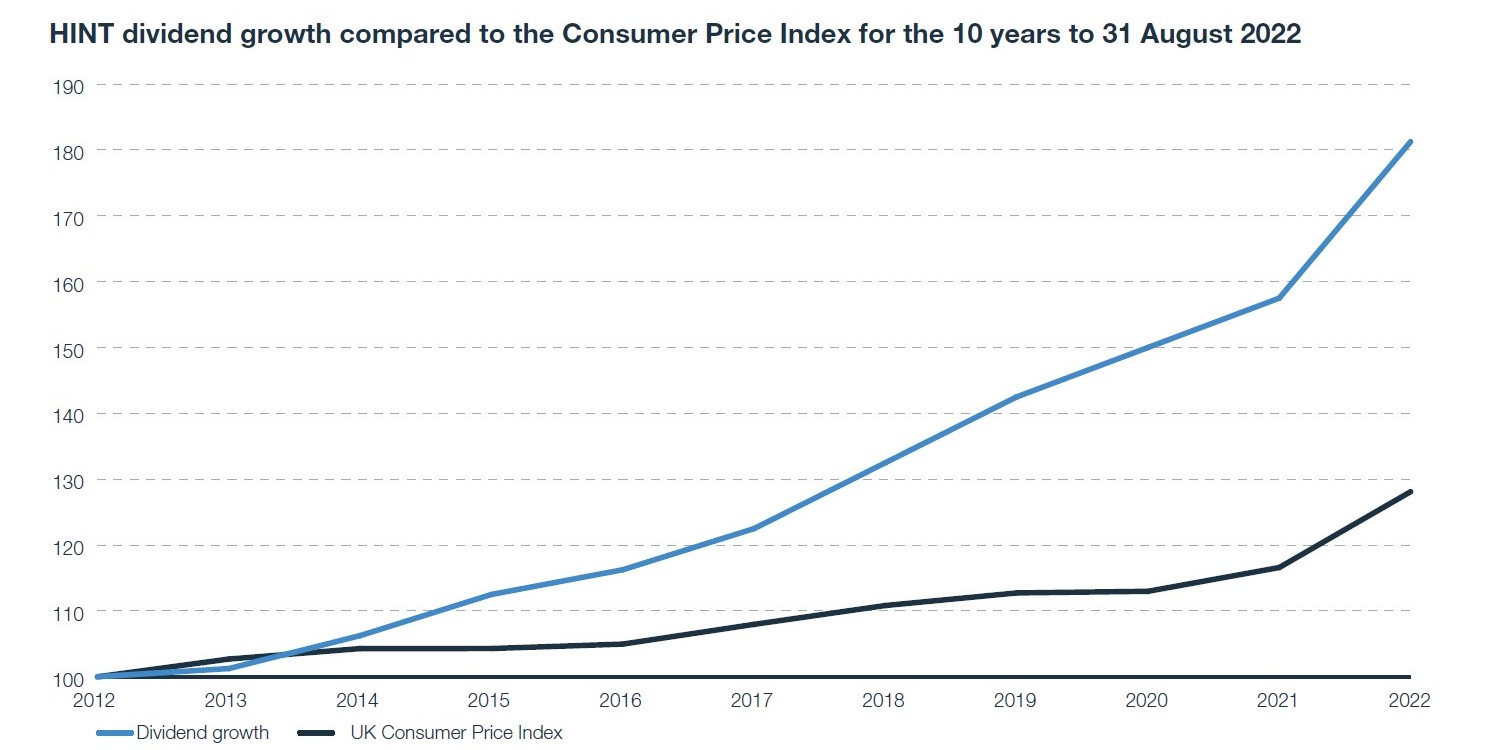
Source: Refinitiv Datastream (August 2022), Morningstar Direct (August 2022), Figures rebased to 100 as at August 2012.

HINT has an established track record since inception of a growing total annual dividend as well as capital appreciation:

  • The dividend has grown from 1p per quarter to 1.85p per quarter since launch (as at 31 August 2022). This is at a greater rate than inflation. The long-term sustainability of dividends is enhanced by the Company’s ability to smooth distributions through the cycle using its reserves.
  • The capital value of the Company has increased from 100p at launch to 181.5p as at 31 August 2022
Past performance does not predict future returns. 
 

LATEST INSIGHTS

Knowledge shared

At Janus Henderson, we believe in the sharing of expert insight for better investment and business decisions. We call this ethos Knowledge Shared.

ANNOUNCEMENTS

View the latest announcements for this Company:

London Stock Exchange

FREQUENTLY ASKED QUESTIONS

Source: Morningstar. Ratings updated quarterly.

Portfolio Management

Ben Lofthouse, CFA

Head of Global Equity Income | Portfolio Manager

Industry since 1998. Joined Firm in 2004.

Faizan Baig, CFA

Portfolio Manager

Industry since 2007. Joined Firm in 2015.

Performance

Marketing Communication. Past performance does not predict future returns. The value of an investment and the income from it may go down as well as up and you may lose the amount originally invested. Potential investors must read the latest annual report and where relevant, the key information document before investing.
Discrete Performance (%)
As of 31/03/2025
Share price Net asset value per share MSCI ACWI ex UK HDY TR
 
As of 31/03/2025 2024/2025 2023/2024 2022/2023 2021/2022 2020/2021
Share price 7.88 -0.54 3.52 16.15 29.64
Net asset value per share -0.53 6.38 4.97 11.79 34.97
MSCI ACWI ex UK HDY TR 7.02 12.75 1.97 12.07 26.03
Cumulative & Annualised Performance (%)
As of 31/03/2025
Share price Net asset value per share MSCI ACWI ex UK HDY TR
 
  Cumulative Annualised
  1MO 3MO YTD 1YR 3YR 5YR 10YR
Share price -6.28 6.11 6.11 7.88 11.07 67.25 91.05
Net asset value per share -4.02 -0.02 -0.02 -0.53 11.07 67.58 102.99
MSCI ACWI ex UK HDY TR -2.37 2.87 2.87 7.02 23.04 73.80 149.04

Recommended holding period 5 Years

Example Investment: GBP 10,000

Scenarios If you exit after 1 year If you exit after 5 years
MinimumThere is no minimum guaranteed return. You could lose some or all of your investment
StressWhat you might get back after costs1,130 GBP940 GBP
Average return each year-88.67%-37.71%
UnfavourableWhat you might get back after costs8,370 GBP10,140 GBP
Average return each year-16.26%0.28%
ModerateWhat you might get back after costs10,650 GBP13,300 GBP
Average return each year6.49%5.87%
FavourableWhat you might get back after costs13,730 GBP16,770 GBP
Average return each year37.35%10.89%

Portfolio

Top Holdings (As of 31/03/2025)
% of Fund
Microsoft 4.51
Sony Group 3.16
Coca-Cola 3.03
Home Depot 2.71
Deutsche Telekom 2.66
Alphabet 2.63
CME Group 2.59
Novartis 2.57
Procter & Gamble 2.51
Taiwan Semiconductor Manufacturing 2.48
TOTAL 28.86
View full holdings
Sector Allocation % of Fund % of Fund As of 31/03/2025
Country/Geographic Exposures % of Fund % of Fund As of 31/03/2025

Documents

  • ​The value of the Funds and the income from them is not guaranteed and may fall as well as rise. You may get back less than you originally invested.
  • ​Past performance does not predict future returns.
  • Third party data is believed to be reliable, but its completeness and accuracy is not guaranteed.
  • This Company is suitable to be used as one component of several within a diversified investment portfolio. Investors should consider carefully the proportion of their portfolio invested in this Company.
  • Active management techniques that have worked well in normal market conditions could prove ineffective or negative for performance at other times.
  • The Company could lose money if a counterparty with which it trades becomes unwilling or unable to meet its obligations to the Company.
  • Shares can lose value rapidly, and typically involve higher risks than bonds or money market instruments. The value of your investment may fall as a result.
  • Higher yielding bonds are issued by companies that may have greater difficulty in repaying their financial obligations. High yield bonds are not traded as frequently as government bonds and therefore may be more difficult to trade in distressed markets.
  • The return on your investment is directly related to the prevailing market price of the Company's shares, which will trade at a varying discount (or premium) relative to the value of the underlying assets of the Company. As a result, losses (or gains) may be higher or lower than those of the Company's assets.
  • Global portfolios may include some exposure to Emerging Markets, which tend to be less stable than more established markets. These markets can be affected by local political and economic conditions as well as variances in the reliability of trading systems, buying and selling practices and financial reporting standards.
  • The portfolio allows the manager to use options for efficient portfolio management. Options can be volatile and may result in a capital loss.
  • Where the Company invests in assets that are denominated in currencies other than the base currency, the currency exchange rate movements may cause the value of investments to fall as well as rise.
  • If the Company seeks to minimise risks (such as exchange rate movements), the measures designed to do so may be ineffective, unavailable or negative for performance.
  • The Company may use gearing (borrowing to invest) as part of its investment strategy. If the Company utilises its ability to gear, the profits and losses incurred by the Company can be greater than those of a Company that does not use gearing.
  • All or part of the Company's management fee is taken from its capital. While this allows more income to be paid, it may also restrict capital growth or even result in capital erosion over time.
  • The Company confirms that it currently conducts its affairs so that its ordinary shares of 1p each can be recommended by IFAs to ordinary retail investors in accordance with the Financial Conduct Authority’s (FCA) rules in relation to non-mainstream investment products and intends to continue to do so for the foreseeable future.
  • The shares are excluded from the FCA’s restrictions which apply to non-mainstream investment products because they are shares in an investment trust.
  • For detailed product information including the risks associated with investing please read the relevant Prospectus or Annual Report. Please refer to the AIFMD Disclosure document and Annual Report of the AIF before making any final investment decisions.
  • Some documents are available in alternative formats. Click here for information on how to request them.
  • The Legal Entity Identifier for this product is 2138006N35XWGK2YUK38.