Multi-asset view: charting geopolitical risks
Portfolio Manager Oliver Blackbourn considers the potential ramifications of the conflict between Israel and Palestine at a geopolitical level, giving some insight into how markets have responded thus far.


8 minute read
Key takeaways:
- While escalation and broadening of the conflict in the Middle East remains a possibility, markets have so far given few clear signals that any asset price moves are being driven by escalating geopolitical risk.
- The dynamics could change should the conflict spread across the Middle East, given the importance of the region to global fossil fuel supply – the potential involvement of Iran is a key factor.
- Equity and lower quality fixed income assets continue to price in a limited risk of recession, leaving markets more vulnerable to the impact of negative developments. This highlights the importance of diversification at an asset class level, and a focus on higher quality when choosing exposure.
The distressing events in Israel and the Gaza Strip continue to fuel geopolitical concerns among investors. The conflict further broadens the set of risks that investors must currently confront. While the core theme of ‘higher-for-longer’ interest rates still dominates how assets are being priced, market participants must also keep an eye on a widening range of other concerns, such as financial sector stress, Chinese policy intervention and US political gridlock.
The direct impact on the global economy of the conflict between Israel and Hamas is likely to be somewhat limited. However, the dynamics could change should it spread across the Middle East, given the importance of the region to global fossil fuel supply. From this perspective, the potential involvement of Iran is seen as the key factor. The country forms one side of the Persian Gulf, a body of water synonymous with global oil exports. Key shipping lanes from major oil producing countries such as Iraq, the United Arab Emirates, Kuwait, Qatar and Bahrain, run through the Strait of Hormuz, a geographical choke point over which Iran can exert its influence.
These countries were responsible for over 20% of global crude oil exports in 2022, according to the Organization of the Petroleum Exporting Countries (OPEC). In addition, Iran contributed a further 2%. As a result, direct Iranian involvement would likely lead to renewed concerns about the security of global energy supplies and a rise in oil prices. So far, the reaction in oil markets has been relatively subdued, with the West Texas Intermediate Crude oil price briefly touching $90 per barrel; but remaining well below the late September high of $95 and the early 2022 peaks above $120 (Exhibit 1).
Exhibit 1: The oil price reaction has thus far been relatively subdued
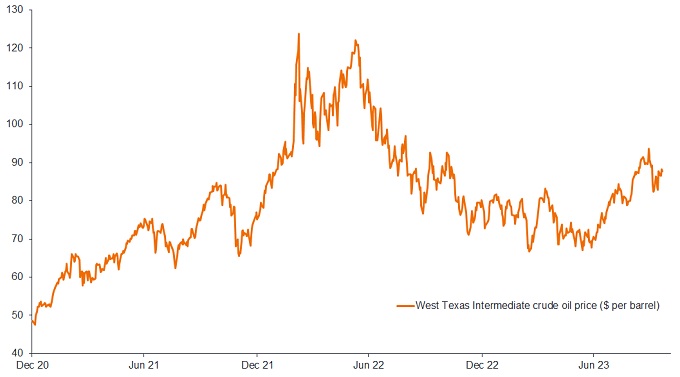
Source: Bloomberg, Janus Henderson Investors, at 19 October 2023.
A shock to global energy supply proved difficult for markets in 2022, and often leads to adverse growth outcomes. However, markets have so far remained focused on central banks, with few clear signals that any asset price moves are being driven by escalating geopolitical risk.
However, a spike higher in oil prices would likely prove another headache for central banks. In the US, growth has remained surprisingly strong and, while inflation has fallen significantly, markets are clearly indicating that the Federal Reserve (Fed) may have to keep interest rates higher for longer. A further inflation spike in energy costs that delays a return to the Fed’s 2% inflation target could, in the first instance, further aggravate this sense that interest rates may have to stay higher for an extended period of time to make sure that faster price increases do not become entrenched. The situation would be even more problematic for the European Central Bank and Bank of England as they look to be contending with greater concerns about the negative impact of higher interest rates on growth, while also seeing inflation slow more gradually.
Despite the heightened geopolitical risk backdrop, markets have remained more sensitive to the core theme that has driven market in 2023, namely the outlook for interest rates. This can be seen in the way that US Treasury yields (and European ones) have made new highs (for this cycle) in recent days. The US 10-year yield has been approaching 5% (Exhibit 2), with the 2-year equivalent rising towards 5.25%.
Exhibit 2: Global sovereign bond yields have hit new highs for this cycle
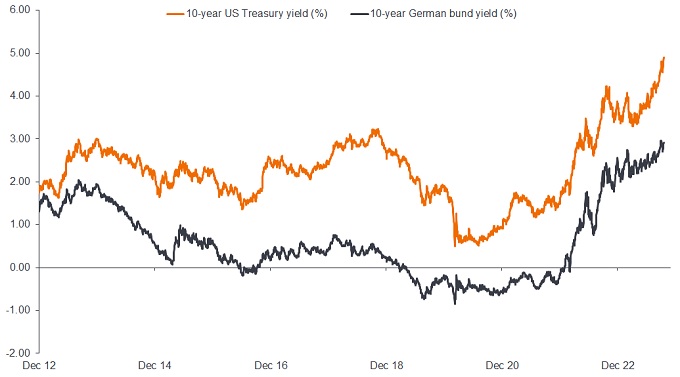
Source: Datastream, Janus Henderson Investors, as at 19 October 2023. Past performance does not predict future returns.
US Treasuries have historically been a source of shelter when perceived risk increases and thus yields have tended to fall when investor anxiety rises. The move higher in yields has led to a stronger US dollar and continued to weigh on risk assets, as has been the case since late July. Equity valuations have fallen and credit spreads have widened (Exhibit 3), as better returns in lower-risk assets make holding higher-risk assets less attractive.
Exhibit 3: Risk asset valuations have come under pressure
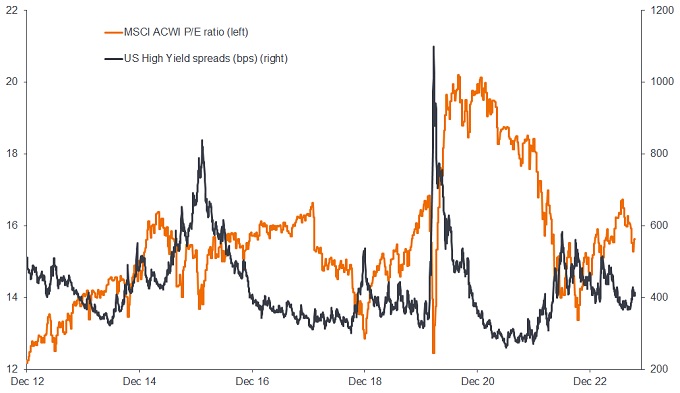
Source: Datastream, Janus Henderson Investors, as at 19 October 2023.
P/E ratio = price-to-earnings ratio. Global High Yield = Bloomberg Global High Yield Index.
Despite this, the VIX Index of US equity options market implied volatility – often referred to as the ‘Fear Index’ – has remained subdued. This suggests that investors are not running to hedge against further falls in stock markets. One area that has shown greater sign of investor disquiet, however, has been the price of gold, which rebounded from early October. A stronger US dollar and higher US Treasury yields are often a headwind for gold, so the recent jump suggests it is being used as a safe-haven asset at a time of increased uncertainty.
While escalation and broadening of the conflict in the Middle East remains a possibility, stronger growth, faster inflation and ‘higher-for-longer’ interest rates remain the key risks for markets for the time being. However, there are an increasing number of other factors that represent potential tail risks. Given heightened uncertainty about the durability of the global economic cycle, the ability to withstand shocks is likely reduced.
Many equity markets remain on peak earnings expectations, even if valuations are relatively cheap outside of the US. Similarly, lower-rated corporate bond spreads continue to price limited risk of recession, at a time when default rates have already risen from very low levels. This leaves markets more vulnerable to falls in response to negative developments, such as geopolitical risks. We continue to believe that greater diversification has become more important at a broad asset class level, and that a focus on quality when choosing exposure should likely be rewarded going forward.
—–
Glossary:
Asset classes: A group of comparable financial securities that exhibit similar characteristics, with ‘equities’ (company shares), ‘fixed income’ (bonds), ‘real estate’ (property), or ‘cash’ being common examples.
Basis point: One basis point (bp) equals 1/100 of a percentage point. 1 bp = 0.01%, 100 bps = 1%
Bloomberg Global High Yield Index: A broad-based measure of the global high-yield fixed income markets.
Credit spreads: The difference in yield between securities with similar maturity but different credit quality, often used to describe the difference in yield between corporate bonds and government bonds. Widening spreads generally indicate a deteriorating creditworthiness of corporate borrowers, while narrowing indicate improving.
Default rates: The failure of a debtor (such as a bond issuer) to pay interest or to return an original amount loaned when due.
Earnings expectations: The market’s expectations for the earnings of a business, which can be fundamental to how that stock is valued.
Economic cycle: The fluctuation of the economy between expansion (growth) and contraction (recession), commonly measured in terms of gross domestic product (GDP). It is influenced by many factors, including household, government and business spending, trade, technology and central bank policy.
Hedge: A trading strategy that involves taking an offsetting position to another investment that will lose value as the primary investment gains, and vice versa. These positions are used to reduce or manage various risk factors and limit the probability of overall loss in a portfolio. Various techniques may be used, including derivatives.
Inflation: The rate at which the prices of goods and services are rising in an economy. The Consumer Price Index (CPI) and Retail Price Index (RPI) are two common measures.
Recession: Contraction in the economy, commonly measured in terms of gross domestic product (GDP).
Risk assets: Financial securities that may be subject to significant price movements (ie. carrying a greater degree of risk). Examples include equities, commodities, property lower-quality bonds or some currencies.
Safe haven: Assets that are expected to retain their value or potentially even gain value, during periods of economic uncertainty or market turbulence, eg. gold, US government debt, the US dollar, cash, etc.
Tail risk: Tail risk events are those that have a small probability of occurring, but which could have a significant effect on performance were they to arise. They occur at both ends of a normal distribution curve, with ‘left-hand tail risk’ the term used to describe negative tail risk factors, and ‘right-hand tail risk’ describing unlikely events that would have a positive impact on performance.
US Treasuries: Debt obligations issued by the US government. With government bonds, the investor is a creditor of the government. Treasury Bills and US Government Bonds are guaranteed by the full faith and credit of the United States government. They are generally considered to be free of credit risk and typically carry lower yields than other securities.
VIX Index: The CBOE Volatility Index (VIX) is a real-time market index that is used as an indicator of the market’s expectations for volatility over the following 30 days.
Volatility: This measures risk using the dispersion of returns for a given investment (ie. the rate and extent at which the price of a portfolio, security or index, moves up and down). If the price swings up and down with large movements, it has high volatility (making it potentially higher risk). If the price moves more slowly and to a lesser extent, it has lower volatility (making it potentially lower risk).
Yield: The level of income on a security over a set period, typically expressed as a percentage rate. For equities, a common measure is the dividend yield, which divides recent dividend payments for each share by the share price. For a bond, this is calculated as the coupon payment divided by the current bond price.
10-year Treasury yield: The interest rate on US Treasury bonds that will mature 10 years from the date of purchase.
These are the views of the author at the time of publication and may differ from the views of other individuals/teams at Janus Henderson Investors. References made to individual securities do not constitute a recommendation to buy, sell or hold any security, investment strategy or market sector, and should not be assumed to be profitable. Janus Henderson Investors, its affiliated advisor, or its employees, may have a position in the securities mentioned.
Past performance does not predict future returns. The value of an investment and the income from it can fall as well as rise and you may not get back the amount originally invested.
The information in this article does not qualify as an investment recommendation.
Marketing Communication.
8 minute read
Key takeaways:
- While escalation and broadening of the conflict in the Middle East remains a possibility, markets have so far given few clear signals that any asset price moves are being driven by escalating geopolitical risk.
- The dynamics could change should the conflict spread across the Middle East, given the importance of the region to global fossil fuel supply – the potential involvement of Iran is a key factor.
- Equity and lower quality fixed income assets continue to price in a limited risk of recession, leaving markets more vulnerable to the impact of negative developments. This highlights the importance of diversification at an asset class level, and a focus on higher quality when choosing exposure.