
Key takeaways:
- Historically strong economic growth suggests the Fed’s recent rate hike may be the first in a broader tightening cycle.
- Because the Fed typically reacts to economic conditions with a lag, monetary policy could remain restrictive even as the cycle evolves.
- Deglobalization is fueling inflation and corporate pricing power, potentially keeping rates higher for longer and shifting investor focus from speculation to fundamentals.
An old saying is that the Fed “takes the punchbowl away from the party.” Late-cycle periods have generally been characterized by healthy economic growth, strong earnings growth, investor enthusiasm, rising inflation, and rising long-term interest rates. In response, the Fed has typically raised interest rates, which has tended to calm the markets and restore more rational capital allocation. But in doing so, it spoiled investors’ fun.
The Fed recently began raising interest rates. Investors now need to consider whether the recent rate hike will be one in a series and whether multiple rate hikes could once again take the punchbowl away from the party.
If the Fed does spoil the party, speculators may want to consider dialing back risk taking and focusing more on fundamentally based investment themes.
The economy is STRONG!
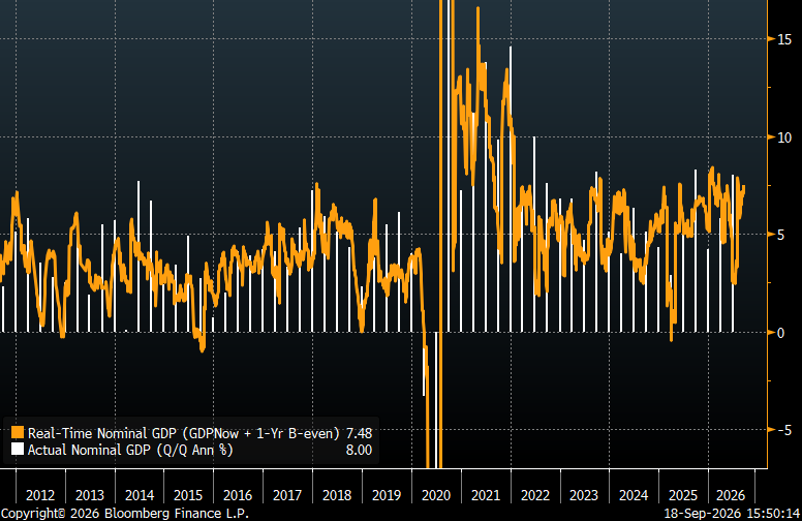
Few economists seem willing to acknowledge that the nominal economy is very strong. Nominal GDP growth in the second quarter of 2026 was 8%, and our nominal GDP tracker suggests 7% growth for the third quarter. By historical standards, this is very strong growth (see Exhibit 1).
In addition, nominal GDP during the third quarter of 2025 was greater than 8%. Other than during the immediate post-pandemic period, the U.S. had not seen a string of 7% to 8% nominal GDP quarters like this in roughly 20 years.
It is understandable that Washington does not want to discuss the strength of the economy as we approach the midterm elections. The Democrats may not want to admit the economy is strong because it would give the Republicans credit. The Republicans, however, may not want to brag about the economy’s strength because it could make them look out of touch as polls show affordability is many voters’ main concern.
Exhibit 1: Nominal GDP tracker vs. actual nominal GDP (Sep. 2011–Jun. 2026)
Source: RBA and Janus Henderson Investors, Bloomberg Finance L.P., as of September 18, 2026.
The Fed is a lagging indicator
There are three categories of economic indicators: leading, coincident, and lagging. Leading indicators generally turn before the overall economy turns. Coincident indicators turn in tandem with the economy. Lagging indicators turn after the economy has already turned.
We have argued for decades that the Fed is a lagging indicator, and investors can generally anticipate the Fed’s actions by following leading and coincident indicators.
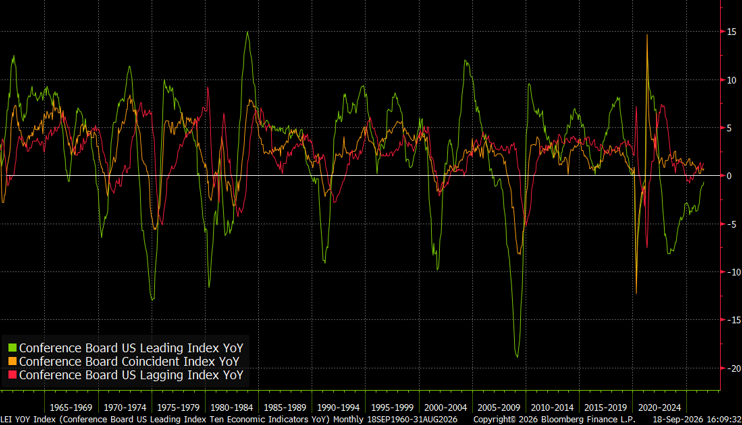
Exhibit 2 shows the year-to-year percent change in the Conference Board’s Leading, Coincident, and Lagging Indicators. As one might expect, the Leading Indicator (green) generally turns before the Coincident Indicator (yellow), which generally turns before the Lagging Indicator (red).
Exhibit 2: Conference Board Leading, Coincident, and Lagging Indicators: YoY % Change (Sep. 1960–Aug. 2026)
Source: RBA and Janus Henderson Investors, Bloomberg Finance L.P., as of September 18, 2026.
Some economists suggest the Fed is a leading indicator, but history demonstrates that monetary policy is not set in anticipation of future events. Rather, it is set by reacting to recent experience.
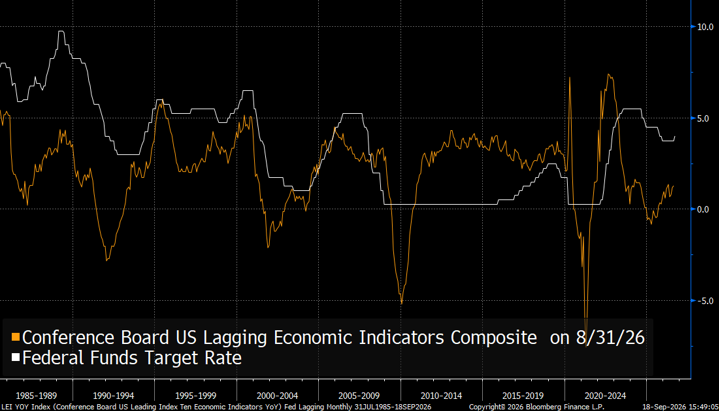
Exhibit 3 shows the fed funds rate versus the Lagging Indicator (the red line in Exhibit 2). Changes in the fed funds rate can move in tandem with the Lagging Indicator but, surprisingly, the fed funds rate typically lags even the Lagging Indicator.
The current cycle is a good case study for how the Fed’s actions lag the economy. The Lagging Indicator troughed in April 2025, yet the Fed just raised rates for the first time in this cycle – 17 months after the Lagging Indicator troughed.
Exhibit 3: Fed funds vs. Conference Board Lagging Indicator (Jul. 1985–Aug. 2026)
Source: RBA and Janus Henderson Investors, Bloomberg Finance L.P., as of September 18, 2026.
Deglobalization’s secular inflation might handcuff the Fed
We continue to believe that deglobalization is forcing the global economy into a new inflation paradigm. If that is correct, the Fed may be in the early stages of tighter secular monetary policy than investors are used to.
For many years, the Fed was able to rush to the aid of the financial markets when trouble arose. The Fed willingly and aggressively cut interest rates in response to the 1987 crash, the Asian and Russian financial crises in 1997–1998, the deflation of the tech bubble, the Global Financial Crisis, and the pandemic. It had the flexibility to be generous and not worry about the inflationary consequences because globalization was exerting considerable deflationary forces on the U.S. economy.
Globalization opened markets and increased competition, and basic economic theory suggests that increasing competition results in price competition and lower prices. However, deglobalization seems to be reversing that benign backdrop. It is closing markets and decreasing competition, which has put upward pressure on prices.
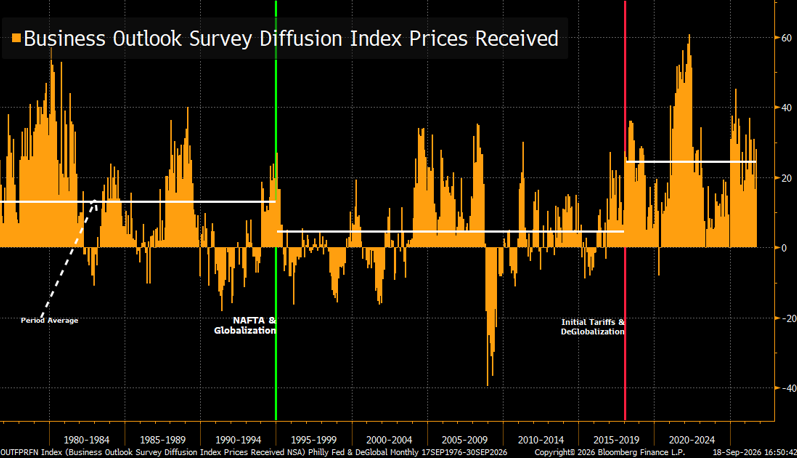
Exhibit 4 highlights the Philadelphia Fed Manufacturing Business Outlook Survey prices received index and shows the effects of deglobalization on U.S. corporate pricing power. Before globalization (which we arbitrarily define as beginning with the implementation of NAFTA), corporations on average had fairly strong pricing power. As globalization expanded, however, their pricing power was more constrained. We use 2018’s tariffs as the starting point for deglobalization, and the ability to raise prices has been substantially greater as competition has been reduced. In fact, this survey suggests that companies today have greater pricing power than those in the late 1970s and 1980s.
Exhibit 4: Philadelphia Fed prices received index (Sep. 1976–Sep. 2026)
Source: RBA and Janus Henderson Investors, Bloomberg Finance L.P., as of September 18, 2026.
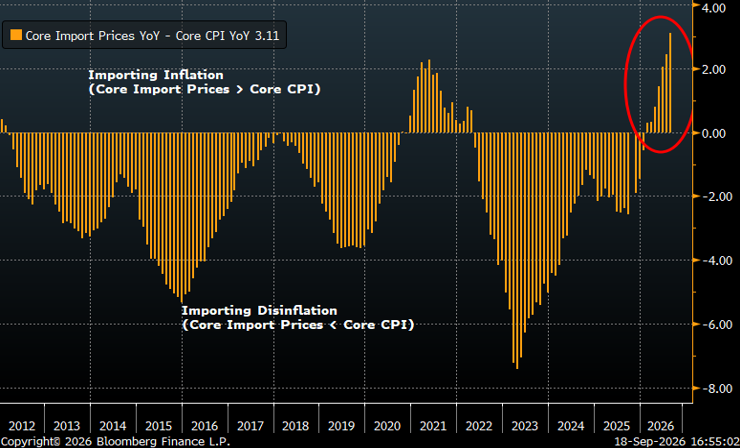
Additionally, as globalization expanded, U.S. core import price inflation was less than the inflation depicted by the core Consumer Price Index (CPI). Economists described that as the U.S. importing disinflation.
Today, however, deglobalization is boosting core import prices (i.e., prices excluding food and energy, so this is not simply a function of conflict in the Middle East). The U.S. is now clearly “importing inflation,” as core import price inflation is far outpacing core CPI inflation. Exhibit 5 shows this significant shift in U.S. inflation dynamics.
Exhibit 5: Core import prices YoY – core CPI YoY (Dec. 2011 – Aug. 2026)
Source: RBA and Janus Henderson Investors, Bloomberg Finance L.P., as of September 18, 2026.
Time to sober up?
This cycle, like the many before it, could end with the Fed taking the punchbowl away from the party. It also seems unlikely that restrictive fiscal policy (cutting spending and raising taxes) will occur anytime soon, so the Fed may be on its own to fight inflation.
Deglobalization’s secular inflationary forces could complicate matters for the Fed and leave it with no choice but to raise rates for longer than the markets currently anticipate.
Although the Fed reducing the economy’s liquidity could be a challenging environment for speculation, we believe those restrictive actions will lead, as they have done in virtually every previous cycle, to more rational allocation of capital within the economy. Sectors that have been starved for capital by the AI boom might again attract capital.
Accordingly, we continue to focus on fundamentals rather than momentum and reiterate several themes from our earlier comments and reports:
- Short-duration equities: Dividend-paying, lower-beta stocks remain attractive.
- Non-U.S. stocks: Roughly 75% of stocks with secular earnings-per-share (EPS) expected growth greater than 25% are now non-U.S. stocks.1
- The risks of indexing: Be wary of indexing for fear of another “lost decade in equities”.
1 Source: MSCI ACWI Index, as of September, 14, 2026.
Beta measures the volatility of a security or portfolio relative to an index. Less than one means lower volatility than the index; more than one means greater volatility.
Conference Board’s Leading, Coincident, and Lagging Indicators are composite economic indexes designed to signal different stages of the business cycle. Leading indicators generally turn before the overall economy turns, coincident indicators turn in tandem with the economy, and lagging indicators turn after the economy has already turned.
Consumer Price Index (CPI) is an unmanaged index representing the rate of inflation of the U.S. consumer prices as determined by the U.S. Department of Labor Statistics.
Disinflation is a temporary slowing in the rate of price inflation, where goods and services still become more expensive, but at a slower pace.
Earnings per share (EPS) growth is the rate at which a company’s earnings per share increase over a given period. EPS is calculated by dividing a company’s earnings by the number of shares outstanding.
Gross domestic product (GDP) is the value of finished goods and services produced by a country within a specific period. Nominal GDP measures GDP at current market prices and therefore includes the effects of inflation.
Fiscal policy: Describes government policy relating to setting tax rates and spending levels. Fiscal policy is separate from monetary policy, which is typically set by a central bank.
Fundamentals are the underlying factors that contribute to the valuation of a security, such as a company’s earnings, revenues, assets, liabilities, and growth prospects. At the economic level, fundamentals may include factors such as inflation, interest rates, and economic growth.
Late cycle refers to the mature stage of the economic cycle, typically characterized by healthy economic growth, strong earnings growth, investor enthusiasm, rising inflation, and rising long-term interest rates.
Monetary policy: The policies of a central bank, aimed at influencing the level of inflation and growth in an economy. Monetary policy tools include setting interest rates and controlling the supply of money.
Monetary tightening refers to actions taken by a central bank to restrict the supply of money and credit, typically by raising interest rates or reducing liquidity, with the aim of slowing economic growth and controlling inflation.
Philadelphia Fed Manufacturing Business Outlook Survey prices received index is a component of the Federal Reserve Bank of Philadelphia’s Manufacturing Business Outlook Survey that measures changes in the prices manufacturers receive for their products. A reading above zero indicates that more firms reported price increases than decreases, while a reading below zero indicates that more firms reported price decreases than increases.
Secular refers to a long-term trend or theme that is not driven primarily by shorter-term cyclical factors.
These are the views of the author at the time of publication and may differ from the views of other individuals/teams at Janus Henderson Investors. References made to individual securities do not constitute a recommendation to buy, sell or hold any security, investment strategy or market sector, and should not be assumed to be profitable. Janus Henderson Investors, its affiliated advisor, or its employees, may have a position in the securities mentioned.
Past performance does not predict future returns. The value of an investment and the income from it can fall as well as rise and you may not get back the amount originally invested.
The information in this article does not qualify as an investment recommendation.
There is no guarantee that past trends will continue, or forecasts will be realised.
Marketing Communication.