The data to watch as global markets diverge
Global Head of Multi-Asset Adam Hetts sees policy – and market outcomes – diverging across regions as officials adjust policy to reflect their domestic inflation and growth environments.


9 minute read
Key takeaways:
- After a period of relatively uniform policy prescriptions, the world’s regions are increasingly adjusting approaches to cater to their unique economic circumstances.
- The late-year bond rally belied the reality that many regions still face persistent inflation. Some central banks will likely end up delaying rate cuts, while others that already face economic weakness may be forced to act sooner.
- Given diverging economic prospects and valuations, investors must discern which asset classes, sectors, and levels of interest rate exposure sufficiently reflect current – and future – risks and opportunities.
A hotter-than-expected January reading of the U.S. consumer price index (CPI) validated the Federal Reserve’s (Fed) recent trepidation in sounding the all clear in its battle against inflation. It also provided another example of major economies’ diverging paths with respect to managing inflation and potentially engineering a soft landing. After an extended period of global markets largely moving in unison – with the macro seemingly calling the shots – we believe the world’s economy has arrived at the point where both economic prospects and returns across asset classes will disperse, driven more by idiosyncratic factors and less by uniform forces.
To understand what factors may influence future policy – and, thus, markets – we highlight several data series that bear monitoring over the coming months. Importantly, we explain what different trajectories of these macro drivers could mean for investors.
As economic developments unfold, investors will need to recognize which asset classes are already fully valued and which present opportunities should the data break in their favor. These observations build upon the views of our Multi-Asset and Solutions teams concerning how investors might position allocations at this critical juncture.
Inflation: Not done yet
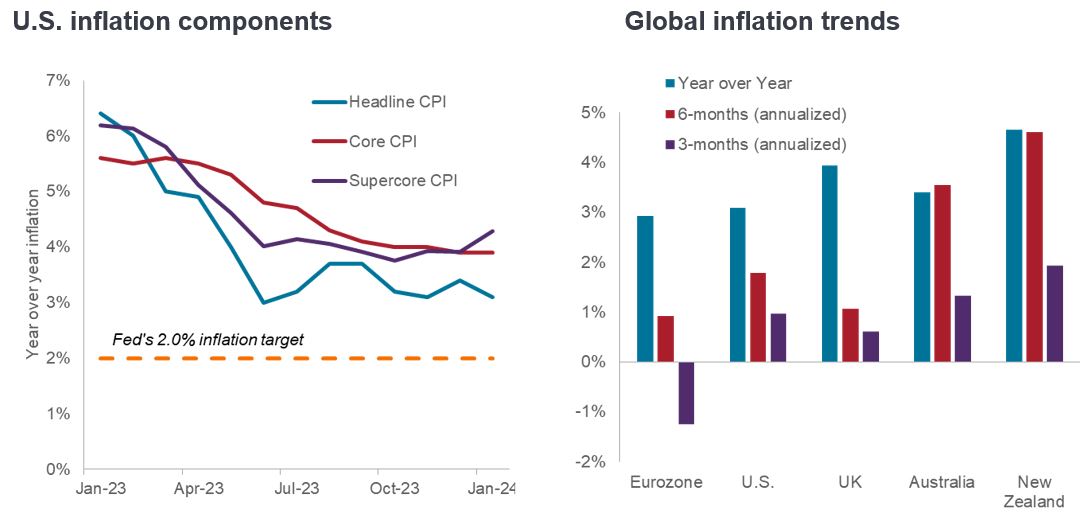
The immediate question after the Fed’s most recent policy-setting meeting was, what other “continued progress” does the central bank need to see before initiating rate cuts? Headline inflation fell from 9.1% year over year to 3.1% by January, and the pace of change is even more pronounced on a three- and six-month basis. But with core inflation (ex food and energy) holding steady at 3.9%, the Fed would likely be hard pressed to initiate cuts at its March meeting. What’s more, so-called “supercore” inflation (i.e., core services ex energy and housing) ticked up to 4.3%, year over year. Stubborn services inflation – due partly to upward wage pressure – more than offsets the CPI’s goods contribution entering deflationary territory.
 Source: Bloomberg, as of 16 February 2024.
Based on three- and six-month annualized CPI data, the U.S. is in the middle of the pack in the battle against inflation. Trends in other regions illustrate how policy that had been moving in lockstep will likely need to decouple. For example, the eurozone is seeing inflation plummet not due to particularly effective policy, but rather a stalling economy. Meanwhile, still uncomfortably high prices in Australia and New Zealand could postpone any plans of easing.
The longer rates remain restrictive, the greater the odds that the extended period of hawkish policy saps economic growth, eventually weighing on corporate earnings. It is for this reason that we believe the likelihood of a soft landing has somewhat narrowed. Conversely, premature cuts, to paraphrase Fed Chair Jerome Powell, could result in inflation stabilizing above the preferred policy target. This not only poses a risk to bonds, but would also distort consumption patterns as households and businesses adapt to a higher inflation regime and could become a drag on company margins.
Employment: Strength to strength in the U.S.?
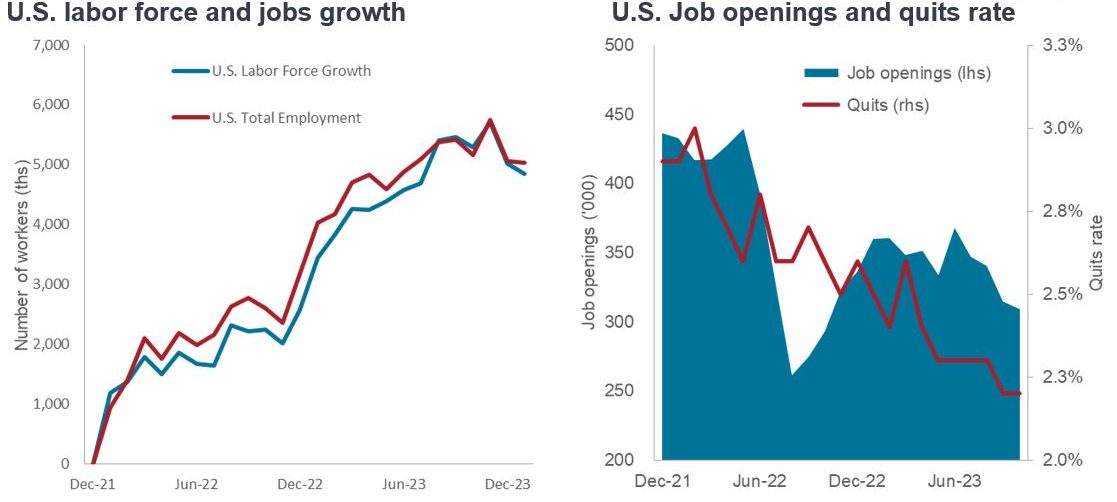
Behind resilient U.S. consumption is a robust labor market, with the unemployment rate remaining below 4.0% for almost two years. This consistency is owed to the number of people re-entering the workforce since the end of 2021 almost equaling the number of jobs created. Although a sign of economic strength, we believe the Fed will want to see a few more frustrated job seekers – resulting in a higher unemployment rate – before they consider offering up more than just dovish rhetoric.
 Source: Bloomberg, as of 16 February 2024.
Despite a low unemployment rate and strong payrolls growth, other indicators hint at a cooling labor market. Meteoric wage growth during the post-pandemic reopening was partly due to a historic level of job openings. Those have fallen by a quarter since their peak. Similarly, the percentage of workers confident enough to quit is well off the record high registered in 2022.
Not surprisingly, regions struggling to rein in prices also have relatively low jobless rates as the competition for labor fuels wage-driven inflation. Among these are the UK, Australia, and New Zealand. Within the eurozone, while still low by historical standards, unemployment has ticked up in key countries, a development reflected in weak retail sales.
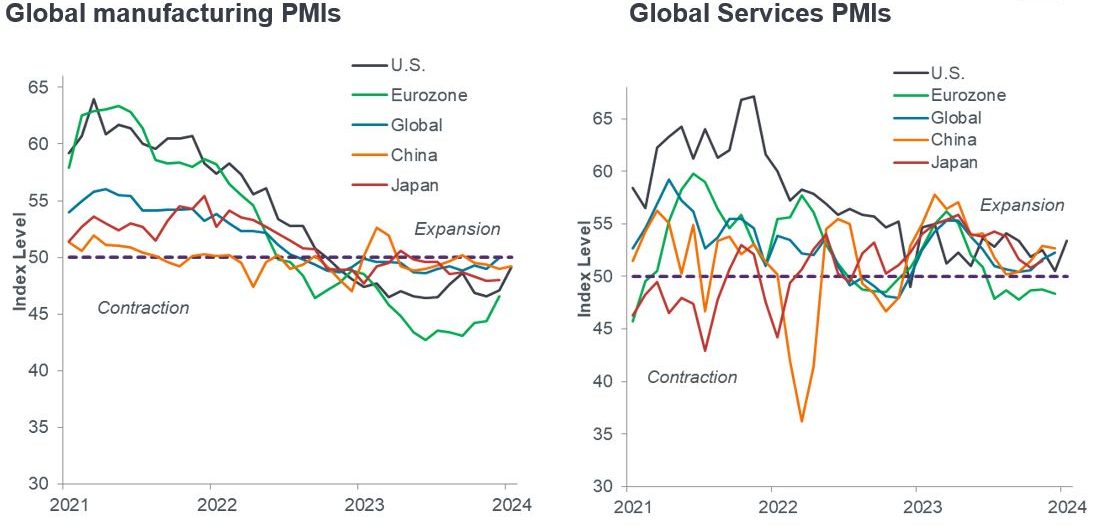
Purchasing manager indices (PMI): Services holding on
The historic tightening cycle is weighing on global manufacturing and other rate-sensitive segments of the economy. With the exception of the eurozone, services have held up better. Should services manage to stay in expansion territory as inflation continues its downward path, an elusive soft landing may be achieved.
Whether that comes to pass depends on which of two schools of thought wins out. Many economists suggest that the U.S. consumer – a bulwark of global growth – is less exposed to interest rate swings than in the past. Others argue that the notoriously long and variable lags of hawkish policy will inevitably catch up to consumption, especially with pandemic-era support having played out and certain job indicators pointing to softening.
 Source: Bloomberg, as of 16 February 2024.
Should services PMIs start flashing yellow, we’d expect to see consumption follow suit in the regions where this segment of the economy dominates. Consequently, more cyclically exposed sectors may face headwinds. At the same time, the potential slowdown in wage-driven inflation that would likely accompany weakening services could give central banks cover to cut rates, cushioning the economic downdraft and providing relief to bonds.
All eyes on rates
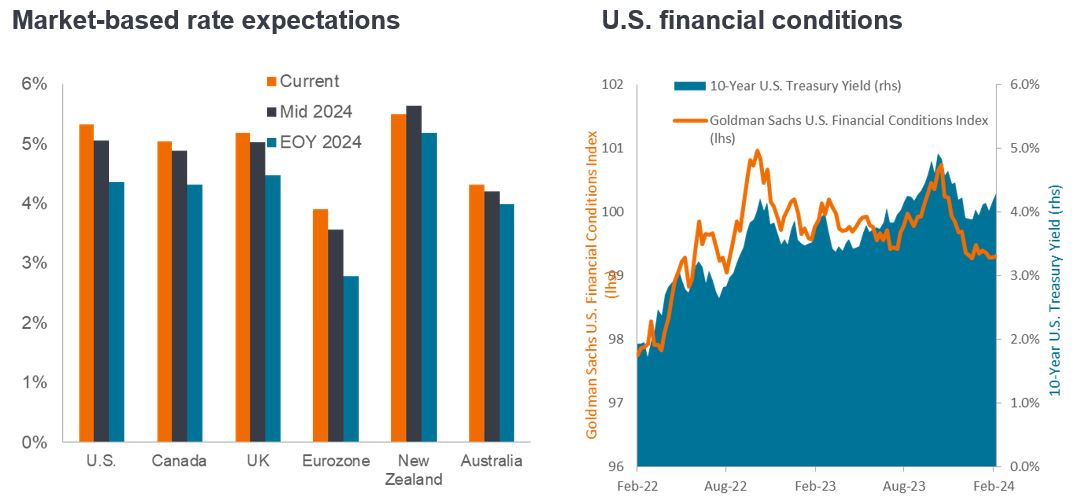
Enthusiasm for a flurry of rate cuts in 2024 has been curtailed as the market acknowledges what central banks have long stated: Getting inflation from 3.0% to 2.0% will be much harder than guiding it from 9.0% to 3.0%. Granted, rates in most regions have hit their cycle peak, and the next move will certainly be lower. Still, the timing and pace will likely diverge across geographies as officials seek to prescribe policy catered to their unique conditions.
As the overnight lending rate should roughly equal inflation, there is little justification for policy rates in many developed markets to reside between 4.0% and 5.0%. Regions with resilient economies – like the U.S., where gross domestic product growth is expected to be 1.6% in 2024 – likely have the luxury of waiting, with the hope that demand-driven inflation will continue to succumb to a higher cost of capital. Others, like the eurozone, could be forced to act sooner, especially as the bloc’s economy is forecast to flirt with 0.0% growth over the next few quarters.
 Source: Bloomberg, as of 14 February 2024.
In the U.S., the late-year rally did not help policymakers, as lower bond yields and higher stocks contributed to easing financial conditions. With the market already implicitly easing conditions, the Fed would have a hard time justifying a series of rate cuts absent an unforeseen development, such as a geopolitical crisis.
Equities: More varied than one would think
It may seem incongruent to speak of several global equity indices at, or near, record levels in the aftermath of a historic tightening cycle. This is a consequence of markets being dominated by a few U.S.-domiciled, mega-cap, tech-focused names. When isolating those, valuations across regions, sectors, and styles are more dispersed, with many appearing deeply discounted. The task for investors is to identify which segments of the market reflect an acceptable balance of economic reality, long-term growth potential, and fair value.
Equity valuations by region
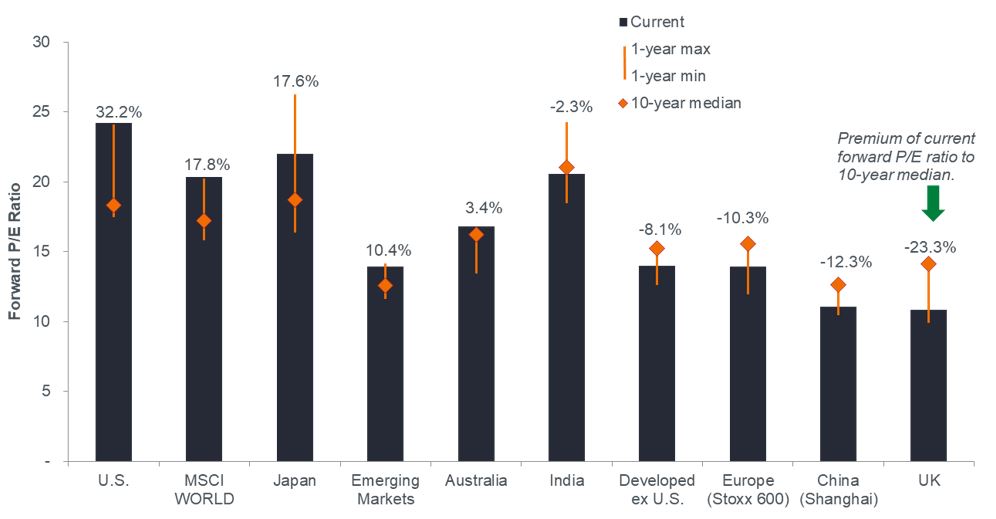 Source: Bloomberg, as of 14 February 2024. Note: Past performance does not predict future returns.
While well above historical valuations, U.S. stocks are leveraged to powerful secular themes like artificial intelligence (AI), cloud computing, and healthcare innovation. These segments could hold up well in a weaker-than-expected economy. Yet even within the U.S., there is considerable dispersion in valuations, with both value and mid-cap stocks trading much closer to historical norms. These segments could be well positioned should a delay in rate cuts act as a headwind for growth stocks.
Globally, Europe looks cheap, as does mainland China. Much bad news is priced into the former, but this may overlook European corporations’ global footprint, which could compensate for domestic weakness. Chinese valuations reflect a moribund domestic property sector and debt overhang, but the nature of the government means that additional powerful stimulus cannot be ruled out. On a sector level, global energy and materials appear cheap, as one would expect in a late-cycle environment. But so, too, do traditionally defensive segments such as utilities and consumers staples.
Bonds: What’s priced in?
Within fixed income, we believe that adjusting duration to appropriately reflect a region’s inflation and growth prospects is paramount. The recent back-up in yields may present opportunities in countries that could soon be forced to cut rates. Others that are still seeking to gain the upper hand against inflation could see upward pressure on shorter-dated yields as investors adjust to that possibility.
Credit allocations merit consideration as different segments are pricing in a range of economic outcomes. Based on the difference between their yields and those of their risk-free benchmark, securitized credit appears to reflect a weaker economic environment than do corporate credits. At current levels, corporate spreads would offer little cushion to absorb a rise in yields along certain segments of the curve – a scenario that cannot be dismissed given the market’s previous misfires in anticipating falling rates.
U.S. fixed income market spreads
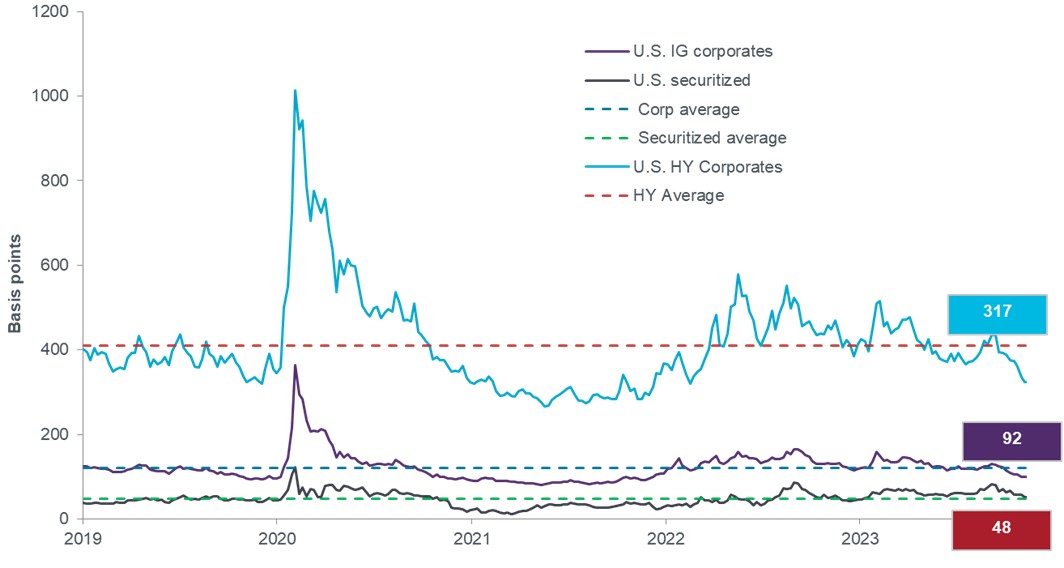 Source: Bloomberg, as of 14 February 2024.
But quality matters, too. Many higher-quality issuers took advantage of the era of extremely low rates to extend their maturity profile well into the future. Conversely, companies with more cyclical exposure and higher debt loads were unable to capitalize on investor appetite, potentially leaving them exposed to a liquidity event should economic growth surprise to the downside.
Basis point (bp) equals 1/100 of a percentage point. 1 bp = 0.01%, 100 bps = 1%.
Credit Spread is the difference in yield between securities with similar maturity but different credit quality. Widening spreads generally indicate deteriorating creditworthiness of corporate borrowers, and narrowing indicate improving.
Duration measures a bond price’s sensitivity to changes in interest rates. The longer a bond’s duration, the higher its sensitivity to changes in interest rates and vice versa.
Price-to-Earnings (P/E) Ratio measures share price compared to earnings per share for a stock or stocks in a portfolio.
Purchasing Managers’ Index (PMI) is an index of the prevailing direction of economic trends in the manufacturing and service sectors, based on a survey of private sector companies.
Quantitative Tightening (QT) is a government monetary policy occasionally used to decrease the money supply by either selling government securities or letting them mature and removing them from its cash balances.
A yield curve plots the yields (interest rate) of bonds with equal credit quality but differing maturity dates. Typically bonds with longer maturities have higher yields.
Yield cushion, defined as a security’s yield divided by duration, is a common approach that looks at bond yields as a cushion protecting bond investors from the potential negative effects of duration risk. The yield cushion potentially helps mitigate losses from falling bond prices if yields were to rise.
IMPORTANT INFORMATION
Equity securities are subject to risks including market risk. Returns will fluctuate in response to issuer, political and economic developments.
Fixed income securities are subject to interest rate, inflation, credit and default risk. The bond market is volatile. As interest rates rise, bond prices usually fall, and vice versa. The return of principal is not guaranteed, and prices may decline if an issuer fails to make timely payments or its credit strength weakens.
These are the views of the author at the time of publication and may differ from the views of other individuals/teams at Janus Henderson Investors. References made to individual securities do not constitute a recommendation to buy, sell or hold any security, investment strategy or market sector, and should not be assumed to be profitable. Janus Henderson Investors, its affiliated advisor, or its employees, may have a position in the securities mentioned.
Past performance does not predict future returns. The value of an investment and the income from it can fall as well as rise and you may not get back the amount originally invested.
The information in this article does not qualify as an investment recommendation.
Marketing Communication.
9 minute read
Key takeaways:
- After a period of relatively uniform policy prescriptions, the world’s regions are increasingly adjusting approaches to cater to their unique economic circumstances.
- The late-year bond rally belied the reality that many regions still face persistent inflation. Some central banks will likely end up delaying rate cuts, while others that already face economic weakness may be forced to act sooner.
- Given diverging economic prospects and valuations, investors must discern which asset classes, sectors, and levels of interest rate exposure sufficiently reflect current – and future – risks and opportunities.