US growth: How much juice is left in the squeeze?
Oliver Blackbourn, Portfolio Manager in the Multi-Asset Team, considers if US growth stocks are close to a peak after what has been stellar performance thus far in 2023.


13 minute read
Key takeaways:
• US growth stocks have rallied hard, boosted by positive expectation for AI-related stocks, increased liquidity into the financial system, and a substantial rebound in sentiment.
• We remain somewhat wary of the current consensus earnings outlook, given the potential impact of interest rate increases on economic growth.
• Predicting exactly when markets might turn is a dangerous business. While valuations are not yet extreme, the current rally may become more fragile without further catalysts to sustain positive sentiment.
US growth stocks have rallied hard in 2023, led by stellar returns of 39% from the NASDAQ 100 Index and 74% from the narrower NYSE FANG+ Index1 in the first six months. Within this, we have seen extraordinary surges in stocks like microchip designer NVIDIA, which rose 190% to the halfway point in the year. The rally comes after dismal returns from growth stocks in 2022 as rising real (inflation-adjusted) bond yields led to a significant reset in valuations from very elevated levels. We explore the likely reasons for the surge, consider where the market is now, and think about what might be in store in the coming months, in light of the current market set up.
What has driven the rally?
We can identify several reasons for the surge this year. Firstly, markets have embraced the artificial intelligence (AI) theme that could be very important for the future earnings of technology companies in particular. Secondly, there has been an injection of liquidity into the financial system after a period of ebbing due to tightening monetary policy. Finally, there has been a sentiment and positioning squeeze from very bearish levels in late 2022 that has left investors trying to re-engage with stock markets, particularly the stocks that had suffered most in 2022. The mixture has been rocket fuel for US growth stocks.
Taking those points in reverse order, we have seen a substantial reset in various indicators of sentiment and positioning since the end of Q3 2022. Surveys of US individual investors and advisers both show that the proportion of those that are bullish has leapt in 2023 from historically very bearish levels (Exhibit 1). While perhaps not yet overly optimistic, the latest levels suggest a reasonably positive outlook. We have seen asset managers increasing their exposure through futures contracts in the NASDAQ 100 and wider S&P 500 indices. At the same time, the VIX Index – an indicator of implied volatility that is commonly used as a measure of uncertainty about the future – has plunged to low levels, suggesting that investors are remarkably calm about the future. Improving sentiment tends to lead to strong rallies in markets and recent optimism has been focused on US growth companies in particular.
Exhibit 1: Recent bearish to bullish shift has favoured US growth stocks
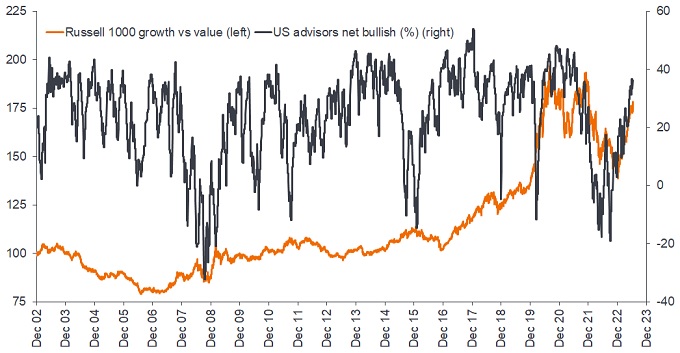
Source: Refinitiv Datastream, 31 December 2002 to 19 July 2023. Chart shows the recent correlation between net bullish advisor sentiment and US growth stock outperformance relative to US value stocks in 2023. Left axis, showing relative performance of growth vs value stocks as a percentage, rebased to 100 at 31 December 2002. Past performance does not predict future returns.
The second factor has been a somewhat unexpected liquidity injection into markets early in the year. Liquidity is a somewhat enigmatic topic but one that many observers believe has been an important driver of markets over the last decade, particularly the notion of excess liquidity. Many investors believed that the shift to quantitative tightening (from quantitative easing) would result in a clear reduction in excess liquidity, particularly with the US Federal Reserve (Fed) selling up to $95 billion of assets each month.
Instead, a combination of factors around the world led to a jump in liquidity that has historically benefited most asset classes, US growth stocks in particular. One factor was the run up to the cap in the US debt ceiling and a potential government shutdown earlier this year. Instead of weakness due to a potential default, the lack of borrowing by the US government (where it takes cash from investors in exchange for debt securities) led to a rise in liquidity available to invest in riskier assets as the US government spent what could be termed its “rainy day” fund. With the US Treasury having run down its account at the Fed by around $500 billion, there was a significant injection of cash into markets from just this one source. With the European Central Bank also beginning to unwind its quantitative easing holdings, the liquidity picture looks to be changing.
The third factor has been the intensifying of the AI theme as a driving force for future earnings growth at technology companies, particularly following the release of various consumer-focused products. AI has the potential to improve efficiency in many areas of the economy; in some places it has already been integrated to improve productivity. While there will be winners and losers, many companies across a range of industries can see the potential benefits, and it is likely to remain a key theme within the technology sector going forward. Such technological paradigm shifts can result in significant hype, despite the benefits likely not being felt until some point a significant way into the future and with the eventual winners still uncertain. However, once a theme has been identified, investors tend to buy the baskets of stocks that fit the theme today, with US growth stocks considered the obvious beneficiaries at the moment.
Where is the market at now?
After dipping 12% from April 2022 to February 2023, 12-month forward expected earnings for the NASDAQ 100 Index (Exhibit 2) have already recovered 75% of that decline (at 19 July 2023), reflecting analysts’ greater optimistic about the future for those companies in the index. This means that earnings expectations have almost returned to peak levels. Given our concerns about the effects of interest rate increases on economic growth as the year progresses, we remain somewhat wary of the current consensus earnings outlook. More leading indicators of growth suggest that we may yet see a slowdown in economies around the world and the speed at which interest rates have risen still leaves us somewhat nervous about the risks of financial sector shocks. While growth stocks performed well through the pandemic recession of 2020, there is still a significant degree of cyclicality in their earnings historically.
Exhibit 2: Earnings expectations have recovered to almost-peak levels
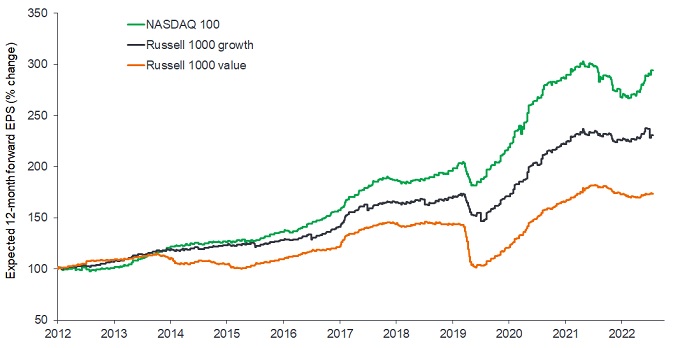
Source: Refinitiv Datastream, 31 December 2012 to 19 July 2023. Shows expected earnings per share (EPS) for the 12-month period ahead across stocks included in the relevant indices. Indices rebased to 100 at 31 December 2012. Past performance does not predict future returns.
At the same time, valuations have risen back into rarefied air. The price-to-earnings (P/E) ratios of the NASDAQ 100 and Russell 1000 indices dropped to around 20 times (20x) earnings in 2022, having previously reached over 30x in 2020. However, the price-to-earnings ratios of both indices have now returned to over 26x (Exhibit 3). This comes despite rising nominal and real US Treasury yields as core inflation has remained sticky and the Fed has continued to raise interest rates (until the pause at June’s meeting). Some of the key stocks driving the rally so far this year now have a price-to-sales ratio at levels above those seen for stocks such as Amazon during the tech bubble around the turn of the millennium.
Exhibit 3: P/E ratios are close to levels seen during the tech bubble era
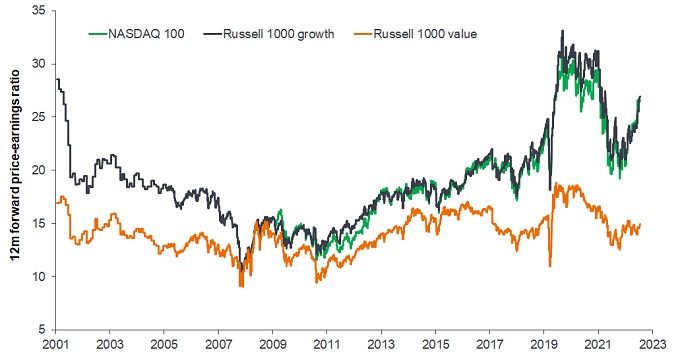
Source: Refinitiv Datastream, 31 December 2001 to 19 July 2023. Shows expected price-to-earnings ratios for the 12-month period ahead across stocks included in the relevant indices. Past performance does not predict future returns.
This combination of ‘close to peak’ earnings and a return to very high valuations suggests that there is potentially very little room for disappointment. Despite their seeming immunity to the economic issues during the COVID-19 pandemic, growth stocks have not historically avoided the broad economic swings that affect corporate earnings. Similarly, valuations have only been higher during the tech bubble or during the super-easy monetary policy regime during the pandemic that drove real yields to historic lows. In sum, current pricing and expectations may imply limited margin for error, even in the event of a normal economic cycle. It is also important to remember that the AI theme is one that looks likely to attract increasing policymaker and regulatory interest. Any intervention, or the prospect of it – particularly with campaigning for the 2024 US election starting to heat up – could change the outlook for corporate margins and earnings of those companies associated with the space.
Turning to sentiment and positioning, investors appear to have been chasing the rally, feeling squeezed out of the more bearish positioning they adopted in late 2022. Concerns about the effects of higher interest rates and a recession appear to have been forgotten by those owning risk assets. We tend to take the view that very optimistic sentiment and positioning leads to fragility in the prevailing market dynamic – once everyone is maxed out, there is less potential for further buying. While not yet extreme, some indicators are now entering quite bullish territory and leave less room for investor enthusiasm to improve. Worryingly for US growth stocks, a recent Bank of America Global Fund Manager Survey showed that being long “big tech” is the most crowded trade right now, by some margin.
So how much juice is left in the squeeze?
Predicting exactly when markets will turn has always been a dangerous business, and investors need to be even more wary when dealing with assets that may be veering off into bubble territory. The AI theme has the potential to do just this, with paradigm shifts in technology generally ripe for increasingly excitable speculation. However, it is important to remember that cyclical trends can quickly reassert themselves and we are a long way into a rapid interest-rate hiking cycle. Additionally, the threat of regulatory intervention is likely elevated, particularly at this point in the US election campaign.
While not yet clearly stretched, sentiment has reset dramatically since late 2022, but there is only so much optimism that markets can hold before fragility starts to set in. This suggests that the rally may become more fragile from here without further catalysts for an even rosier outlook.
—–
[1] Bloomberg, 31 December 2022 to 30 June 2023. Past performance does not predict future returns.
Glossary:
Bear/bull market: A bear market is one in which the prices of securities are falling. A generally accepted definition is a fall of 20% or more in an index over at least a two-month period. A bull market is one in which the prices of securities are rising, especially over a long time.
Crowded trade: A position held by a significant proportion of investors, which can have an impact on pushing up prices, but also potentially make it difficult to sell if sentiment changes.
Cyclical (stocks): Cyclicality implies sensitivity to background economic factors. Companies that sell discretionary consumer items, such as cars, or mining, are highly sensitive to changes in the economy. The prices of equities and bonds issued by cyclical companies tend to be strongly affected by ups and downs in the overall economy, when compared to non-cyclical companies.
Earnings per share (EPS): EPS is the bottom-line measure of a company’s profitability, defined as net income divided by the number of outstanding shares.
Economic cycle: The fluctuation of the economy between expansion (growth) and contraction (recession). It is influenced by many factors including household, government and business spending, trade, technology and central bank policy.
Futures contract: A contract for assets (especially commodities or shares) bought at agreed prices but delivered and paid for later.
Growth investing: Growth investors search for companies they believe have strong growth potential. Their earnings are expected to grow at an above-average rate compared to the rest of the market, and therefore there is an expectation that their share prices will increase in value.
Liquidity: The ability to buy or sell a particular security or asset in the market. Assets that can be easily traded in the market (without causing a major price move) are referred to as ‘liquid’.
Long position: A security that is bought in the expectation that it will rise in value. Being ‘long’ big tech, as mentioned here, would mean taking a relatively large position in that area of the market.
Nominal/real (yield): The nominal yield on a bond is the coupon, essentially the interest rate that the bond issuer promises to pay the holder. The real yield is the nominal yield minus the rate of inflation.
Price-to-earnings (P/E) ratio: A popular ratio used to value a company’s shares, compared to other stocks, or a benchmark index. It is calculated by dividing the current share price by its earnings per share.
Price-to-sales ratio: A financial ratio used to value a company’s shares. It is calculated by dividing a company’s market cap (number of total shares multiplied by the share price), by total sales or revenue over the past 12 months. In general, a lower ratio is considered better, although it varies across industries/sectors.
Quantitative easing (QE): An unconventional monetary policy used by central banks to stimulate the economy by boosting the amount of overall money in the banking system.
Quantitative tightening (QT): A contractionary monetary policy tool applied by central banks to decrease the amount of liquidity or money supply in the economy.
Recession: A significant, widespread, and prolonged downturn in economic activity, commonly accepted as two consecutive quarters of negative growth in gross domestic product (GDP).
Treasuries (Treasury bonds): Debt securities issued by a government.
Value investing: Value investors search for companies that they believe are undervalued by the market, and therefore expect their share price to increase. One of the favoured techniques is to buy companies with low price to earnings (P/E) ratios.
Volatility: The rate and extent at which the price of a portfolio, security or index, moves up and down. If the price swings up and down with large movements, it has high volatility. If the price moves more slowly and to a lesser extent, it has lower volatility. Higher volatility means the higher the risk of the investment.
Yield: The level of income on a security, typically expressed as a percentage rate. For equities, a common measure is the dividend yield, which divides recent dividend payments for each share by the share price. For a bond, this is calculated as the coupon payment divided by the current bond price.
Russell 1000® Value Index reflects the performance of U.S. large-cap equities with lower price-to-book ratios and lower expected growth values.
Russell 1000® Growth Index reflects the performance of U.S. large-cap equities with higher price-to-book ratios and higher forecasted growth values.
The Nasdaq 100® is an index of the 100 largest, most actively traded companies listed on the Nasdaq stock exchange.
The NYSE FANG+™ index provides exposure to a select group of highly traded growth stocks of next generation technology and tech-enabled companies.
The S&P 500® Index reflects U.S. large-cap equity performance and represents broad U.S. equity market performance.
Growth stocks are subject to increased risk of loss and price volatility and may not realize their perceived growth potential.
IMPORTANT INFORMATION
Technology industries can be significantly affected by obsolescence of existing technology, short product cycles, falling prices and profits, competition from new market entrants, and general economic conditions. A concentrated investment in a single industry could be more volatile than the performance of less concentrated investments and the market.
These are the views of the author at the time of publication and may differ from the views of other individuals/teams at Janus Henderson Investors. References made to individual securities do not constitute a recommendation to buy, sell or hold any security, investment strategy or market sector, and should not be assumed to be profitable. Janus Henderson Investors, its affiliated advisor, or its employees, may have a position in the securities mentioned.
Past performance does not predict future returns. The value of an investment and the income from it can fall as well as rise and you may not get back the amount originally invested.
The information in this article does not qualify as an investment recommendation.
Marketing Communication.
13 minute read
Key takeaways:
• US growth stocks have rallied hard, boosted by positive expectation for AI-related stocks, increased liquidity into the financial system, and a substantial rebound in sentiment.
• We remain somewhat wary of the current consensus earnings outlook, given the potential impact of interest rate increases on economic growth.
• Predicting exactly when markets might turn is a dangerous business. While valuations are not yet extreme, the current rally may become more fragile without further catalysts to sustain positive sentiment.