
Key takeaways:
- Global equities started 2026 on strong footing, with emerging markets, Asia Pacific and Europe leading the gains. Major U.S. benchmarks advanced more modestly as weakness in large‑cap tech and financials offset strength across other sectors.
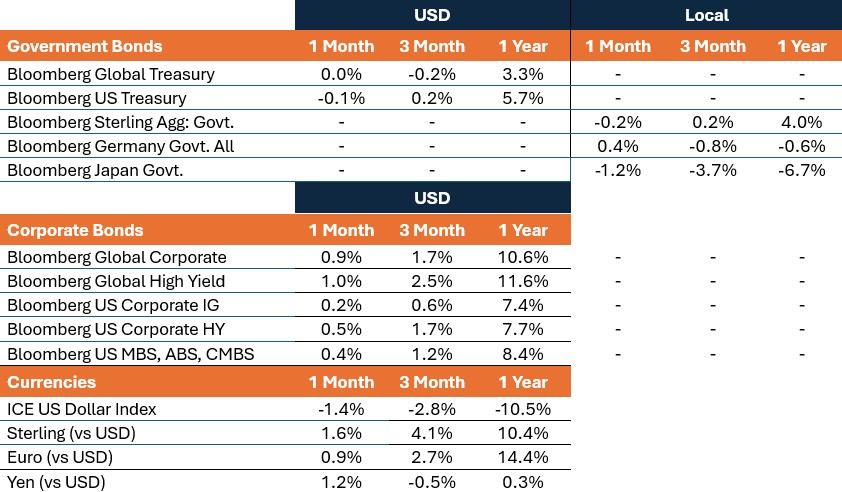
- Global sovereign bonds delivered mixed performance as yields on many longer-dated bonds rose, with Germany a notable exception. Global corporate bonds and securitized assets experienced positive returns, supported by tighter spreads and firm demand for new issuance.
- January’s positive equity performance belied a more unsettled global backdrop. Geopolitical tensions, driven in part by U.S. foreign‑policy actions, escalated alongside sharp currency swings and extreme commodity volatility. Market leadership broadened as cyclicals and non‑U.S. equities outperformed, while divergence within the artificial intelligence (AI) complex intensified.
Market overview
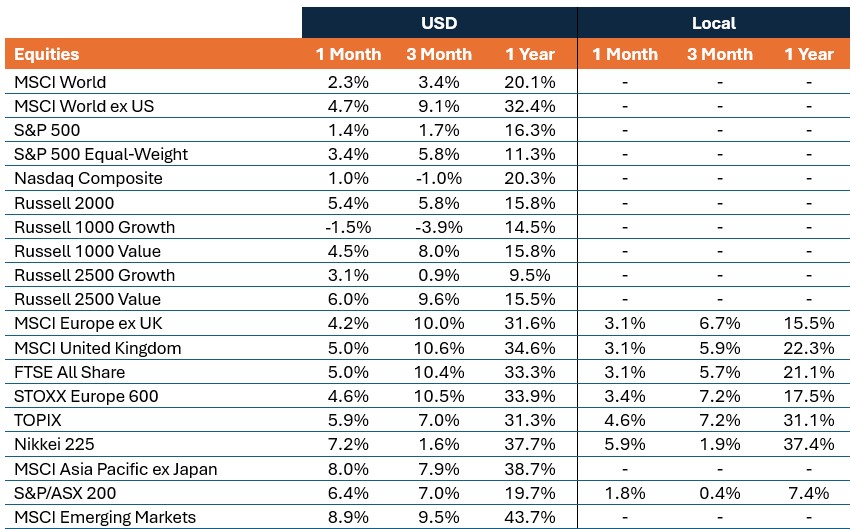
Global equities had a strong start to the year as leadership broadened further beyond U.S. mega-caps – extending December’s trend – with cyclical and value exposures outperforming once again in several regions. The MSCI World Index rose 2.3% in U.S. dollar terms, while the MSCI World ex US Index gained 4.7%, reflecting outsized strength across emerging markets and Asia Pacific coupled with a weaker U.S. dollar. Global government bonds delivered mixed returns for the month as yields on long-dated bonds rose, particularly in Japan, but with Germany a notable exception. Global corporate bonds had a strong month, delivering positive returns as spreads narrowed.
Oil prices rallied amid rising Middle East tensions, with WTI and Brent both snapping five-month losing streaks. WTI rose more than 13%, its best monthly performance since 2022. The U.S. Dollar Index fell 1.4%, at one point reaching a four-year low before a late-month rebound helped limit the downside. Gold and silver rallied, extending their 2025 gains, though both tumbled sharply at month end amid extreme volatility.
Emerging markets and Asia Pacific led global equities in January
Major U.S. benchmarks lagged as big tech weighed on the S&P 500® Index and Nasdaq Composite.
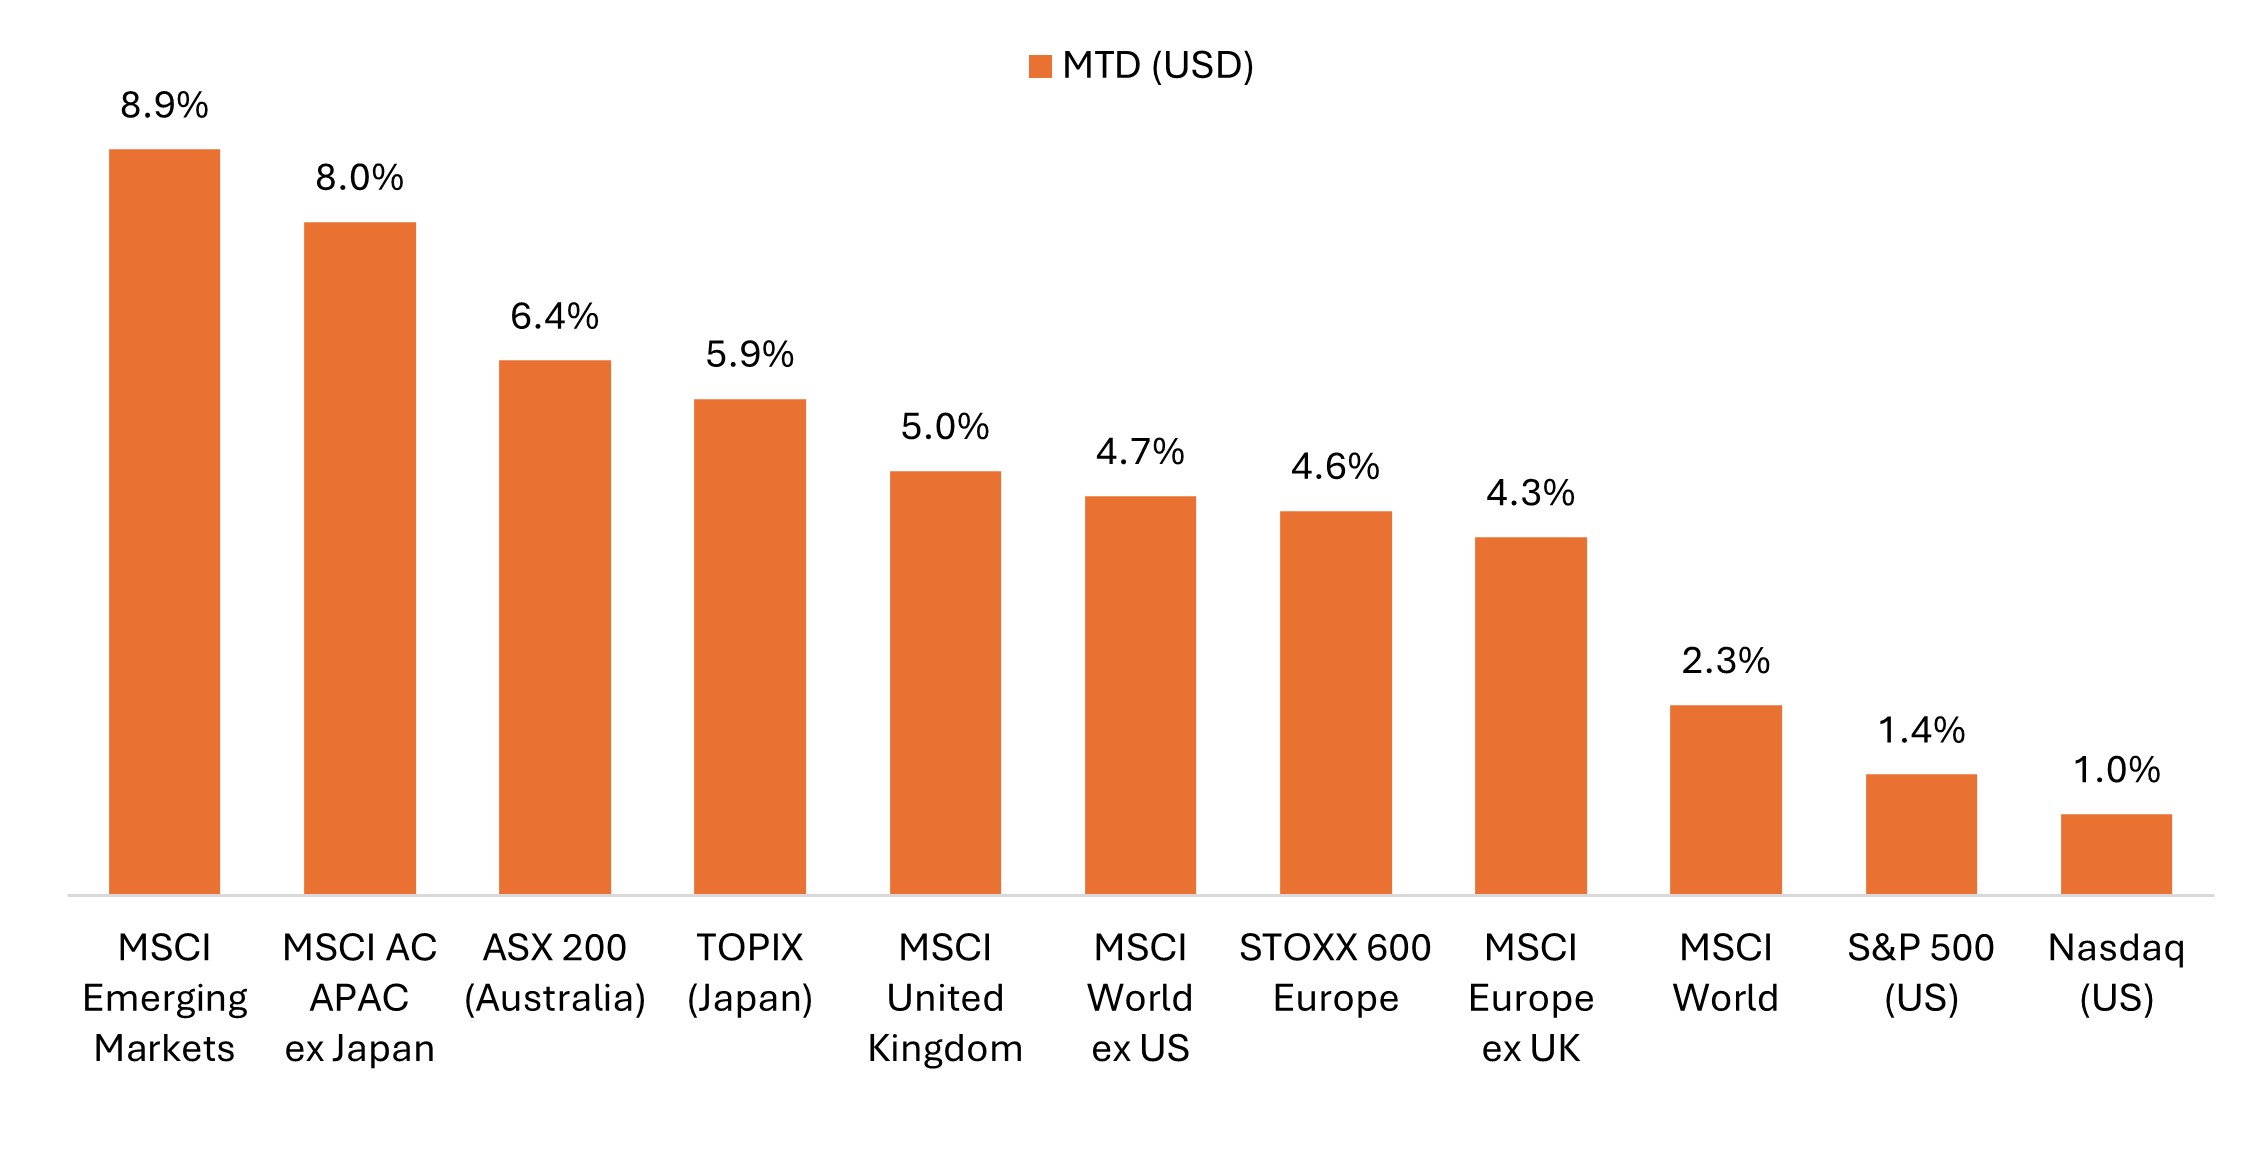
Source: Bloomberg, data from 31 December 2025 to 31 January 2026. Represents index total returns in U.S. dollar terms.
Key themes that mattered for markets
- Geopolitical tensions rose to the forefront: January saw a series of geopolitical flashpoints including U.S. military action in Venezuela, threats of potential strikes on Iran, and rising friction between the U.S. and NATO allies over Greenland. President Trump’s tariff threats toward Europe, Canada and South Korea further elevated policy uncertainty, though he softened some positions after announcing a “framework deal” with NATO. Equity markets remained broadly resilient, but the mix of geopolitical and trade risks added to a more unsettled global backdrop.
- U.S. dollar weakness and currency market whipsaw: The U.S. dollar fell to a four‑year low amid geopolitical tensions and fiscal policy uncertainty. The euro’s rapid rise prompted European Central Bank (ECB) officials to warn that further appreciation could necessitate rate cuts. The yen experienced extreme volatility amid intervention speculation and fiscal concerns in Japan. However, the month ended with the U.S. dollar’s strongest rally since May after President Trump’s nomination of Kevin Warsh as Federal Reserve (Fed) Chair.
- Commodities rally marked by extreme volatility: Gold climbed above $5,000 and was up nearly 30% for the month at one point, while silver surged more than 60% before both experienced their sharpest one‑day drops in decades on the final day of trading. Natural gas spiked on severe cold weather, copper reached record highs, and oil prices rose more than 10% on Middle East tensions, with WTI and Brent crude delivering their strongest monthly performance in four years.
- Sector rotation and broadening beyond mega-cap tech continued: Cyclical sectors extended their recent outperformance over traditionally defensive stocks. U.S. small‑caps, as represented by the Russell 2000, posted a 14‑day streak of outperformance versus the S&P 500, while value outpaced growth for a third straight month. International stocks led the way as emerging markets and ex-U.S. equities outperformed U.S. large caps, suggesting global leadership continued to broaden beyond the mega‑cap cohort.
- Divergence within the AI theme intensified: Markets drew sharp distinctions between AI winners and laggards in January. Meta and Microsoft earnings (released on the same day) underscored the bifurcation as META shares rallied sharply, and MSFT sold off. While both boosted CapEx forecasts, Meta’s stronger revenue guidance bolstered confidence in its AI monetization trajectory. Meanwhile, global chipmakers rallied on robust demand signals, while software stocks extended their recent slide amid mounting concerns about AI‑driven business‑model disruption.
United States
U.S. equities delivered monthly gains, albeit with significant sector divergence as weakness in big tech and financials partly offset strength elsewhere. Small caps notably outpaced large caps, while traditionally cyclical and commodity‑linked sectors were among the month’s strongest performers. Consumer staples also outperformed, helped by some well-received earnings results late in the month.
- The official cap-weighted S&P 500 gained 1.4%, while the equal-weight S&P 500 rose a much stronger 3.4%, reflecting the broadening leadership beyond mega-cap tech.
- The Nasdaq Composite rose 1.0%, ending a run of two straight monthly declines.
- The small-cap Russell 2000 rose 5.4% in January, which included a stretch of 14 consecutive days of beating the large-cap S&P 500.
- Value outperformed growth for a third straight month. The Russell 1000 Value Index gained 4.5%, while its growth counterpart fell 1.5%.
Sector performance reflected continued broadening beyond big tech
S&P 500 sector performance (January and three months ended 31 January)
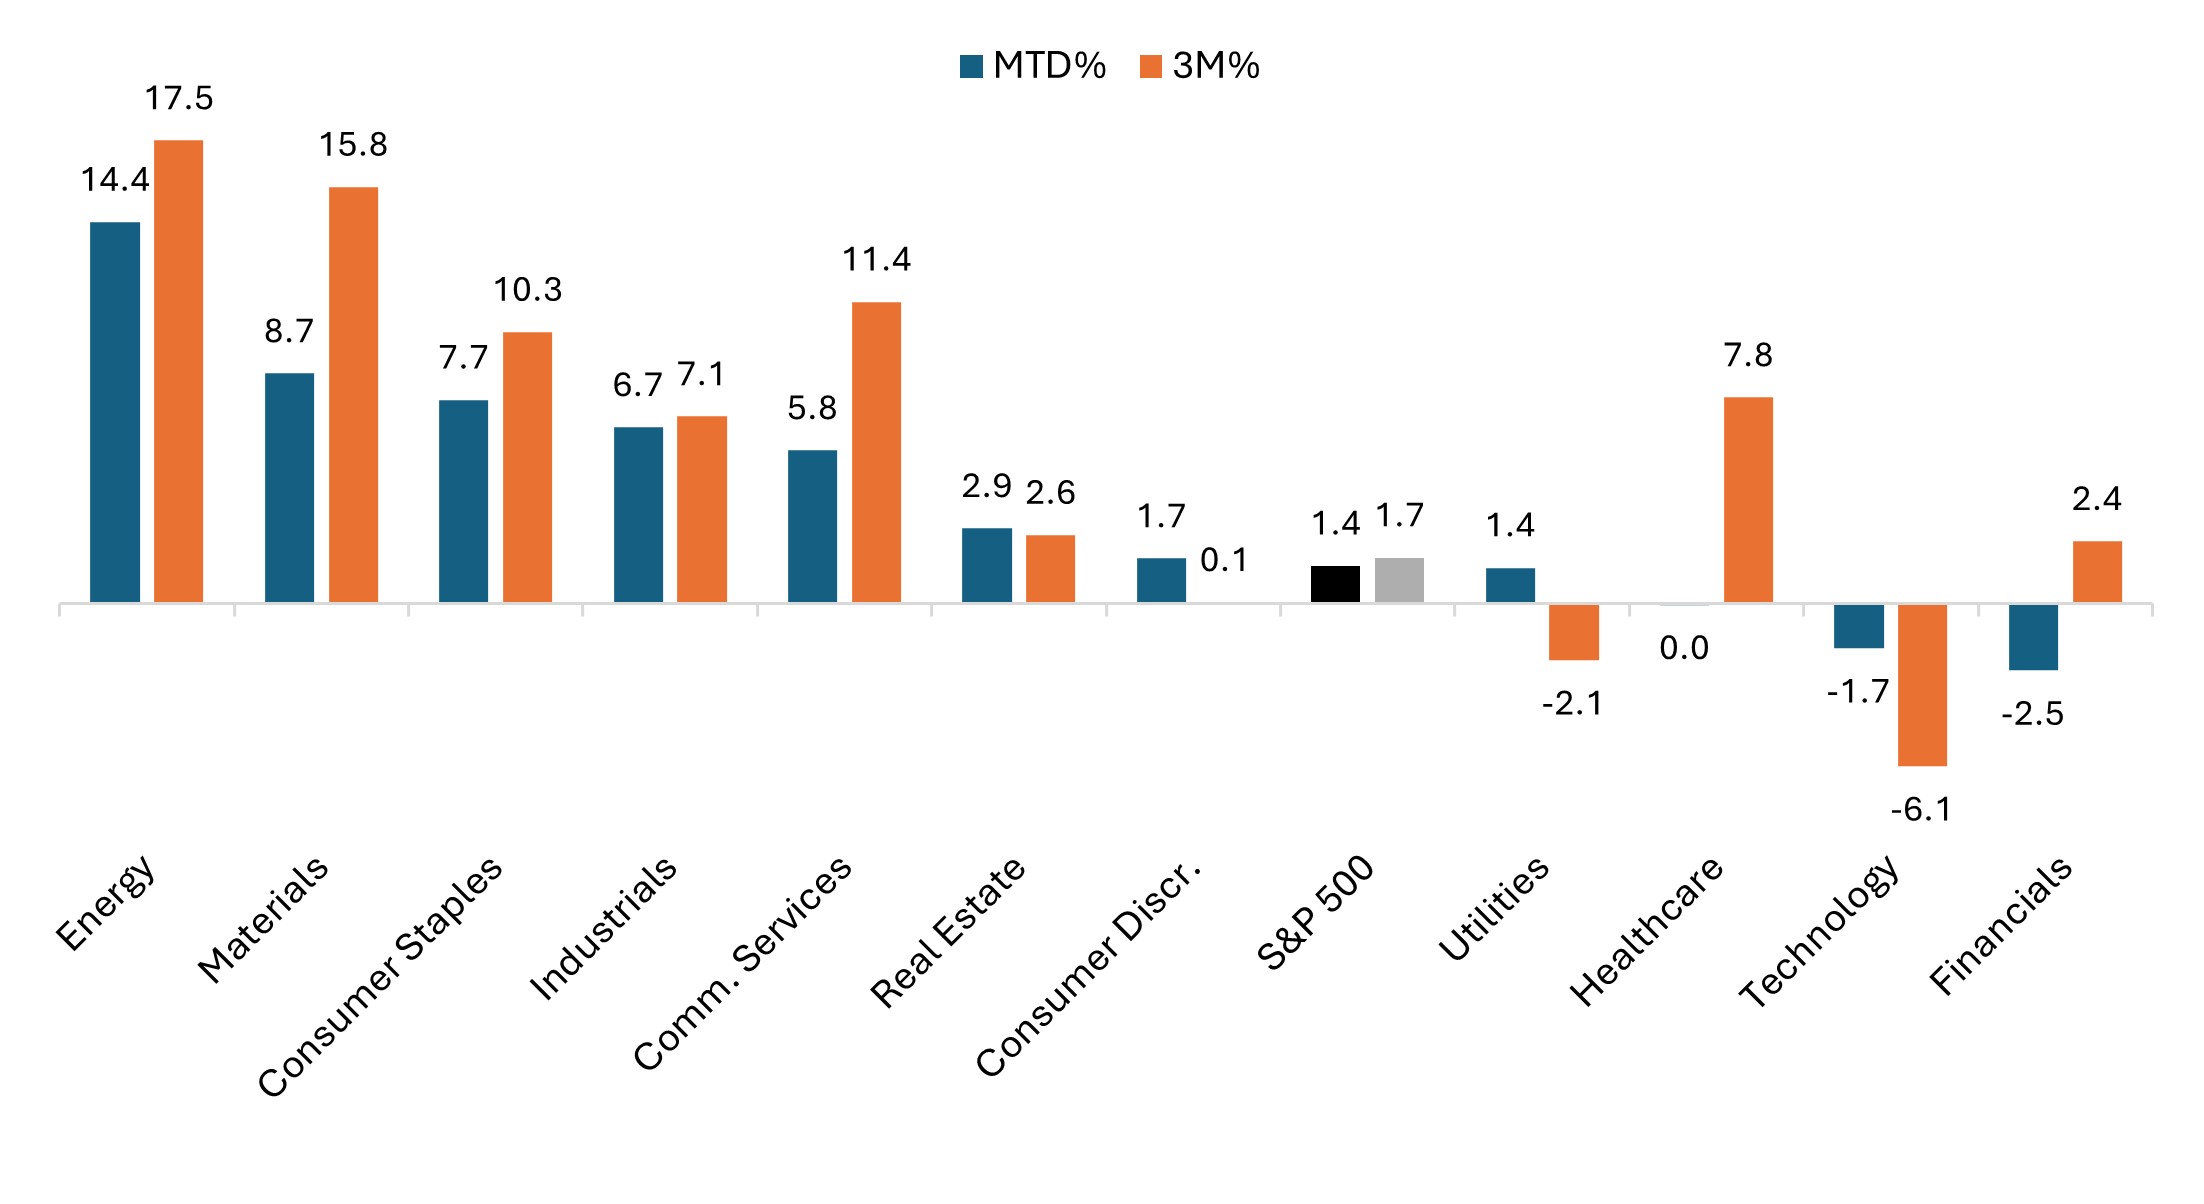 Source: Bloomberg, as of 31 January 2026.
Fed independence concerns and Powell succession developments overshadowed steady economic data:
- Concerns about Fed independence heated up after the Justice Department launched a criminal investigation into Chair Powell related to federal building renovations. Global central bankers, including those at the ECB, Bank of England, and Bank of Canada, issued statements of solidarity with Powell and the Fed.
- After three rate cuts at the end of last year, the Fed held rates steady at the January Federal Open Market Committee meeting. The pause was widely expected, with markets continuing to price in roughly 50 basis points (bps) of easing this year.
- President Trump’s January 30 nomination of Kevin Warsh for Fed Chair sparked the U.S. dollar’s biggest rally since May and a sharp selloff in precious metals. Warsh, seen as less supportive of deep rate cuts and more hawkish on inflation, will face Senate confirmation in the coming months.
- Labor market readings showed signs of stabilization. U.S. nonfarm payrolls showed a 50,000 gain for December, while the unemployment rate ticked down to 4.4% from 4.5%.
- The Consumer Price Index (CPI) for December came in at 2.7% year over year, matching November’s pace.
Europe
Eurozone equities delivered solid gains and outperformed U.S. markets (despite some pockets of softness), reflecting steady macro data and well-received corporate results. The MSCI Europe ex UK Index rose 4.3% in U.S. dollar terms and 3.1% in euro. Germany’s DAX and France’s CAC were relative laggards, with the benchmarks both slightly lower in euro terms.
- Eurozone GDP growth held at 0.3% quarter on quarter in Q4 according to Eurostat’s flash estimate, exceeding expectations, with consumption and investment offsetting weaker exports.
- Inflation pressures eased, with Eurozone CPI falling to 1.9% in December, marking the first reading below the ECB’s 2% target since May.
- Business activity showed resilience, as the flash Eurozone Composite Purchasing Managers’ Index (PMI) held at 51.5 in January, matching the prior month’s reading.
- Germany posted incremental signs of stabilization. The economy grew 0.2% in 2025 after two years of recession, while Q4 growth of 0.2% exceeded forecasts. Industrial production rose unexpectedly in November, though exports fell.
- Political uncertainty persisted in France, where Prime Minister Lecornu survived two no‑confidence votes as the government’s 2026 budget saga extended into February.
UK equities delivered strong gains in January, supported by improving business activity and signs of firmer growth momentum. The MSCI United Kingdom Index and FTSE All‑Share Index each rose 5.0% in U.S. dollar terms and 3.1% in sterling.
- UK GDP showed a stronger‑than‑expected rebound, with November output rising 0.3% month on month, beating the 0.1% consensus and reversing October’s 0.1% contraction.
- Business activity strengthened as the January flash UK Composite PMI rose to 53.9, the highest level since April 2024, suggesting a solid expansion across both manufacturing and services.
- Inflation edged higher, with December CPI rising to 3.4% from 3.2% in November, though economists broadly viewed the uptick as temporary.
- While these factors solidified expectations for the Bank of England to hold rates steady in February, the market continues to price in one to two rate cuts later this year.
European equities put in solid performance (even stronger in U.S. dollar terms)
Germany and France lagged in January, while equities across the broader Euro area and United Kingdom delivered strong returns to start 2026.
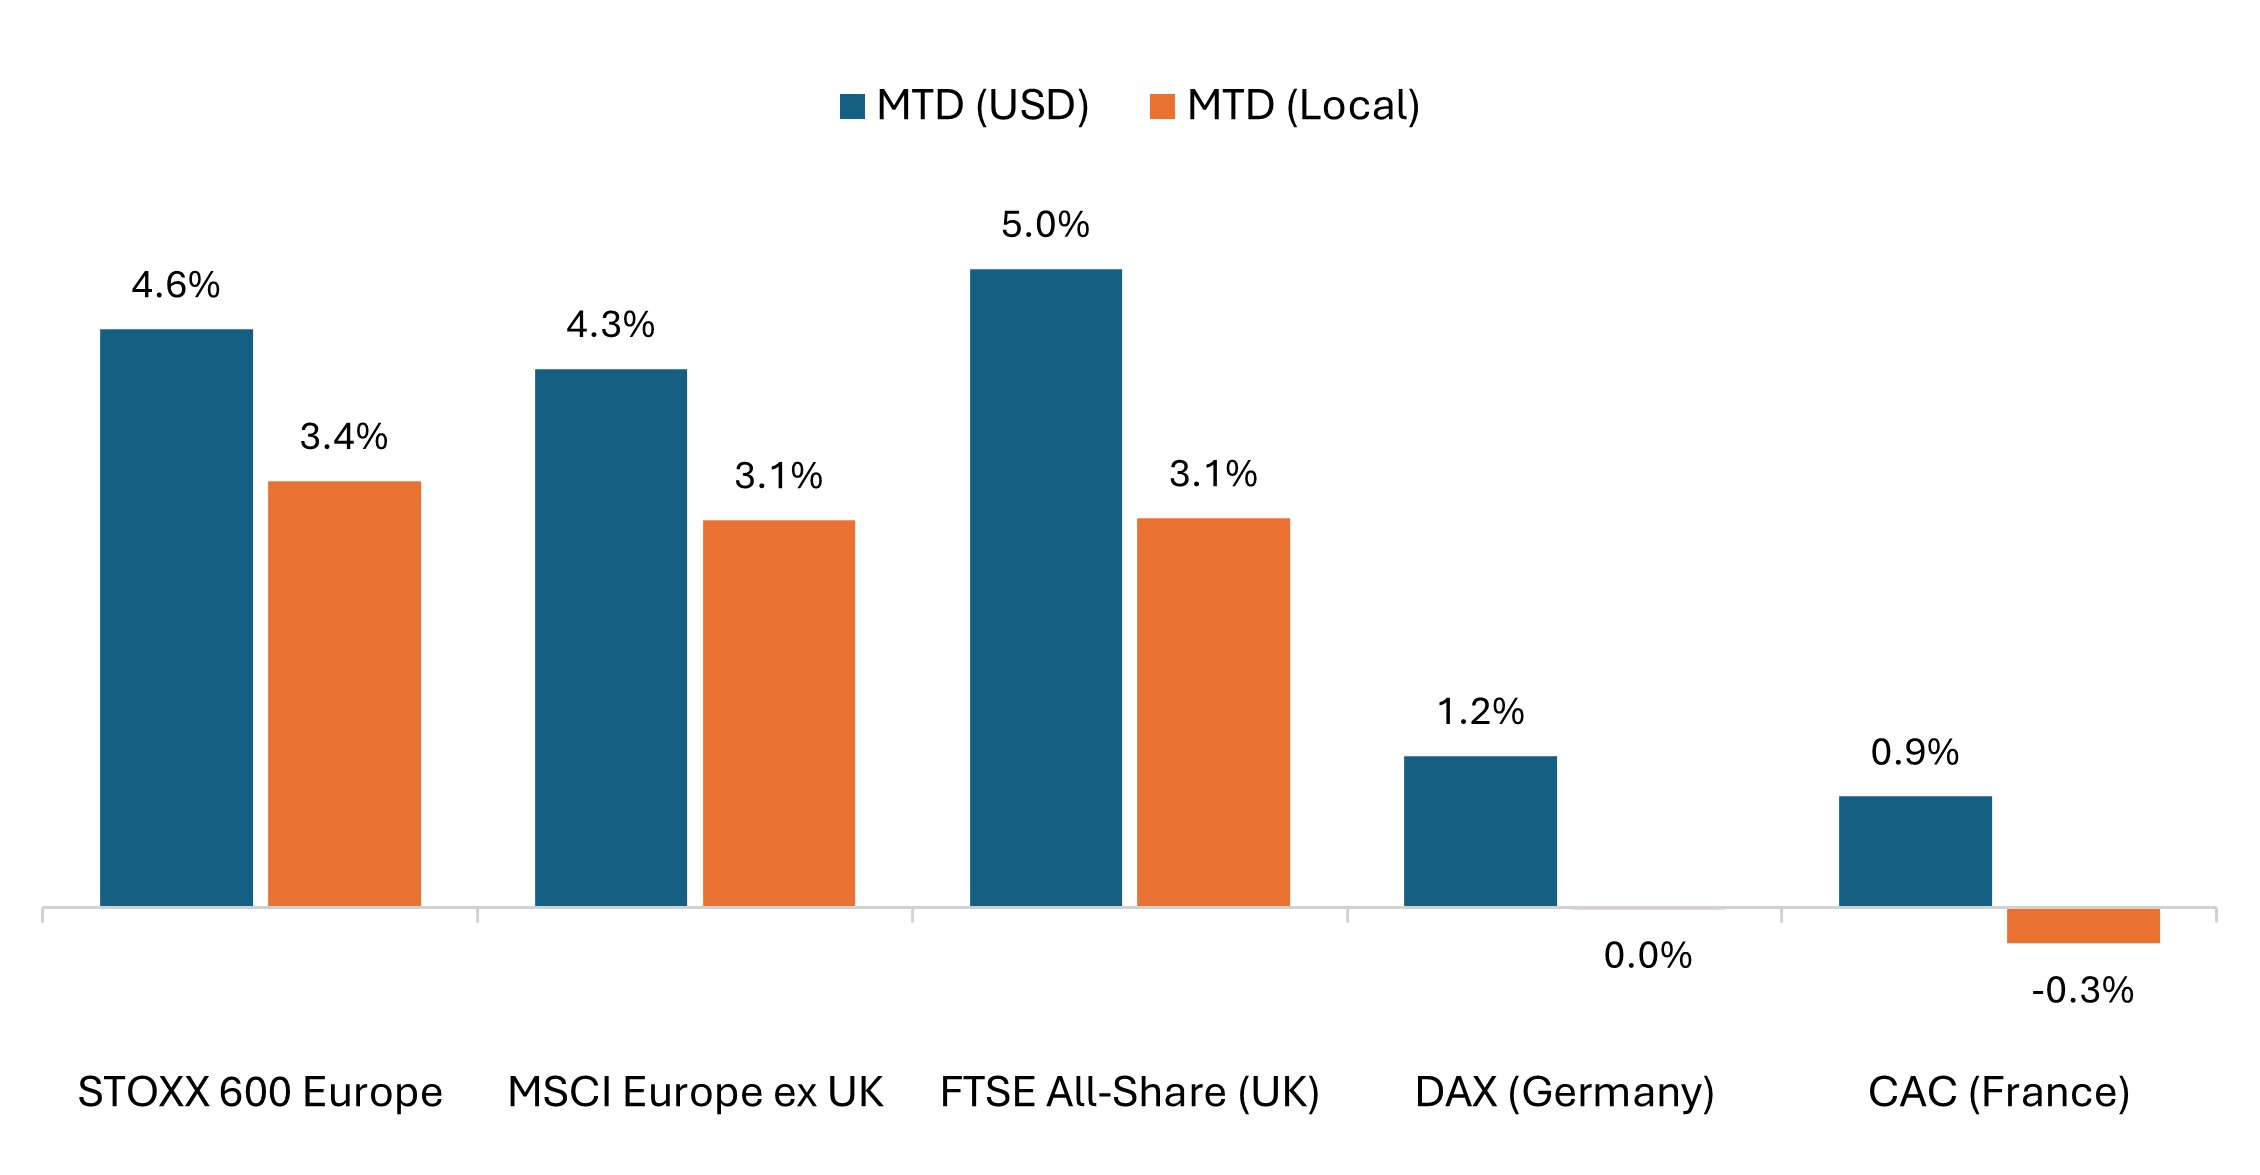
Source: Bloomberg, data from 31 December 2025 to 31 January 2026.
Across the STOXX 600 – comprising companies from 17 countries across developed Europe including the UK – most sub-industries posted monthly gains, with the strongest performance from commodity-linked sectors.
- Basic Resources (+12.7% in euro terms) led amid a continued rally in precious metals and copper, while Energy (+9.3) and Utilities (+8.0%) outperformed, driven by a surge in crude prices and strength in renewable energy names, respectively.
- Industrials (+6.1%) and Banks (+5.5%) continued their strong recent performance, while Technology (+5.3%) got a boost from strong semiconductor demand.
- Conversely, Consumer (-7.5%), Media (-5.4%), Insurance (-4.7%), Auto & Parts (-4.7%), and Travel & Leisure (-3.4%) all posted sizeable monthly declines amid a mix of earnings disappointments and margin pressure concerns.
Asia Pacific
Japanese equities posted strong gains in January, fueled in part by investor optimism ahead of the pending general election and buoyed by continued strength in semiconductors. Meanwhile, fiscal dynamics kept the yen and government bond yields volatile. The TOPIX gained 4.6% in yen terms and 5.9% in U.S. dollars, while the Nikkei 225 rose 5.9% in local terms and 7.2% in U.S. dollars.
- Prime Minister Takaichi dissolved parliament and called a snap election for February 8, prompting a rally in domestic equities and a rise in long‑dated Japanese government bond (JGB) yields.
- The Bank of Japan (BoJ) kept its policy rate unchanged at 0.75%, maintaining its highest policy setting in 30 years while signaling that additional rate hikes remained.
Asia Pacific ex Japan rallied in January, supported by a powerful rally in technology and semiconductor names. The MSCI AC Asia Pacific ex Japan Index rose 8.0% in U.S. dollar terms, with performance further lifted by currency strength in several markets. Strength was notable in Korea and Taiwan, up 28.1% and 11.2%, respectively, in U.S. dollar terms. Australia’s ASX 200 gained 6.4% in U.S. dollar terms but rose a more modest 1.8% in AUD. The Australian dollar strengthened against global currencies amid firmer economic data and increased expectations that the Reserve Bank of Australia (RBA) could hike rates as early as February. The China MSCI Index rose 4.7% in January, recovering from December’s decline. China Q4 GDP slowed to 4.5% year over year, the weakest pace in nearly three years, though exports remained resilient, with China posting a record $1.2 trillion annual trade surplus.
Emerging Markets
Emerging market equities rallied sharply in January, delivering their strongest monthly gain since 2022. The MSCI Emerging Markets Index rose 8.9% in U.S. dollar terms, supported by powerful semiconductor‑driven performance in Asia and stronger commodity prices across several Latin American markets.
- South Korea remained a standout, with the Kospi breaking above 5,000 and surpassing Germany’s equity market capitalization.
- Latin America posted broad gains, with Brazil rising 16.8% in U.S. dollar terms, while Colombia gained 27.3%. Across EMEA, standouts included South Africa and Turkey, up 8.3% and 23.7%, respectively.
- India faced mixed signals, as benign inflation created room for the RBI to consider a February rate cut, even as the rupee fell to a record low amid persistent investor outflows. The MSCI India Index fell 5.1% in U.S. dollar terms.
Fixed Income
Global government bonds delivered mixed returns in January as yields rose across the long end of the curve in most regions. The backdrop was volatile, driven by heightened geopolitical tensions and a sharp move in Japanese yields that reverberated through global markets. Spread sectors fared better amid largely positive risk sentiment and strong support for corporate issuance to start the year.
- The Bloomberg Global Treasury Index ended the month essentially unchanged in U.S. dollar terms.
- The U.S. Treasury curve steepened modestly, with longer-dated yields rising more than the shorted-dated maturities. The 10-year Treasury yield rose 8 bps to 4.26%, breaking above 4.2% for the first time since September and briefly topping 4.3% before retracing.
U.S. Treasury yield curve (month-on-month change)
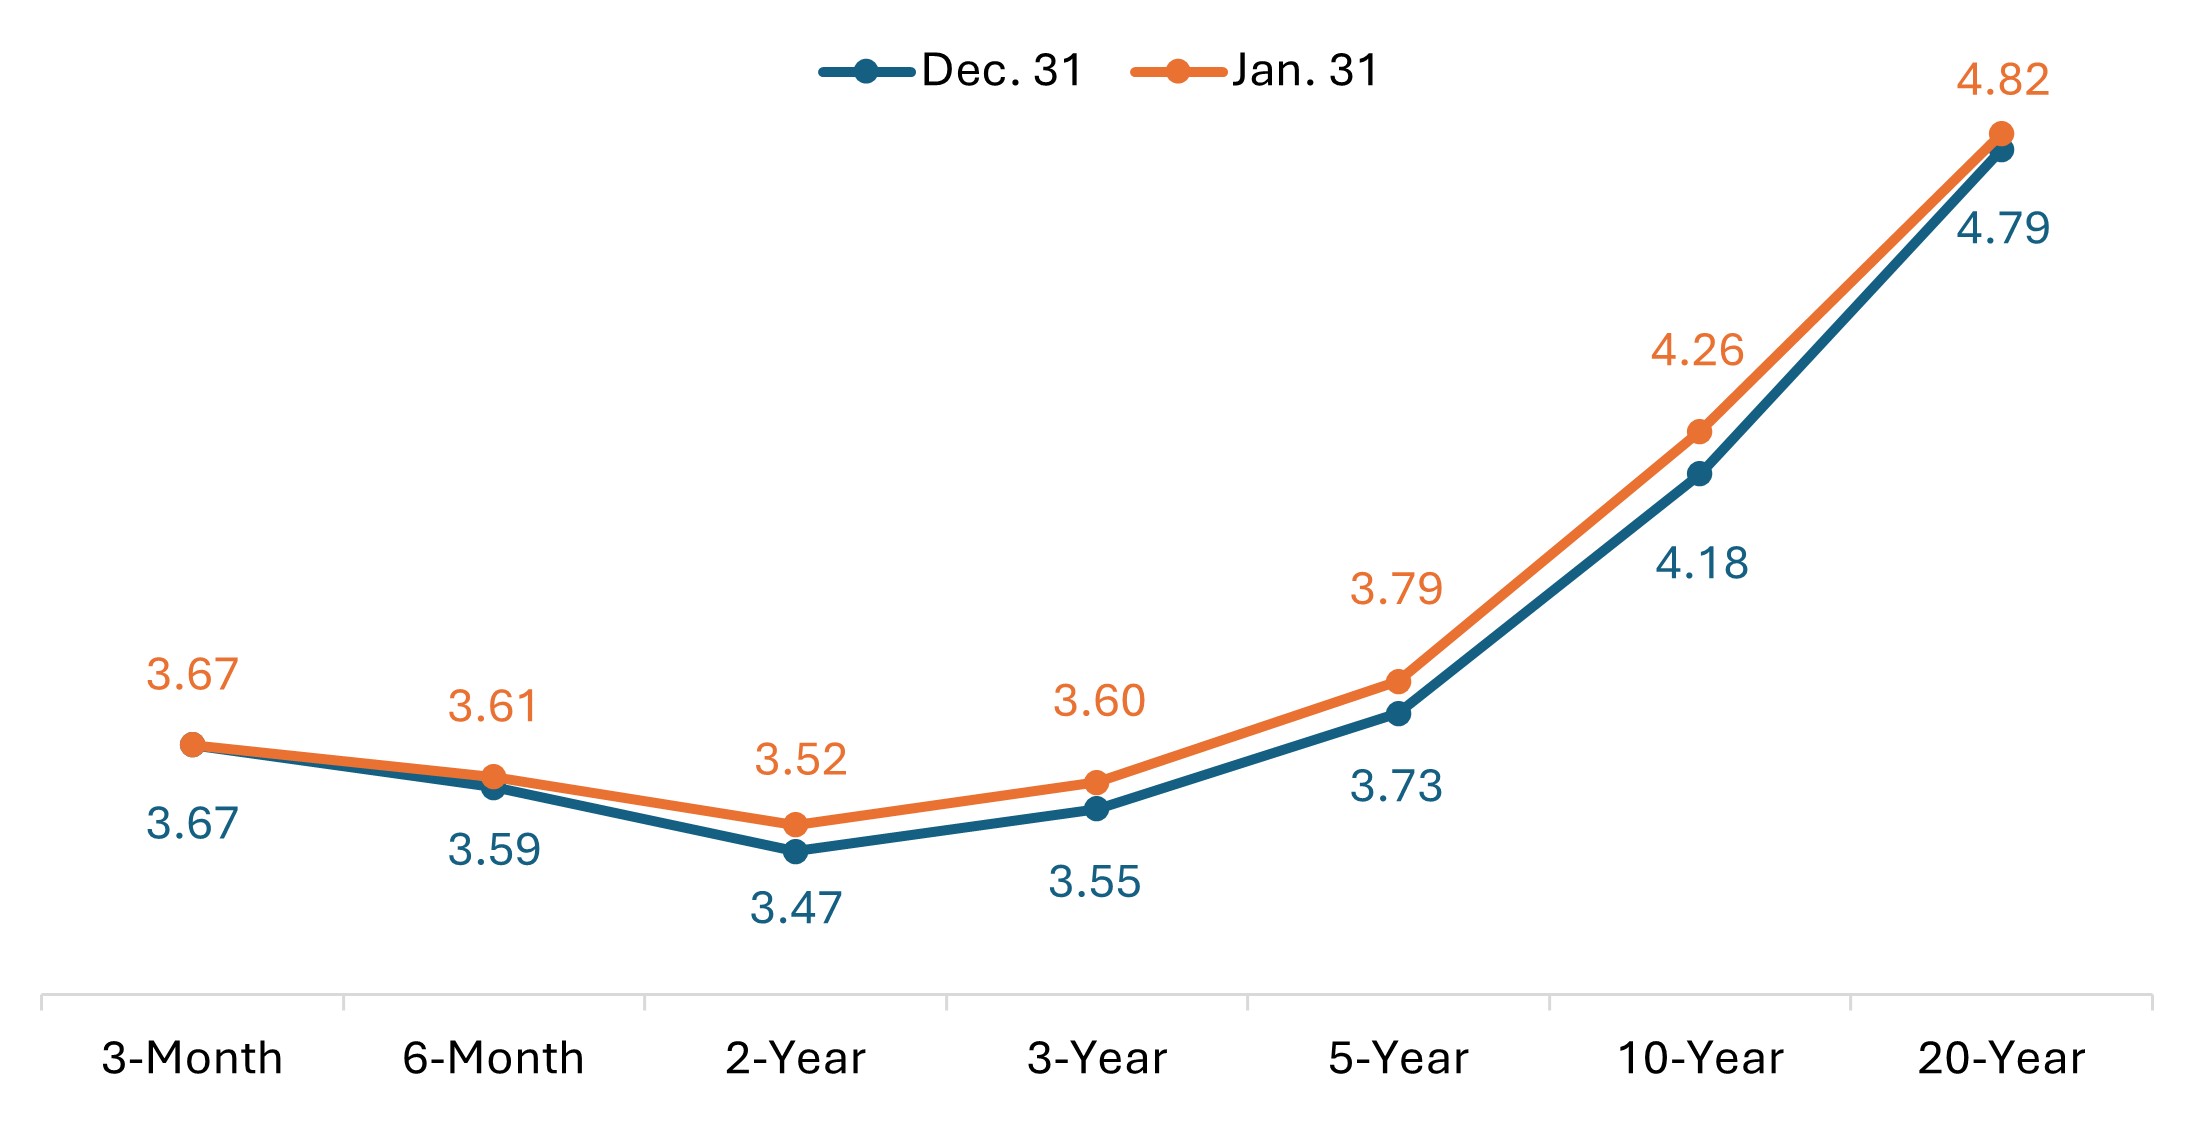
Source: Bloomberg, U.S. Treasury.
- In Europe, German government bonds outperformed. The 10-year bund yield edged down 1 bp in January after hitting a two-year high in December.
- In the UK, 10-year Gilt yields rose a modest 4 bps. Following its December rate cut, the Bank of England is widely expected to stand pat in February.
- Japanese government bonds came under pressure as long-dated yields continued higher. The 10-year JGB yield rose 18 bps to end the month at 2.25%. Fiscal concerns intensified after the government proposed a temporary suspension of the sales tax on food, pushing 40‑year JGB yields above 4% as investors reassessed long‑term issuance needs.
Spread sectors started the year on a strong note as option-adjusted spreads (OAS) narrowed across investment-grade and high-yield benchmarks, as well as for asset-backed and mortgage-backed securities (MBS). U.S. investment grade corporate spreads tightened toward multi‑decade lows. MBS were also in focus after the White House directed large‑scale MBS purchases totaling $200 billion.
- The Bloomberg Global Aggregate Corporate Index rose by 0.9% in U.S. dollar terms, while the Bloomberg Global High Yield Index gained 1.0%.
- Global investment-grade spreads narrowed by approximately 5 bps, while high-yield spreads narrowed by roughly 8 bps.
- U.S. investment grade corporate spreads tightened toward multi‑decade lows, narrowing by roughly 5 bps.
- In securitized markets, asset-backed securities (ABS) and MBS spreads narrowed by approximately 6 bps.
Central Bank Watch
January was a relatively quiet month for monetary policy, with major central banks largely in “wait‑and‑see” mode. Both the Federal Reserve and Bank of Japan left rates unchanged, as expected, while President Trump’s January 30 nomination of former Fed Governor Kevin Warsh as the next Fed Chair drew most of the market’s attention. The policy calendar gets busier in early February, starting with the Reserve Bank of Australia – where odds of a hike have increased – followed by decisions from the Bank of England and the ECB, with both expected to hold rates steady.
- Bank of Korea (Jan. 15): Kept base rate at 2.50% while signaling an end to its easing cycle, prioritizing FX stability as the won hovered near 16‑year lows. The BOK removed language about leaving room for further rate cuts, a notable shift from previous statements.
- People’s Bank of China (Jan. 20): Kept the one‑year and five‑year Loan Prime Rates unchanged at 3.00% and 3.50%, respectively. Despite soft economic data, policymakers continued to favor targeted liquidity measures over benchmark rate cuts, though economists see scope for easing later in 2026.
- Norges Bank – Norway (Jan. 22): Maintained policy rate at 4.00%, as expected. The Bank acknowledged ongoing uncertainty but signaled that rate cuts could come later in the year if economic conditions unfold as expected.
- Bank of Japan (Jan. 23): Left policy rate at 0.75% in an 8-1 vote, with one member favoring a hike. Policymakers upgraded their growth and inflation forecasts and signaled that further tightening remains on the table. The BoJ emphasized patience as it assesses the impact of December’s rate increase and awaits the outcome of the February 8 snap election.
- Bank of Canada (Jan. 28): Held policy rate at 2.25% for a second straight meeting, noting the outlook is highly vulnerable to unpredictable U.S. trade policies, particularly ahead of the Canada-U.S.-Mexico Agreement (CUSMA) review in July.
- Federal Reserve (Jan. 28): Held the target range at 3.50%-3.75%, as expected, after three consecutive rate cuts at the end of 2025. Officials signaled comfort adopting a patient stance with the labor market showing early signs of stabilization, reducing the urgency for further easing. Economists noted the shift suggests December’s rate cut was likely the last of Jerome Powell’s term as Fed Chair, which ends in May.
- Brazil (Jan. 28): Kept the Selic rate at 15.00%, marking a fifth consecutive hold as the Bank judged that a prolonged period of restrictive policy is still needed to guide inflation toward target.
- Riksbank – Sweden (Jan. 29): Left policy rate unchanged at 1.75% for a third straight meeting and signaled no change is likely for the rest of 2026.
Key events on tap in February
- Feb. 2 – Global Manufacturing PMIs (January)
- Feb. 3 – Reserve Bank of Australia (RBA) Rate Decision
- Feb. 4 – Global Services and Composite PMIs (January)
- Feb. 4 – Eurozone Consumer Price Index (January, preliminary)
- Feb. 5 – Bank of England (BoE) Rate Decision
- Feb. 5 – European Central Bank (ECB) Rate Decision
- Feb. 6 – U.S. Nonfarm Payrolls, Unemployment Rate (January)
- Feb. 8 – Japan general election
- Feb. 11 – U.S. Consumer Price Index (January)
- Feb. 15 – 23 – Lunar New Year (China and various Asian markets closed)
- Feb. 17 – UK Unemployment Rate (September to December)
- Feb. 18 – Australia Employment, Unemployment Rate (January)
- Feb. 18 – UK Consumer Price Index (January)
- Feb. 22 – People’s Bank of China (PBOC) Rate Decision
- Feb. 24 – Australia Consumer Price Index (January)
- Feb. 25 – Eurozone Consumer Price Index (January, final)
Market Performance
Total returns (%), periods ended January 31, 2026
IMPORTANT INFORMATION
Equity securities are subject to risks including market risk. Returns will fluctuate in response to issuer, political and economic developments.
Fixed income securities are subject to interest rate, inflation, credit and default risk. As interest rates rise, bond prices usually fall, and vice versa. High-yield bonds, or “junk” bonds, involve a greater risk of default and price volatility. Foreign securities, including sovereign debt, are subject to currency fluctuations, political and economic uncertainty and increased volatility and lower liquidity, all of which are magnified in emerging markets.
Securitized products, such as mortgage- and asset-backed securities, are more sensitive to interest rate changes, have extension and prepayment risk, and are subject to more credit, valuation and liquidity risk than other fixed-income securities.
Bloomberg Asian-Pacific Japan Government-Related Index is a fixed-rate, investment grade, JPY-denominated benchmark that includes debt from government-related issuers.
Bloomberg Germany Government All Bonds Index measures the performance of German government bonds (Bunds) issued by the German government.
Bloomberg Global Aggregate – Corporate Index is a flagship measure of global investment grade, fixed-rate corporate debt. This multi-currency benchmark includes bonds from developed and emerging markets issuers.
Bloomberg Global High Yield Index is a multi-currency flagship measure of the global high yield debt market. The index represents the union of the US High Yield, the Pan-European High Yield, and Emerging Markets (EM) Hard Currency High Yield Indices.
Bloomberg Global Treasury Index tracks fixed-rate, local currency government debt of investment grade countries, including both developed and emerging markets.
Bloomberg Sterling Aggregate: Government Index measures the performance of UK government bonds (Gilts) within the broader Bloomberg Sterling Aggregate Index, which covers the investment-grade, fixed-rate, sterling-denominated bond market.
Bloomberg US Corporate Bond Index measures the investment grade, fixed-rate, taxable corporate bond market. It includes USD-denominated securities from US and non-US issuers.
Bloomberg US Corporate High Yield Bond Index measures the USD-denominated, high yield, fixed-rate corporate bond market. Bonds from issuers with an emerging markets country of risk, based on Bloomberg EM country definition, are excluded.
Bloomberg US Securitized: MBS, ABS, and CMBS Index tracks all USD-denominated, investment grade, securitized issues within the Bloomberg US Aggregate Index.
Bloomberg US Treasury Index measures U.S. dollar-denominated, fixed-rate, nominal debt issued by the U.S. Treasury.
FTSE All-Share Index reflects the equity market performance of the United Kingdom. The index includes nearly all eligible companies on the London Stock Exchange, covering large, mid, and small-cap stocks.
ICE U.S. Dollar Index is a benchmark measuring the U.S. dollar’s value against a basket of six major world currencies (Euro, Yen, Pound Sterling, Canadian Dollar, Swedish Krona, Swiss Franc).
MSCI AC Asia Pacific ex Japan Index reflects the equity market performance of the Asia Pacific region, excluding Japan, covering both developed and emerging markets.
The MSCI ACWI ex USA Index captures large- and mid-cap representation across 22 of 23 developed markets (excluding the US) and 24 emerging markets countries.
MSCI Emerging Markets Index reflects the equity market performance of emerging markets.
MSCI Europe Index reflects the equity market performance of large and mid-sized companies listed in developed markets in Europe.
MSCI Europe ex UK Index reflects the equity market performance of large and mid-sized companies listed in developed markets in Europe excluding the United Kingdom.
MSCI United Kingdom Index reflects the equity market performance of large and mid-sized companies listed in the UK market.
MSCI World Index captures large- and mid-cap representation across 22 of 23 developed markets countries, excluding the United States.
MSCI World ex USA Index reflects the equity market performance of global developed markets excluding the United States.
NASDAQ Composite Stock Index: National Association of Securities Dealers Automated Quotation System (NASDAQ) is a nationwide computerized quotation system for over 5,500 over-the-counter stocks. The index is compiled of more than 4,800 stocks that are traded via this system.
Nikkei 225 Index (also known as Nikkei Stock Average): A measure of Japanese equity market performance. The index includes 225 of the largest companies listed on the Tokyo Stock Exchange.
Russell 1000® Growth Index reflects the performance of U.S. large-cap equities with higher price-to-book ratios and higher forecasted growth values.
Russell 1000® Value Index reflects the performance of U.S. large-cap equities with lower price-to-book ratios and lower forecasted growth values.
Russell 2000® Index reflects the performance of U.S. small-cap equities.
Russell 2500™ Growth Index reflects the performance of U.S. small to mid-cap equities with higher price-to-book ratios and higher forecasted growth values.
Russell 2500™ Value Index reflects the performance of U.S. small to mid-cap equities with lower price-to-book ratios and lower forecasted growth values.
S&P 500® Index reflects U.S. large-cap equity performance and represents broad U.S. equity market performance.
S&P 500® Equal Weight Index (EWI) is the equal-weight version of the S&P 500. The index includes the same constituents as the capitalization weighted index, but each company is allocated a fixed weight – or 0.2% of the index total at each quarterly rebalance.
S&P/ASX 200 Index reflects the performance of the 200 largest, most liquid companies listed on the Australian Securities Exchange (ASX).
STOXX Europe 600 Index: An index of the 600 largest listed stocks in the European equity market, comprising 17 countries and 11 industries
TOPIX: A capitalization-weighted index of all the companies listed on the First Section of the Tokyo Stock Exchange and is widely regarded as a broad benchmark for Japanese stock prices.
10-year bond: A bond that is set to mature (repay the principal value) in 10 years.
10-Year Treasury Yield is the interest rate on U.S. Treasury bonds that will mature 10 years from the date of purchase.
Agency Mortgage-backed Securities (Agency MBS): A type of asset-backed security that is specifically secured by a collection of mortgages.
Asset-backed Securities (ABS): These are financial instruments that are backed by a pool of assets—typically those that generate a cash flow from debt, such as loans, leases, credit card balances, or receivables.
Basis point: One basis point (bp) equals 1/100 of a percentage point, 1bp = 0.01%.
Bund yield: Bund yields are viewed as benchmark yield indicators for European government bonds; those with a 10-year maturity are considered to be the German equivalent of U.S. Treasury bonds.
Commercial Mortgage-backed Securities (CMBS): A type of mortgage-backed security that is secured by the loan on commercial real estate properties rather than residential real estate.
Consumer Price Index (CPI): A measure that examines the price change of a basket of consumer goods and services over time. It is used to estimate inflation.
Credit spread: The difference in yield between securities with similar maturity but different credit quality. Widening spreads generally indicate deteriorating creditworthiness of corporate borrowers, and narrowing indicate improving.
Curve/Yield curve: A yield curve plots the yields (interest rate) of bonds with equal credit quality but differing maturity dates. Typically bonds with longer maturities have higher yields.
The Federal Open Market Committee (FOMC) is the body of the Federal Reserve System that sets national monetary policy.
Fiscal policy: Describes government policy relating to setting tax rates and spending levels. Fiscal policy is separate from monetary policy, which is typically set by a central bank.
Gilt yield: Gilt yields are viewed as benchmark yield indicators for United Kingdom government bonds; those with a 10-year maturity are considered to be the UK equivalent of U.S. Treasury bonds.
Hawkish policy aims to curb inflation and slow down growth in the economy by raising interest rates and reducing the supply of money.
High yield bond: Also known as a sub-investment grade bond, or ‘junk’ bond. These bonds usually carry a higher risk of the issuer defaulting on their payments, so they are typically issued with a higher interest rate (coupon) to compensate for the additional risk.
Inflation: The rate at which the prices of goods and services are rising in an economy. The Consumer Price Index (CPI) and Retail Price Index (RPI) are two common measures.
Investment grade bond: A bond typically issued by governments or companies perceived to have a relatively low risk of defaulting on their payments, reflected in the higher rating given to them by credit ratings agencies.
JGB yield: JGB yields are viewed as benchmark yield indicators for Japanese government bonds; those with a 10-year maturity are considered to be the Japanese equivalent of U.S. Treasury bonds.
Monetary policy: The policies of a central bank, aimed at influencing the level of inflation and growth in an economy. Monetary policy tools include setting interest rates and controlling the supply of money. Dovish policy aims to stimulate economic growth by lowering interest rates and increasing the money supply.
Option-Adjusted Spread (OAS) measures the spread between a fixed-income security rate and the risk-free rate of return, which is adjusted to take into account an embedded option.
Securitization: The process in which certain types of assets are pooled so that they can be repackaged into interest-bearing securities. The interest and principal payments from the assets are passed through to the purchasers of the securities.
U.S. Treasury securities are direct debt obligations issued by the U.S. Government. Treasury Bills and U.S. Government Bonds are guaranteed by the full faith and credit of the U.S. government, are generally considered to be free of credit risk.
Volatility measures risk using the dispersion of returns for a given investment.
Quantitative Easing (QE) is a government monetary policy occasionally used to increase the money supply by buying government securities or other securities from the market.
Yield: The level of income on a security over a set period, typically expressed as a percentage rate. For equities, a common measure is the dividend yield, which divides recent dividend payments for each share by the share price. For a bond, this is calculated as the coupon payment divided by the current bond price.
These are the views of the author at the time of publication and may differ from the views of other individuals/teams at Janus Henderson Investors. References made to individual securities do not constitute a recommendation to buy, sell or hold any security, investment strategy or market sector, and should not be assumed to be profitable. Janus Henderson Investors, its affiliated advisor, or its employees, may have a position in the securities mentioned.
Past performance does not predict future returns. The value of an investment and the income from it can fall as well as rise and you may not get back the amount originally invested.
The information in this article does not qualify as an investment recommendation.
There is no guarantee that past trends will continue, or forecasts will be realised.
Marketing Communication.