Asia has long been associated with rapid economic growth, fast‑moving technology trends and emerging consumer demand. While those forces remain powerful, something important has shifted beneath the surface. Across the region, companies are generating stronger cashflows, improving balance sheets and returning more capital to shareholders.
This structural shift is reshaping Asia’s investment profile. Rising dividends, shareholder‑friendly reform and maturing business models are turning the region into an increasingly compelling source of income, without sacrificing long‑term growth.
So what’s really changing beneath the surface? Below, we highlight three key developments that help explain why Asia’s income story looks stronger today.
Several long‑term developments are working together to support more dependable income from Asian equities. Companies across the region are operating with stronger balance sheets and more disciplined capital allocation. Rather than prioritising expansion at any cost, management teams are increasingly focused on sustainable profitability, cash generation and shareholder returns.
A key part of this shift is a clear change in payout behaviour. Dividend payout ratios – the proportion of profits companies pay out to shareholders – across many Asian markets are higher today than they were a decade ago. This reflects growing confidence in earnings durability, meaning profits are seen as more reliable and repeatable, and there is a more deliberate focus on returning cash to shareholders.
This combination of corporate maturity and policy support marks a meaningful change from Asia’s historical growth‑only narrative.
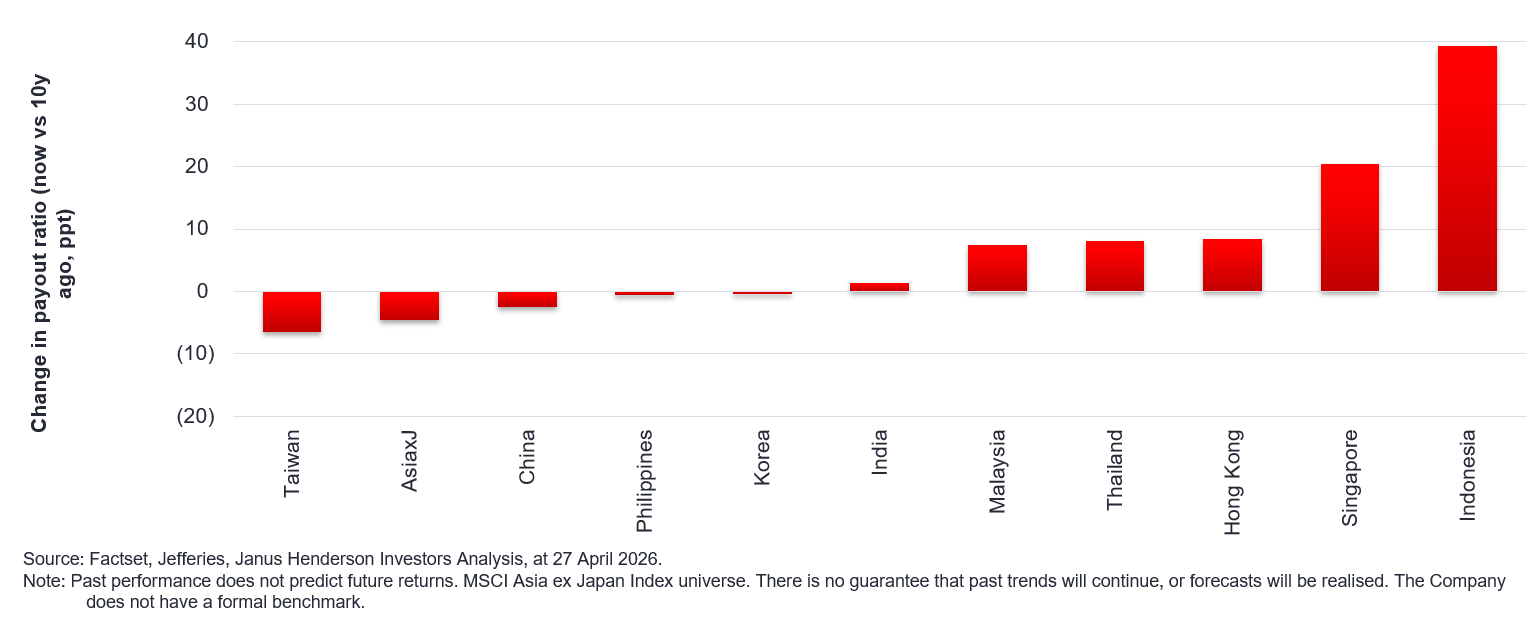
Dividend payout ratios have increased across many Asian markets over the past decade, signalling a structural shift toward higher and more consistent shareholder returns. With balance sheets in better shape, companies across the region have greater scope to support and grow dividends over time.
Long‑term data suggests they have been highly competitive.
Over the past 15 years, dividend growth across many Asian markets has matched – and in several cases exceeded – that seen in developed regions. Importantly, this growth has not been driven by a single country or sector. Instead, it reflects a broadening income base across technology, financials, infrastructure and industrial businesses.
Crucially for income investors, rising payout ratios across key Asian markets point to a deliberate shift toward returning more cash to shareholders. Combined with healthier balance sheets, this suggests that dividend growth in Asia is being supported by improving fundamentals, such as more reliable earnings, better cashflow and lower debt, rather than short‑term effects.
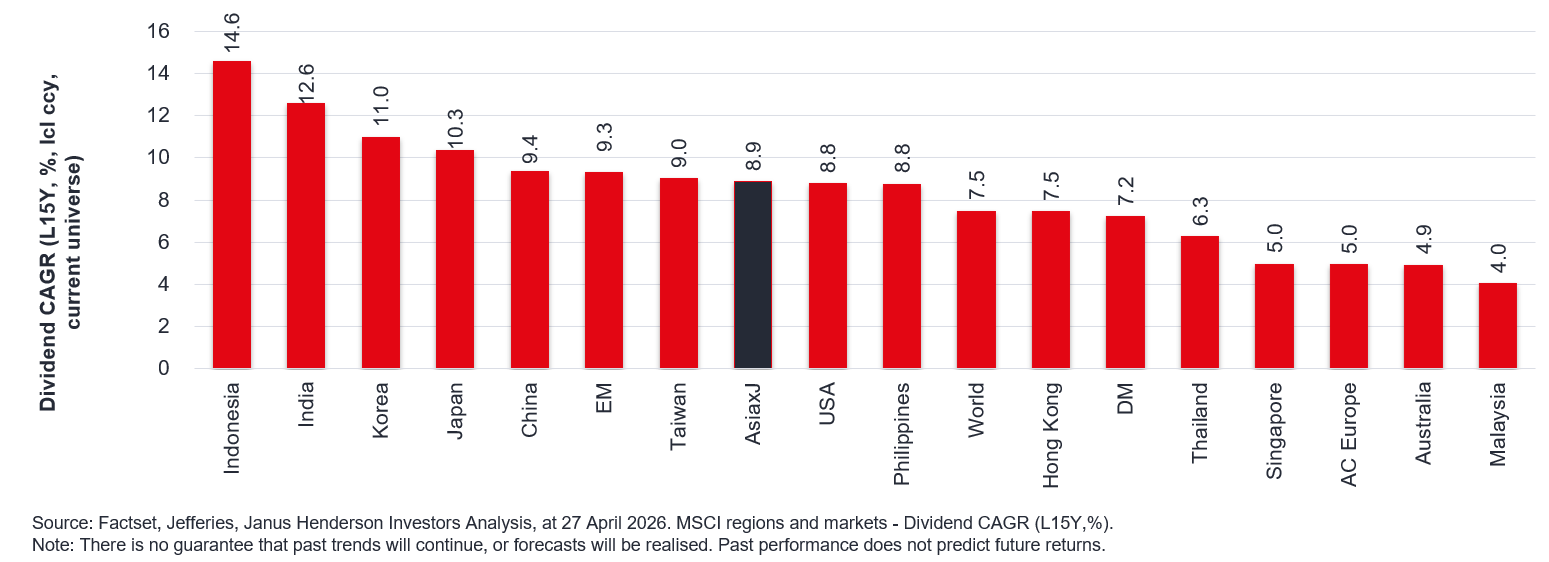
Many Asian markets have delivered strong dividend growth over the past 15 years. With balance sheets strengthening and payout ratios rising, companies across the region have greater capacity to continue growing dividends over time – reinforcing Asia’s case as a long‑term income opportunity.
One of the most important – and often overlooked – drivers of Asia’s income evolution is corporate reform, and its impact is increasingly visible in real‑world outcomes.
Across South Korea, China and Singapore, regulators are pushing companies to improve governance, narrow valuation discounts – where a company’s share price sits well below the value of its business – and increase shareholder distributions, such as dividends and share buybacks.
In South Korea, this has been reinforced by the government’s “Value‑Up” initiative, a reform programme designed to encourage companies to address long‑standing valuation gaps by paying higher dividends, buying back shares, and being clearer about how excess cash is returned to shareholders. Similar policy measures elsewhere are encouraging a more transparent and consistent approach to capital returns.
These reforms are particularly significant in sectors where cashflows have strengthened structurally. Many technology‑linked businesses in Asia have matured, generating substantial and recurring cashflows that now comfortably support dividends alongside growth. In parallel, rising investment in infrastructure and energy – fuelled by data centres, electrification and AI – is creating potential for stable, long‑duration cashflows well suited to dividend payments.
For income investors, these reforms increase the likelihood not just of higher dividends, but of positive dividend surprises as companies adopt more shareholder‑friendly policies.
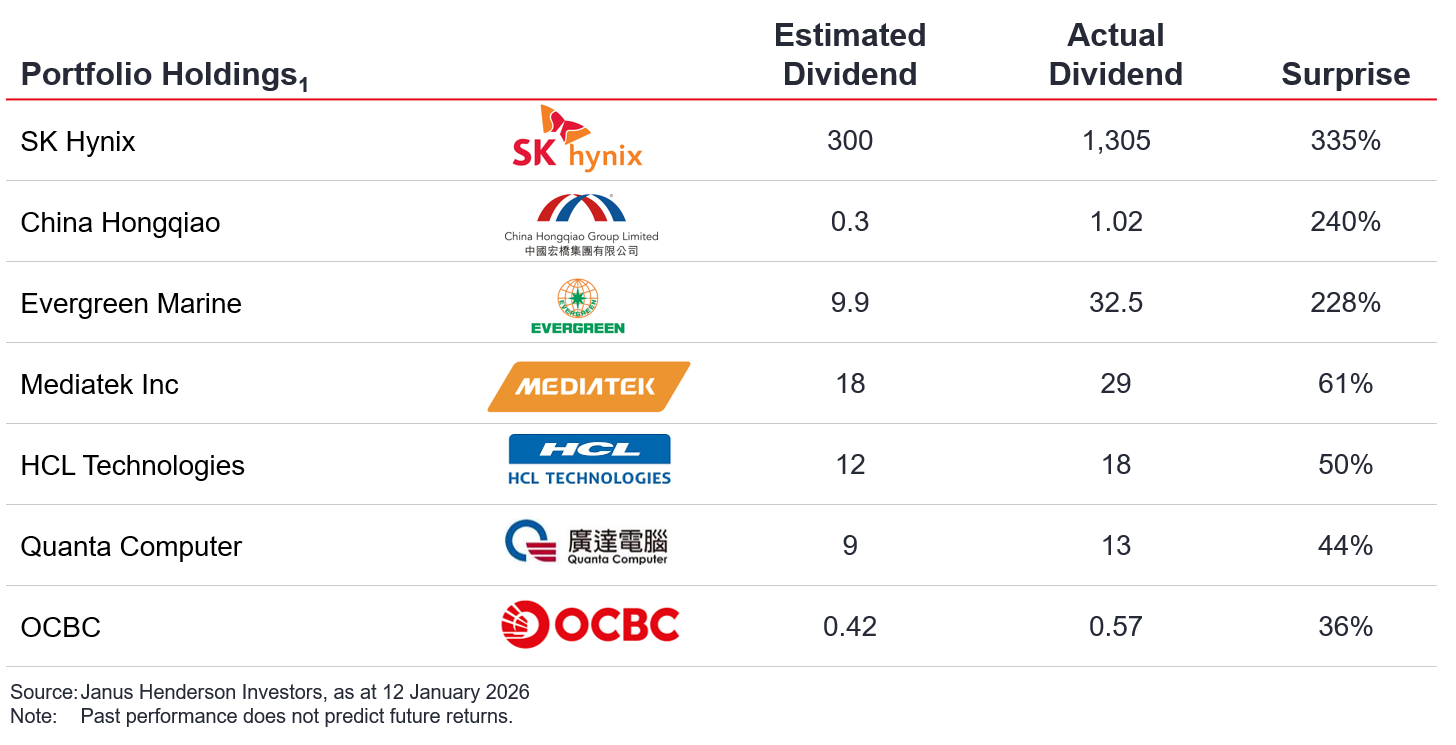
A range of Asian companies – including those exposed to technology supply chains and essential infrastructure – have delivered dividends materially above expectations. These outcomes underline how improvements in governance and capital discipline are translating into tangible income benefits for investors.
Henderson Far East Income (HFEL) aims to capture Asia’s evolving income story by balancing high income today with exposure to long‑term structural growth.
The portfolio draws income from a wide range of sources – including financials, infrastructure, technology enablers and companies benefiting from corporate reform – while taking care not to overpay for investments. This diversification reflects the belief that Asia’s income opportunity is broad‑based, evolving and supported by long‑term change rather than a single trend.
If you’d like to explore how this approach is reflected in practice, you can view the portfolio and learn more about HFEL’s investments here.
| Discrete year performance (%) |
Share price (total return) |
NAV (total return) |
| 31/03/2025 to 31/03/2026 |
28.6 |
25.7 |
| 31/03/2024 to 31/03/2025 |
7.6 |
1.2 |
| 31/03/2023 to 31/03/2024 |
-5.0 |
0.9 |
| 31/03/2022 to 31/03/2023 |
-3.9 |
-8.0 |
| 31/03/2021 to 31/03/2022 |
-2.4 |
2.6 |
All performance, cumulative growth and annual growth data is sourced from Morningstar.
Source: at 31/03/26. © 2026 Morningstar, Inc. All rights reserved. The information contained herein: (1) is proprietary to Morningstar and/or its content providers; (2) may not be copied or distributed; and (3) is not warranted to be accurate, complete, or timely. Neither Morningstar nor its content providers are responsible for any damages or losses arising from any use of this information. Past performance does not predict future returns.
Important information
- Chart 3: References made to individual securities do not constitute a recommendation to buy, sell or hold any security, investment strategy or market sector, and should not be assumed to be profitable. Janus Henderson Investors, its affiliated advisor, or its employees, may have a position in the securities mentioned. Actual dividend surprises calculated to announced dates. Use of third party names, marks or logos is purely for illustrative purposes and does not imply any association between any third party and Janus Henderson Investors, nor any endorsement or recommendation by or of any third party. Unless stated otherwise, trademarks are the exclusive property of their respective owners.
Portfolio holdings are subject to change without notice.
Henderson Far East Income Limited (the ‘Company’), is a Jersey domiciled closed-ended investment company (a ‘Fund’), with registered offices at IFC1, The Esplanade, St Helier, Jersey, JE1 4BP. The fund is regulated by the Jersey Financial Services Commission.
Not for onward distribution. Before investing in an investment trust referred to in this document, you should satisfy yourself as to its suitability and the risks involved, you may wish to consult a financial adviser. This is a marketing communication. Please refer to the AIFMD Disclosure document and Annual Report of the AIF before making any final investment decisions. Past performance does not predict future returns. The value of an investment and the income from it can fall as well as rise and you may not get back the amount originally invested. Tax assumptions and reliefs depend upon an investor’s particular circumstances and may change if those circumstances or the law change. Nothing in this document is intended to or should be construed as advice. This document is not a recommendation to sell or purchase any investment. It does not form part of any contract for the sale or purchase of any investment. We may record telephone calls for our mutual protection, to improve customer service and for regulatory record keeping purposes.
Issued in the UK by Janus Henderson Investors. Janus Henderson Investors is the name under which investment products and services are provided by Janus Henderson Investors International Limited (reg no. 3594615), Janus Henderson Investors UK Limited (reg. no. 906355), Janus Henderson Fund Management UK Limited (reg. no. 2678531), Tabula Investment Management Limited (reg. no. 11286661), (each registered in England and Wales at 201 Bishopsgate, London EC2M 3AE and regulated by the Financial Conduct Authority) and Janus Henderson Investors Europe S.A. (reg no. B22848 at 78, Avenue de la Liberté, L-1930 Luxembourg, Luxembourg and regulated by the Commission de Surveillance du Secteur Financier).
Janus Henderson® and any other trademarks used herein are trademarks of Janus Henderson Group plc or one of its subsidiaries. © Janus Henderson Group plc.