Dividends
HHI
Henderson High Income Trust plc
Dividends
Henderson High Income Trust’s objective is to provide investors with a high dividend income stream while also maintaining the prospect of capital growth.
The trust’s unique structure has significantly aided its ability to deliver an attractive income return to shareholders. The allocation of a portion of its portfolio to fixed interest securities has provided a valuable source of alternative income and differentiates it from most other equity income investment companies. Bond interest paid by companies is usually more sustainable than dividends during times of economic stress, hence having the ability to allocate towards bonds provides a diversified source of income.
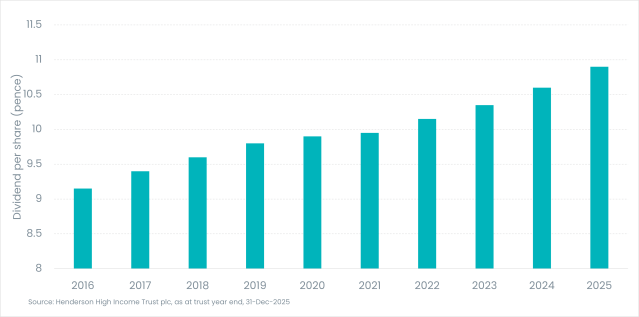
One of the main advantages of investment trusts is the ability to retain surplus income to create revenue reserves. Henderson High Income Trust can add to these reserves in profitable years and pay them out in the leaner years, thereby smoothing the level of dividend payments when appropriate. With a diversified portfolio and revenue reserves the trust has been able to grow its dividend for 12 consecutive years.
Henderson High Income Trust’s current dividend policy is to pay four quarterly interim dividends in April, July, October, and January.
Past performance does not predict future returns. The value of an investment and the income from it may go down as well as up and you may lose the amount originally invested.
Historic dividends (pence per share)
Dividend history
| Ex Dividend Date | Pay Date | Amount div p/ps |
|---|---|---|
| 11-Dec-25 | 30-Jan-26 | 2.78 |
| 11-Sep-25 | 24-Oct-25 | 2.78 |
| 12-Jun-25 | 25-Jul-25 | 2.68 |
| 03-Apr-25 | 25-Apr-25 | 2.68 |
| 12-Dec-24 | 31-Jan-25 | 2.68 |
| 12-Sep-24 | 25-Oct-24 | 2.68 |
| 13-Jun-24 | 26-Jul-24 | 2.62 |
| 04-Apr-24 | 26-Apr-24 | 2.62 |
| 07-Dec-23 | 26-Jan-24 | 2.62 |
| 14-Sep-23 | 27-Oct-23 | 2.58 |
| 15-Jun-23 | 28-Jul-23 | 2.58 |
| 06-Apr-23 | 28-Apr-23 | 2.58 |
Discrete performance (%)
|
Quarter End As of 30/06/2026 |
2025/2026 | 2024/2025 | 2023/2024 | 2022/2023 | 2021/2022 |
|---|---|---|---|---|---|
| Share price | 16.49 | 22.64 | 2.26 | 8.30 | -2.21 |
| Net asset value per share | 14.39 | 14.87 | 13.56 | 7.66 | 0.16 |
| 80% FTSE All-Share, 20% ICE BofA Sterling Non-Gilts | 18.34 | 9.99 | 12.35 | 4.98 | -1.22 |
Source: © 2026 Morningstar, Inc. All rights reserved. The information contained herein: (1) is proprietary to Morningstar and/or its content providers; (2) may not be copied or distributed; and (3) is not warranted to be accurate, complete, or timely. Neither Morningstar nor its content providers are responsible for any damages or losses arising from any use of this information. Past performance does not predict future returns.