Dividends
BNKR
The Bankers Investment Trust PLC
Dividends
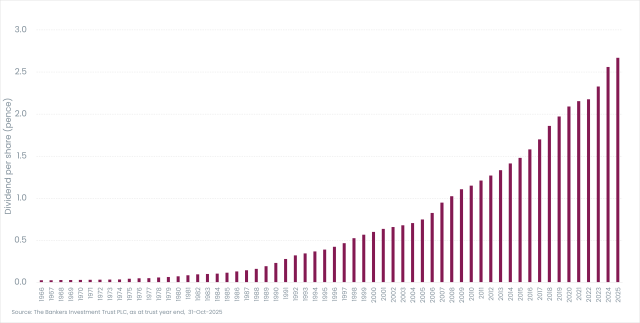
The Bankers Investment Trust aims over the long term to achieve dividend growth greater than inflation, as measured by the UK Consumer Prices Index (“CPI”). The Bankers Investment Trust has paid a dividend every year for the last 133 years and increased its dividends for 58 consecutive years.
One of the main advantages of investment trusts is the ability to retain surplus income to create revenue reserves. Bankers Investment Trust can add to these reserves in profitable years and pay them out in the leaner years, thereby smoothing the level of the dividend payments when appropriate.
Bankers pays four dividends per annum, at the end of May, August, November and February. The first three dividends are classed as interim dividends, but the February dividend is a final dividend which has to be approved by shareholders at the Annual General Meeting before it can be paid.
Past performance does not predict future returns. The value of an investment and the income from it may go down as well as up and you may lose the amount originally invested.
Historic dividends (pence per share)
Dividend history
| Ex Dividend Date | Pay Date | Amount div p/ps |
|---|---|---|
| 23-Oct-25 | 28-Nov-25 | 0.69 |
| 24-Jul-25 | 29-Aug-25 | 0.69 |
| 24-Apr-25 | 30-May-25 | 0.69 |
| 23-Jan-25 | 28-Feb-25 | 0.67 |
| 24-Oct-24 | 29-Nov-24 | 0.67 |
| 25-Jul-24 | 30-Aug-24 | 0.67 |
| 25-Apr-24 | 31-May-24 | 0.67 |
| 25-Jan-24 | 29-Feb-24 | 0.66 |
| 26-Oct-23 | 30-Nov-23 | 0.66 |
| 27-Jul-23 | 31-Aug-23 | 0.62 |
| 27-Apr-23 | 31-May-23 | 0.62 |
| 26-Jan-23 | 28-Feb-23 | 0.60 |
Discrete performance (%)
|
Quarter End As of 31/12/2025 |
2024/2025 | 2023/2024 | 2022/2023 | 2021/2022 | 2020/2021 |
|---|---|---|---|---|---|
| Share price | 18.48 | 15.08 | 6.08 | -17.75 | 13.55 |
| Net asset value per share | 13.36 | 12.26 | 11.57 | -10.55 | 16.79 |
| FTSE World TR GBP | 14.97 | 20.07 | 17.18 | -7.15 | 22.07 |
Source: © 2026 Morningstar, Inc. All rights reserved. The information contained herein: (1) is proprietary to Morningstar and/or its content providers; (2) may not be copied or distributed; and (3) is not warranted to be accurate, complete, or timely. Neither Morningstar nor its content providers are responsible for any damages or losses arising from any use of this information. Past performance does not predict future returns.