
Key takeaways:
- Our base case is now recession, leading us to seek the safety of high-quality investment grade, government bonds and asset-backed securities, which offer the most resilience across the scenarios considered.
- 10-year US Treasuries have room to rally based on probability-weighted expectations of possible future rates.
- Although they currently offer higher yields, high yield corporate debt and emerging market bonds offer less resilience across the scenarios we consider.
Welcome to the latest edition of our bond market forecast analysis. This report is based on the scenario analysis run by the Global Bonds Team to guide fixed income asset allocation decisions. Each report tries to assess the expected returns potentially delivered by the major fixed income sectors based on a range of modelled outcomes (see appendix for a full description of our methodology).
Central banks remain laser-focused on current inflation
Across all four scenarios modelled, inflation has either peaked or will do so by early 2023, and fall back sharply from current levels, but to differing degrees. Broad money growth has collapsed (unlike in the inflationary 1970s when it stayed above 10%), supply/demand imbalances that pushed up prices are correcting (e.g. freight rates, used car prices), housing markets are showing price falls and the base effects of energy price rises should bear down on year-on-year inflation numbers (albeit with a longer lag in UK/Europe).
Forward looking indicators such as real money supply growth, PMI new orders, and the inverted yield curve point to a sharp downturn ahead, reflecting the lagged effects of tighter monetary policy. Inflation-linked bond real yields made new highs for this cycle since our last report, signalling a tightening of financial conditions. Ultimately, current central bank policy means more rate hikes until inflation shows a more pronounced downward trend, which will be met with demand destruction and a squeeze in real and discretionary incomes.
Figure 1: Fading money growth suggests inflation is heading lower
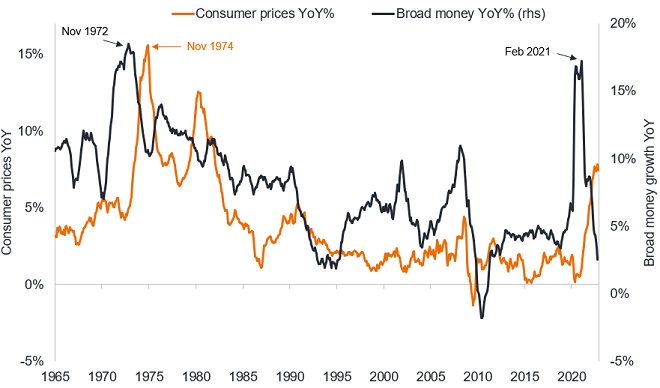
Source: Refinitiv Datastream, Janus Henderson Investors, 31 January 1965 to 30 November 2022. G7 Consumer Price Index, year-on-year % change, G7 Broad Money growth, year-on-year % change. G7 countries are Canada, France, Italy, Japan, Germany, UK and US. Broad money is the stock of physical cash, bank deposits, money market funds and other monetary instruments held by the private sector.
Scenarios considered
We adopt a scenario-driven approach to identify the relative attractiveness of fixed income sectors. Our aim is not to perfectly forecast returns to the nearest basis point (as that is not possible), but to understand the range of return outcomes and gauge the resilience of that performance across probable scenarios.
Our base case over the year to end of 2023 is that the global economy enters a recession. The speed at which central banks have hiked rates will feed through to the real economy including the housing markets, and consumer spending power weakens as real incomes are eroded by inflation. With tight labour markets, unemployment is not expected to rise as significantly as it did during COVID, but demand destruction results in weak GDP and falling inflation. Although stronger consumer spending stateside and the country’s lower sensitivity to energy price swings helps insulate the US from the worst of the downturn we model, we still expect the US to fall into a recession.
Various leading indicators have already signalled that recession is likely. A soft landing is still possible in the US, but the chances are receding. Overall, these two scenarios – recession and soft-landing – account for over 75% of the probability distribution. Inflation falls in all scenarios from current levels to between 1.7% and 4.5% in a year’s time.
Base case (recession):
- Our bear case from last quarter has now become the most likely scenario.
- A global recession that hits Europe especially hard (-1.7% for EU and -1% for US GDP growth over 2023), due to energy market supply shocks triggered by the Russia-Ukraine conflict.
- Central banks pause rate hikes in early 2023 before retreating.
- Credit spreads move sharply wider by 450-500 bps to recessionary levels in high yield corporate debt and defaults in the sector rise to mid-single digits, albeit with a lag.
- Recession kills inflation – US Core PCE falls to 1.7% over the 12-month forecast horizon, while in Europe core inflation falls to 2.5%.
Bull case (soft landing):
- This is the Goldilocks scenario (in relative terms at least), with a growth slowdown occurring (US GDP growth c.1%) and a very mild recession in Europe. This is predicated on a fall in inflation as commodity market supply shocks dissipate, and a weaker US dollar which allows central banks to slow rate hikes, and pivot. Job openings are cut but employment remains robust.
- Riskier assets perform well, as lower volatility and a benign default backdrop boost risk appetite and credit spreads tighten from today’s levels. Government bond yields end the period modestly lower as the inflation tail risk is avoided, providing a boost to returns.
Bear case (mild stagflation):
- While this environment would usually be the worst scenario for fixed income returns, current inflation expectations and fixed income yields offer some mitigation.
- Over the forecast horizon inflation falls to 3.2% in the US and 3.9% in the Eurozone. We call this mild stagflation as it is not as harmful as seen over the past 12 months.
- Central banks are forced to hike rates through 2023 with the Fed funds rate reaching 5.5% and the ECB deposit rate 3%. While rates move higher and credit spreads widen, the impact is softened by the higher starting point for yields (carry). Despite higher rates, investment grade outperforms high yield as the weak growth environment results in wider spreads in corporate debt and emerging markets.
Bull case (fiscal push):
- Government intervention and spending programs are enlarged in co-ordinated fashion to both minimise the impact on consumers/businesses from the cost-of-living crisis and to boost growth. This provides some offset to the monetary policy tightening of central banks.
- Government bond yields move higher to reflect the higher terminal rate in this scenario and a greater fiscal premium, with yield curves steepening.
- Growth picks up and the global economy largely avoids falling into a recession, with similar growth outcomes to the soft-landing scenario, but worse inflation profile (4.5% in both US and Europe).
- The move higher in rates (US / EU 10-year at 4.75%/4%) is most painful for interest-rate sensitive assets such as core government bonds.
Figure 2: Expected fair values and key economic variables by scenario
| Base | Soft landing | Stagflation | Fiscal push | |
|---|---|---|---|---|
| Annual GDP growth* | -1.3% | 0.4% | -0.5% | 0.5% |
| 10-year US Treasury | 1.7% | 3.1% | 4.2% | 4.75% |
| 10-year German Bund | 1.6% | 2.5% | 3.25% | 4.0% |
| Credit spreads (HY) | Wider | Tighter | Modestly wider | Wider |
| Inflation breakevens | Lower | Flat | Modestly higher | Higher |
Source: Janus Henderson Investors, 28 December 2022. *Average for US/EU GDP growth over the 12-month period. There is no guarantee that past trends will continue, or forecasts will be realised.
2023 appears to look much brighter for fixed income
2022 was highly challenging for fixed income investors: the relentless move higher in rates (the Fed hiked rates by 425bps in just ten months to December 2022), and widening in credit spreads has continued to bolster the starting yield and prospective forward-looking returns for fixed income asset classes. This higher yield cushion also provides greater ballast, and scope for fixed income to offer defensive properties. This is shown by the greater appeal of higher quality sectors such as fixed interest government bonds, agency mortgages and investment-grade corporate debt in the scenarios we consider most likely.
Figure 3: 12: month fixed income sector return outlook
| Heatmap – broad market returns | Recession | Soft landing | Stagflation | Fiscal push |
|---|---|---|---|---|
| Govt – Fixed Interest | ||||
| Govt – Inflation linked | ||||
| Investment grade corporate | ||||
| High yield corporate | ||||
| EM Credit | ||||
| Secured loans | ||||
| Floating rate ABS | ||||
| Agency MBS |
Legend: 1 year return estimates (%) in each secenario for each sector |
|||
| <0% | 0-3% | 3-5% | >5% |
Source: Janus Henderson Investors, as at 28 December 2022. Note:*Bull (bear) refers to a positive (negative) outturn for economic performance. Expected returns for a US dollar-based investor, based on index returns before allowance for alpha. Any differences among portfolio securities currencies, share class currencies, and your home currency will expose you to currency risk. The above are the portfolio managers’ views and should not be construed as advice and may not reflect other opinions in the organisation. There is no guarantee that past trends will continue, or forecasts will be realised.
Key findings:
- The move higher in real yields has increased the attractiveness of government bonds. Core government bonds are expected to perform well in both recession and soft landing, which are the two scenarios to which we assign the most probability. This performance reflects the fact that bond markets are pricing in rate hikes well above long-term neutral rates. On a probability-weighted basis, the weighted-average US Treasury yield across the scenarios we model is 2.5% in twelve months’ time, reflecting our higher weight to the recession scenario (see fig 4 below). Even if you assume 50/50 probability between recession and soft landing, this would imply a 10-year Treasury yield at a similar level.
- Higher quality assets – such as Agency MBS and investment grade corporate debt – are expected to generate high single digit returns (or better) in what we consider to be the two most likely scenarios. This demonstrates the greater yield resilience at today’s starting point – if credit spreads widen this can potentially be mitigated by offsetting moves down in risk-free rates (and vice versa).
- Short duration bonds – while there is greater uncertainty at the front end of the curve in terms of the level at which terminal rates will settle, the “breakevens” are high, implying a solid yield and resilience to more extreme moves higher in rates than modelled here. As an example, a 1-5 year investment grade credit can tolerate a 200bp rise in rates, before returns would turn negative on a 12-month horizon. However, there is potential opportunity cost by foregoing the double-digit returns that high quality longer-dated bonds deliver in certain scenarios we model.
- Credit sensitive asset classes such as corporate high yield perform weakest in the recession scenario. In a soft-landing, the high yield sector is expected to perform best on a relative basis. Given the higher probability placed on recession by the team and the variability across the scenarios it is less attractive on a relative basis.
- For senior floating rate asset-backed securities (ABS), while expected returns are relatively modest in the recession scenario at 2-3%, they also offer resilience across the scenarios so can continue to play a role as a defensive ‘carry’ asset.
Figure 4: US 10‑year Treasury yield forecast by scenario (%)
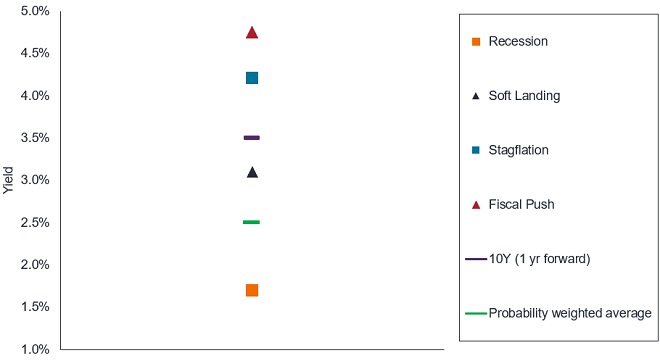
Source: Janus Henderson Investors, 28 December 2022. There is no guarantee that past trends will continue, or forecasts will be realised.
Up in quality
While investors may have different probabilities for recession, or a different scenario altogether, the key conclusion is that higher quality fixed income assets such as investment grade and government bonds provide both upside and greater resilience across the scenarios modelled. For investors more concerned about upside inflation risks, concentrating on the shorter duration part of the universe can provide a greater cushion against further rises in yields, but gives up some upside should bond yields rally from here.
What we are watching for:
- Inflation trends: the trend in core inflation remains critical not just the level, but also the rate of change. The large drop in the US November CPI print was an encouraging sign.
- Leading indicators of the cycle: Long leading indicators have not yet bottomed, suggesting that recession risks remain high. To corroborate this view, we are watching coincident indicators (such as industrial production, non-farm payrolls) which would act as a confirmatory signal. Conversely, a more bullish turn in lead indicators would indicate greater possibility of a soft landing.
- Market behaviour: Fixed income markets do not operate in a vacuum. We look at equity market signals and measures of market volatility such as VIX and MOVE for credit markets – should volatility subside this can create opportunity for a near-term rally in credit spreads.1
Footnotes
1 VIX is a measure of the stock market’s expectation of volatility based on S&P 500 index. MOVE measures Treasury rate volatility through options pricing.
Basis point (bp) equals 1/100th of a percentage point. 1bp = 0.01%, 100bps = 1
Diversification neither assures a profit nor eliminates the risk of experiencing investment losses.
Emerging market investments have historically been subject to significant gains and/or losses. As such, returns may be subject to volatility.
Fixed income securities are subject to interest rate, inflation, credit and default risk. The bond market is volatile. As interest rates rise, bond prices usually fall, and vice versa. The return of principal is not guaranteed, and prices may decline if an issuer fails to make timely payments or its credit strength weakens.
High-yield or “junk” bonds involve a greater risk of default and price volatility and can experience sudden and sharp price swings.
Mortgage-backed securities (MBS) may be more sensitive to interest rate changes. They are subject to extension risk, where borrowers extend the duration of their mortgages as interest rates rise, and prepayment risk, where borrowers pay off their mortgages earlier as interest rates fall. These risks may reduce returns.
Stagflation is an economic cycle characterised by slow growth and a high unemployment rate accompanied by inflation.
Carry is the excess income earned from holding a higher yielding security relative to another.
Consumer Price Index (CPI) is an unmanaged index representing the rate of inflation of the U.S. consumer prices as determined by the U.S. Department of Labor Statistics.
Credit spread is the difference in yield between securities with similar maturity but different credit quality. Widening spreads generally indicate deteriorating creditworthiness of corporate borrowers, and narrowing indicate improving.
Duration measures a bond price’s sensitivity to changes in interest rates. The longer a bond’s duration, the higher its sensitivity to changes in interest rates and vice versa.
Quantitative easing (QE): A form of monetary policy used by central banks to restrict the economy by reducing the amount of overall money in the banking system.
Volatility measures risk using the dispersion of returns for a given investment.
A yield curve plots the yields (interest rate) of bonds with equal credit quality but differing maturity dates. Typically bonds with longer maturities have higher yields.
10-Year Treasury Yield is the interest rate on U.S. Treasury bonds that will mature 10 years from the date of purchase.
Methodology – asset class level projections
We use a scenario-based approach to model potential outcomes over a 12-month horizon. Rather than rely on single point estimates, we think it is important to consider the distribution of potential outcomes based on probable future economic scenarios. This approach helps us better understand the distribution of potential outcomes and avoids biases based on a single-deterministic path.
In each scenario, we define expectations of key economic variables such as GDP growth, inflation, exchange rates, central bank rates and key tenor points on the yield curve, for the major economic blocs.
Government bond returns are estimated by calculating a fair value yield, taking into account the expected path of central bank rates and, the neutral rate, for each scenario. The total return is calculated by combining the coupon income and the likely price impact of the scenario yield estimates.
Inflation-linked bond returns are assessed by considering outcomes for breakeven inflation alongside nominal rates (outlined above), which gives an implied change in real yield. This is then used to calculate expected returns.
For credit asset classes, we assume expected issuer default rates in each scenario. We project returns by combining nominal rates (at the appropriate maturity) and the estimated change in credit market spread, adjusted for expected default losses and liquidity premia.
Returns are projected on a currency hedged basis, assuming 12-month forward FX hedging to base.
These are the views of the author at the time of publication and may differ from the views of other individuals/teams at Janus Henderson Investors. References made to individual securities do not constitute a recommendation to buy, sell or hold any security, investment strategy or market sector, and should not be assumed to be profitable. Janus Henderson Investors, its affiliated advisor, or its employees, may have a position in the securities mentioned.
Past performance does not predict future returns. The value of an investment and the income from it can fall as well as rise and you may not get back the amount originally invested.
The information in this article does not qualify as an investment recommendation.
There is no guarantee that past trends will continue, or forecasts will be realised.
Marketing Communication.