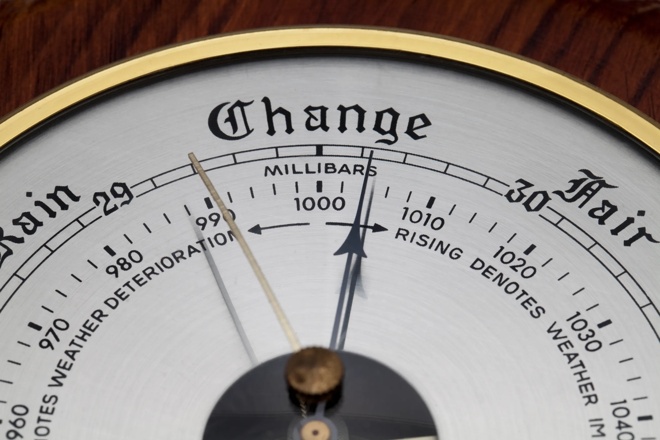
Bond markets can often be a barometer of what is happening in the economy. In the first six months of 2025, beyond the “Liberation Day” tariff shocks, there were two notable trends. First, a steepening of yield curves as yields on shorter-dated government bonds (e.g. bonds with two years left to maturity) fell more than the yields on longer-dated bonds (bonds with 10 or more years to maturity). Second, the rapid recovery of credit spreads (the difference in yield between a corporate bond and a government bond of similar maturity) to their tight levels following the tariff shock.
Government bond yields
Shorter dated government bond yields – with a few exceptions such as Japan – generally declined in the first half of 2025. This decline reflected a reduction in inflation from the highs experienced around the COVID pandemic. Recall that only three years ago inflation was brushing 10% in many developed markets, whereas today it is around 2%-4%.
Central banks responded to moderating inflation by lowering interest rates, which helped bring down yields on shorter-dated bonds. Bond prices rise when yields fall and vice versa. During the first half of 2025, the European Central Bank cut its deposit rate from 3% to 2% and the Bank of England cut its Bank Rate from 4.75% to 4.25%. While the US Federal Reserve kept its policy rate stable, market expectations leaned towards a potential decrease.
Yield moves on longer-dated bonds were more mixed. In the US, the 10-year government bond yield declined in the first half of 2025 but less than the 2 year (see Figure 1). In the UK, the 10-year government bond yield came down only slightly and in Germany it actively rose.
Figure 1: Yields (%) and yield change on government bonds
| 2-year | 31 Dec 2024 | 30 June 2025 | Change |
| US | 4.24 | 3.72 | -0.52 |
| UK | 4.39 | 3.82 | -0.57 |
| Germany | 2.08 | 1.86 | -0.22 |
| 10-year | |||
| US | 4.57 | 4.23 | -0.34 |
| UK | 4.57 | 4.49 | -0.08 |
| Germany | 2.36 | 2.60 | +0.24 |
Source: Bloomberg, government bond yields, 30 June 2025. Yields may vary and are not guaranteed.
The principal reason is fresh concern about debt sustainability. In the US, the passing of the ‘Big Beautiful Bill’ is forecast to add an additional US$2 trillion to US government borrowing between 2025-29.1 In the UK, tax raising has been offset by higher welfare and public sector pay. In Germany, the government has proposed a big increase in infrastructure and defence spending.
That is not to say government spending is bad – it can be a useful stimulant to the economy. Bond markets, however, are reacting to the potential rise in interest costs and future inflation that could be stoked by higher government borrowing, demanding higher yields to lend for longer periods.
Corporate resilience
Companies spent much of the last few years repairing their balance sheets and despite the economic recovery since COVID we have not seen an aggressive rise in merger and acquisition activity that in the past has often been fuelled by taking on debt. In some ways, the resilience of corporates is partly related to the largesse of governments. Figure 2 shows that there has been a shift in debt burden towards governments and away from corporates and households.
Figure 2: The largest rise in debt since 2019 is among governments, not corporates
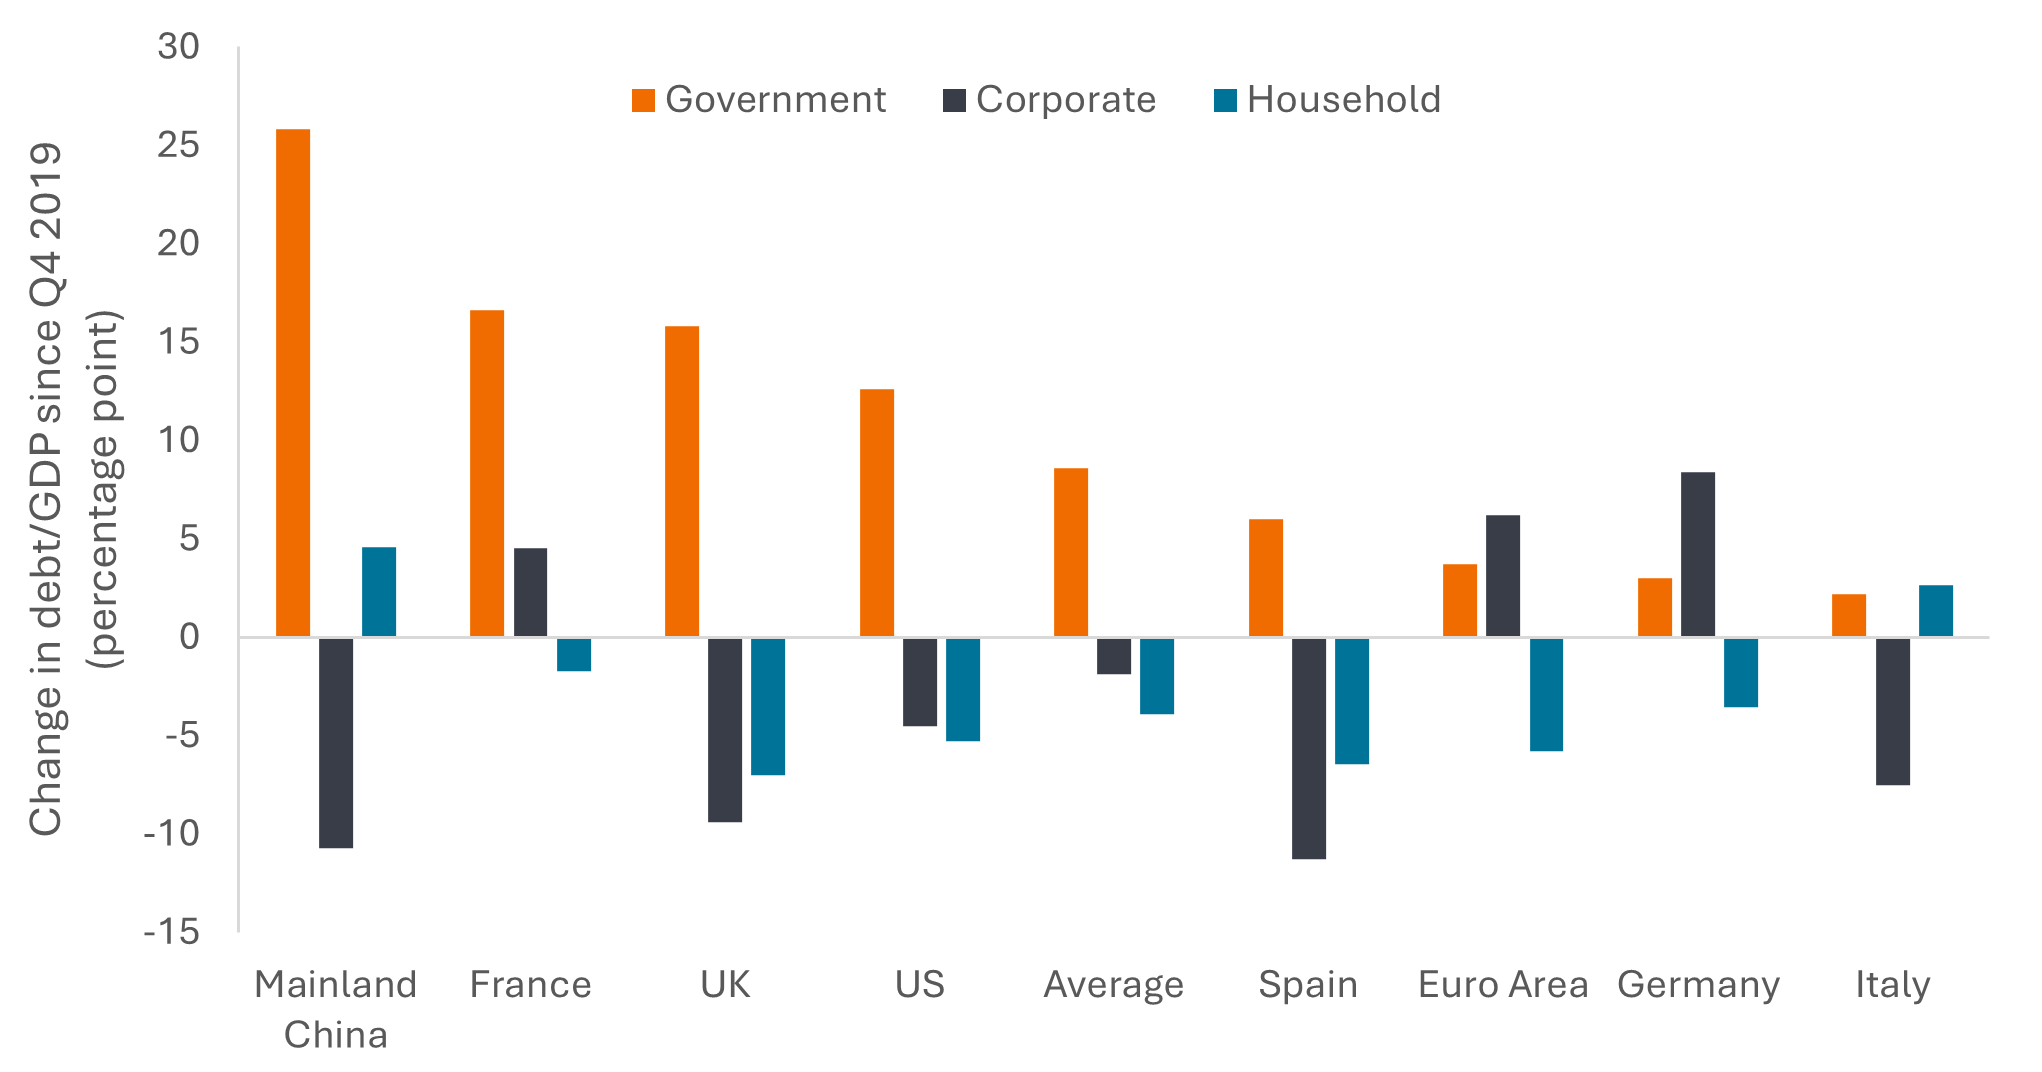
Source: HSBC, BIS, IIF, national statistical agencies. Until Q4 2024, except governments (Q3 2024) and corporates and households for UK and China (Q3 2024). Gross domestic product (GDP) is a measure of the size of the economy.
Corporate finances are therefore relatively healthy and this has contributed to lower credit spreads. You can think of credit spreads as the extra yield that investors demand for lending to a company. For example, if a 3-year corporate bond of XYZ Company is yielding 6% and a 3-year government bond is yielding 4%, then the credit spread is the difference (6% minus 4% = 2%). In the bond world, we tend to describe spread in terms of basis points where 1% equals 100 basis points. In Figure 3 you can see how spreads on investment grade corporate bonds were generally declining in the US, Europe and the UK before spiking around President Trump’s shock tariff announcements. Over subsequent months they quickly settled back towards their tight (low) levels.
Figure 3: Credit spreads on investment grade corporate bonds are close to their tights
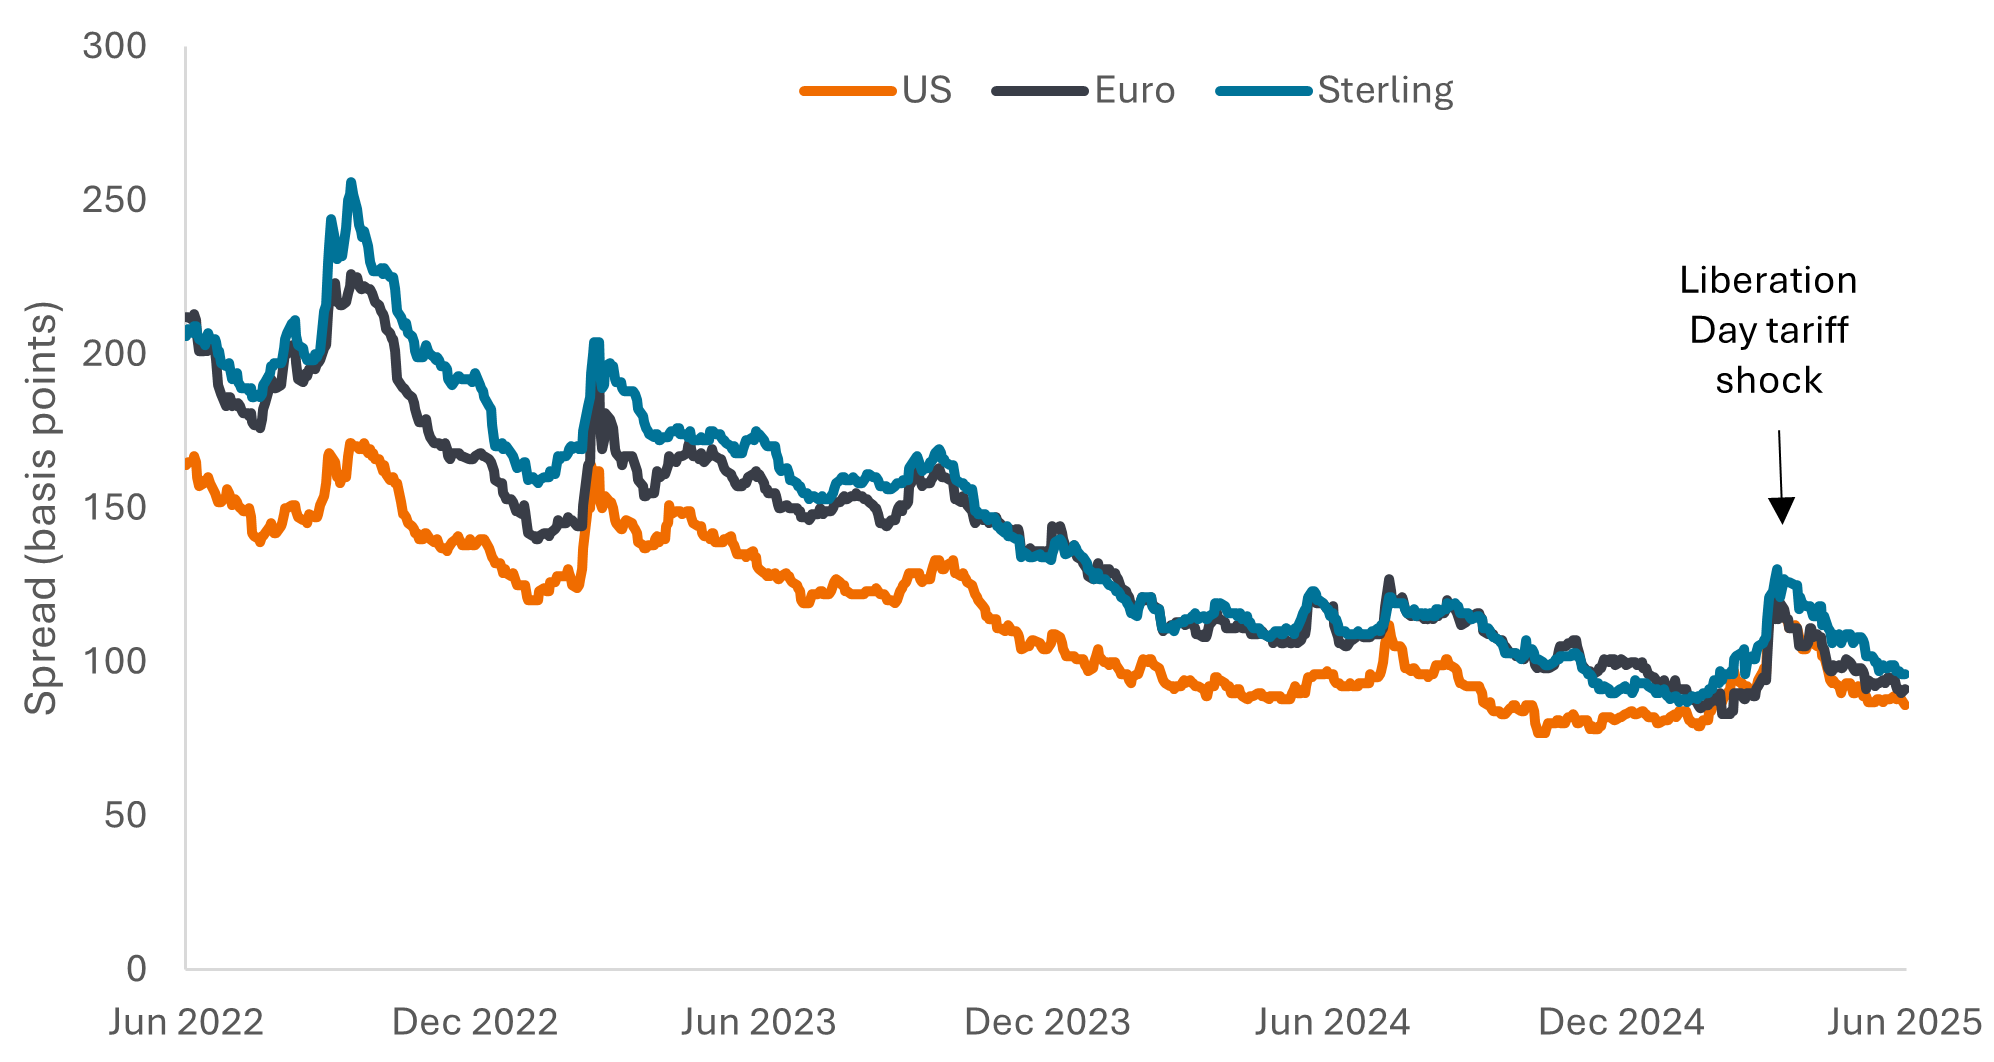
Source: ICE BofA US Corporate Index, ICE BofA Euro Corporate Index, ICE BofA Sterling Corporate Index, 30 June 2022 to 30 June 2025.
Credit spreads are a confidence indicator. They are low (tight) when companies find it easy to borrow. Currently, there is appetite from investors to lend to companies, hence spreads are historically low. It helps that government bond yields are much higher than where they were a few years ago because with the corporate spread on top, investors can typically receive yields from corporate bonds of between 3% to 8% depending on the credit quality, geography and maturity term of the bond.2
Seeking certainty in a period of uncertainty
Bonds offer a predictable return if held to maturity, provided the borrower meets the repayments. However, they can still experience price volatility. And there remain plenty of factors that could unsettle markets. The impact of tariffs may be felt more in the second half of 2025 given that front-loading of imports may have distorted trade and companies may have delayed raising prices as they wait to see where tariffs settle. Questions around the independence of the US Federal Reserve (Trump has been a vocal critic of Fed Chair Jerome Powell whose term officially ends in May 2026) are also unhelpful. Central bank independence (free of political interference) is viewed as a key element in helping contain inflation in recent decades.
More positively, government borrowing could help economies avoid recession. If tariff terms can be agreed and they are not overly punitive this would lift some uncertainty from the market. With investors seeking income, corporate bond spreads could even make new tights. At current valuations, however, we think it is worth being cautious. One thing is certain: change remains very much in the air.
1 Source: US Congressional Budget Office, estimate effects, 29 June 2025.
2 Source: Bloomberg, ICE bond indices; typical yields available in global investment grade and high yield bond markets at 30 June 2025. Yields may vary over time and are not guaranteed.
Credit spread: The difference in yield between securities with similar maturity but different credit quality. Widening spreads generally indicate deteriorating creditworthiness of corporate borrowers, and narrowing indicate improving.
Corporate bonds: Bonds issued by companies. These can be rated investment grade by credit rating agencies, which means they are perceived to have a relatively low risk of defaulting (failing to meet repayments to bondholders. Conversely, bonds rated high yield carry a higher risk of the issuer defaulting, so they are typically issued with a higher yield to compensate for the additional risk.
Inflation: The rate at which prices of goods and services are rising in an economy.
Maturity: The maturity date of a bond is when the principal investment (and any final income payment) is paid to investors.
Yield: The level of income on a bond over a set period, typically expressed as a percentage rate.
Yield curve: A graph that plots the yields of government bonds against their maturities. Normally, the yield curve is upward sloping, where yields for shorter-maturity bonds are lower than yields for bonds with a longer maturity.
These are the views of the author at the time of publication and may differ from the views of other individuals/teams at Janus Henderson Investors. References made to individual securities do not constitute a recommendation to buy, sell or hold any security, investment strategy or market sector, and should not be assumed to be profitable. Janus Henderson Investors, its affiliated advisor, or its employees, may have a position in the securities mentioned.
Past performance does not predict future returns. The value of an investment and the income from it can fall as well as rise and you may not get back the amount originally invested.
The information in this article does not qualify as an investment recommendation.
There is no guarantee that past trends will continue, or forecasts will be realised.
Marketing Communication.