Chart to Watch: Is U.S. market concentration overlooking healthcare innovation?
After several years of mega-cap tech leadership, information technology now accounts for more than 35% of the total market capitalization of the S&P 500 Index, surpassing levels seen at the height of the dot-com era and crowding out other sectors. Portfolio Manager Dan Lyons discusses how accelerating innovation and deeply discounted valuations argue for investors taking a closer look at healthcare stocks.
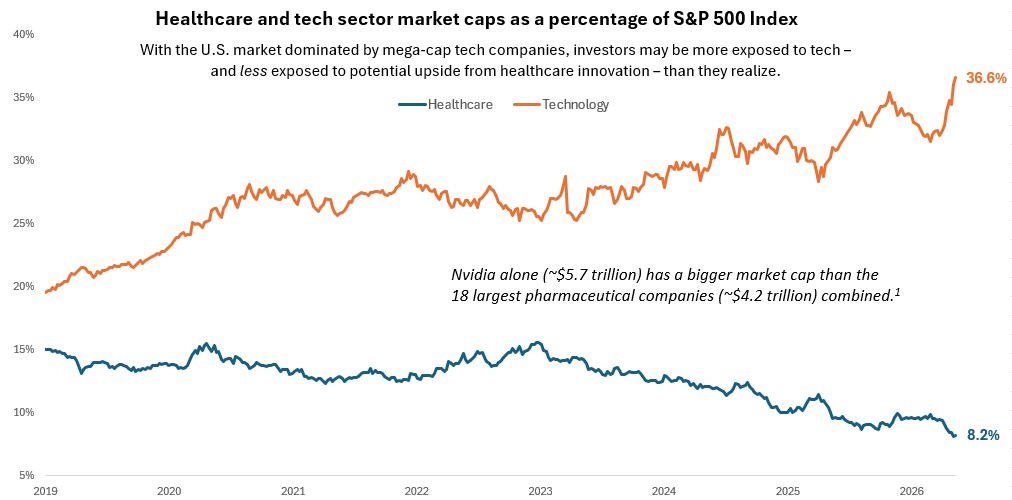
Source: Bloomberg, data as of 1 January 2019 to 14 May 2026. Represents GICS sector market capitalization as a percentage of S&P 500 Index total market capitalization. Healthcare = S&P 500 Health Care Sector, which comprises those companies included in the S&P 500 that are classified as members of the GICS Health Care Sector. Technology = S&P 500 Information Technology Sector, which comprises those companies included in the S&P 500 that are classified as members of the GICS Information Technology Sector. Past performance is no guarantee of future results.
As last year’s policy-driven headwinds have faded, healthcare has moved into a more constructive operating environment driven by continued innovation across the sector, including meaningful advances coming in the fields of oncology, obesity, and immunology. Large pharmaceuticals have also taken notice, spurring a flurry of M&A activity across biotech in recent quarters. With valuations still deeply discounted, we think the market may be underappreciating healthcare’s blend of innovation-led growth and defensive characteristics. -Dan Lyons, Portfolio Manager
Key Takeaways
- The S&P 500 Index has never been this dominated by the technology sector, even at the height of the dot-com era, leaving many investors less diversified than they may realize.
- Meanwhile, the healthcare sector represents the smallest share of the broader U.S. equity market on record, despite accelerating innovation and structural tailwinds from aging demographics and AI-driven efficiencies.
- We believe this sharp divergence warrants a closer look and could present an opportunity for long-term investors to access innovation across the healthcare sector at a meaningful discount.
Notably, under current Global Industry Classification Standard (GICS®) classifications, Big Tech giants Meta and Google-parent Alphabet sit within communication services, while Amazon is classified as consumer discretionary. Adding these three companies to information technology would bring the tech sector’s weight to roughly 50% of the S&P 500.
Meanwhile, healthcare’s representation within the broader U.S. equity market has never been this low, despite accelerating innovation across the sector and structural tailwinds such as ageing demographics and AI-driven efficiencies. Moreover, resurgent merger and acquisition (M&A) activity and a steady stream of drug approvals have contributed to a more constructive biopharma backdrop, while the healthcare sector as a whole has proven resilient in the face of macro volatility, energy price shocks, and a higher interest rate environment.
Still, healthcare trades at a historically deep discount relative to the broader U.S. equity market. As of this writing, the trailing price-to-sales (P/S) ratio for the S&P 500 stands at 3.8, well above its 20-year average of 2.0, while healthcare’s P/S sits closer to 1.5x, below its long-term average closer to 1.7.2 This comes despite healthcare profitability, as measured by return on equity (ROE), roughly on par with the broader index.
Given an increasingly concentrated U.S. equity market, we believe this divergence represents a compelling opportunity for long-term investors to gain exposure to healthcare innovation at attractive valuations.
1 Source: Bloomberg, data as of 14 May 2026.
2 Source: Bloomberg, data as of 14 May 2006 to 14 May 2026.
Price-to-sales (P/S) ratio is an investment metric used to determine a company’s valuation by comparing its stock price to its revenue. A lower P/S ratio may indicate a stock is undervalued, while a higher ratio can suggest overvaluation relative to peers in the same sector.
Return on Equity (ROE) is the measure of a company’s annual return (net income) divided by the value of its total shareholders’ equity, expressed as a percentage. The number represents the total return on equity capital i.e., the profits made for each dollar from shareholders’ equity.
S&P 500® Index reflects U.S. large-cap equity performance and represents broad U.S. equity market performance.
IMPORTANT INFORMATION
Equity securities are subject to risks including market risk. Returns will fluctuate in response to issuer, political and economic developments.
Health care industries are subject to government regulation and reimbursement rates, as well as government approval of products and services, which could have a significant effect on price and availability, and can be significantly affected by rapid obsolescence and patent expirations.
Technology industries can be significantly affected by obsolescence of existing technology, short product cycles, falling prices and profits, competition from new market entrants, and general economic conditions. A concentrated investment in a single industry could be more volatile than the performance of less concentrated investments and the market as a whole.