
Key takeaways:
- Global equities advanced in May, with tech-heavy markets in Asia and the U.S. leading the gains. Major benchmarks built on April’s rally, supported by continued AI enthusiasm and strong earnings growth.
- Global sovereign bonds delivered mostly positive returns amid a volatile rate backdrop, as yields rose sharply into mid-month before pulling back into month-end. Credit markets were constructive, with corporate bonds and securitized assets benefiting from tightening spreads.
- Markets looked through continued Middle East uncertainty, with optimism around a potential Iran deal contributing to a sharp decline in oil prices and a late-month pullback in yields. This shift helped support equities and coincided with tentative signs of broadening beyond the AI leaders that had dominated earlier in the month.
Market overview
Global equities advanced in May, buoyed by continued artificial intelligence (AI) enthusiasm and resilient risk sentiment. The MSCI World Index rose 4.6% in U.S. dollar terms, building on April’s nearly 10% gain. Technology-heavy benchmarks across Asia and the U.S. once again outperformed, while developed Europe lagged. Global government bonds delivered modest positive returns amid a volatile rate backdrop that saw yields rise sharply into mid-month before pulling back later in the period. Global corporate bonds also gained, supported by tightening credit spreads.
Oil prices declined sharply during the month amid optimism around a potential U.S.-Iran agreement that would foster a reopening of the Strait of Hormuz. Brent crude fell roughly 19%, its steepest monthly decline since March 2020, though it remained above $90 a barrel. The U.S. Dollar Index strengthened by 0.9% against major currencies, most notably against the yen and sterling. Gold posted a modest monthly decline.
Technology-heavy benchmarks continued to pace global equities in May
Asia and U.S. equities outperformed, boosted by AI-related semis and memory chipmakers.
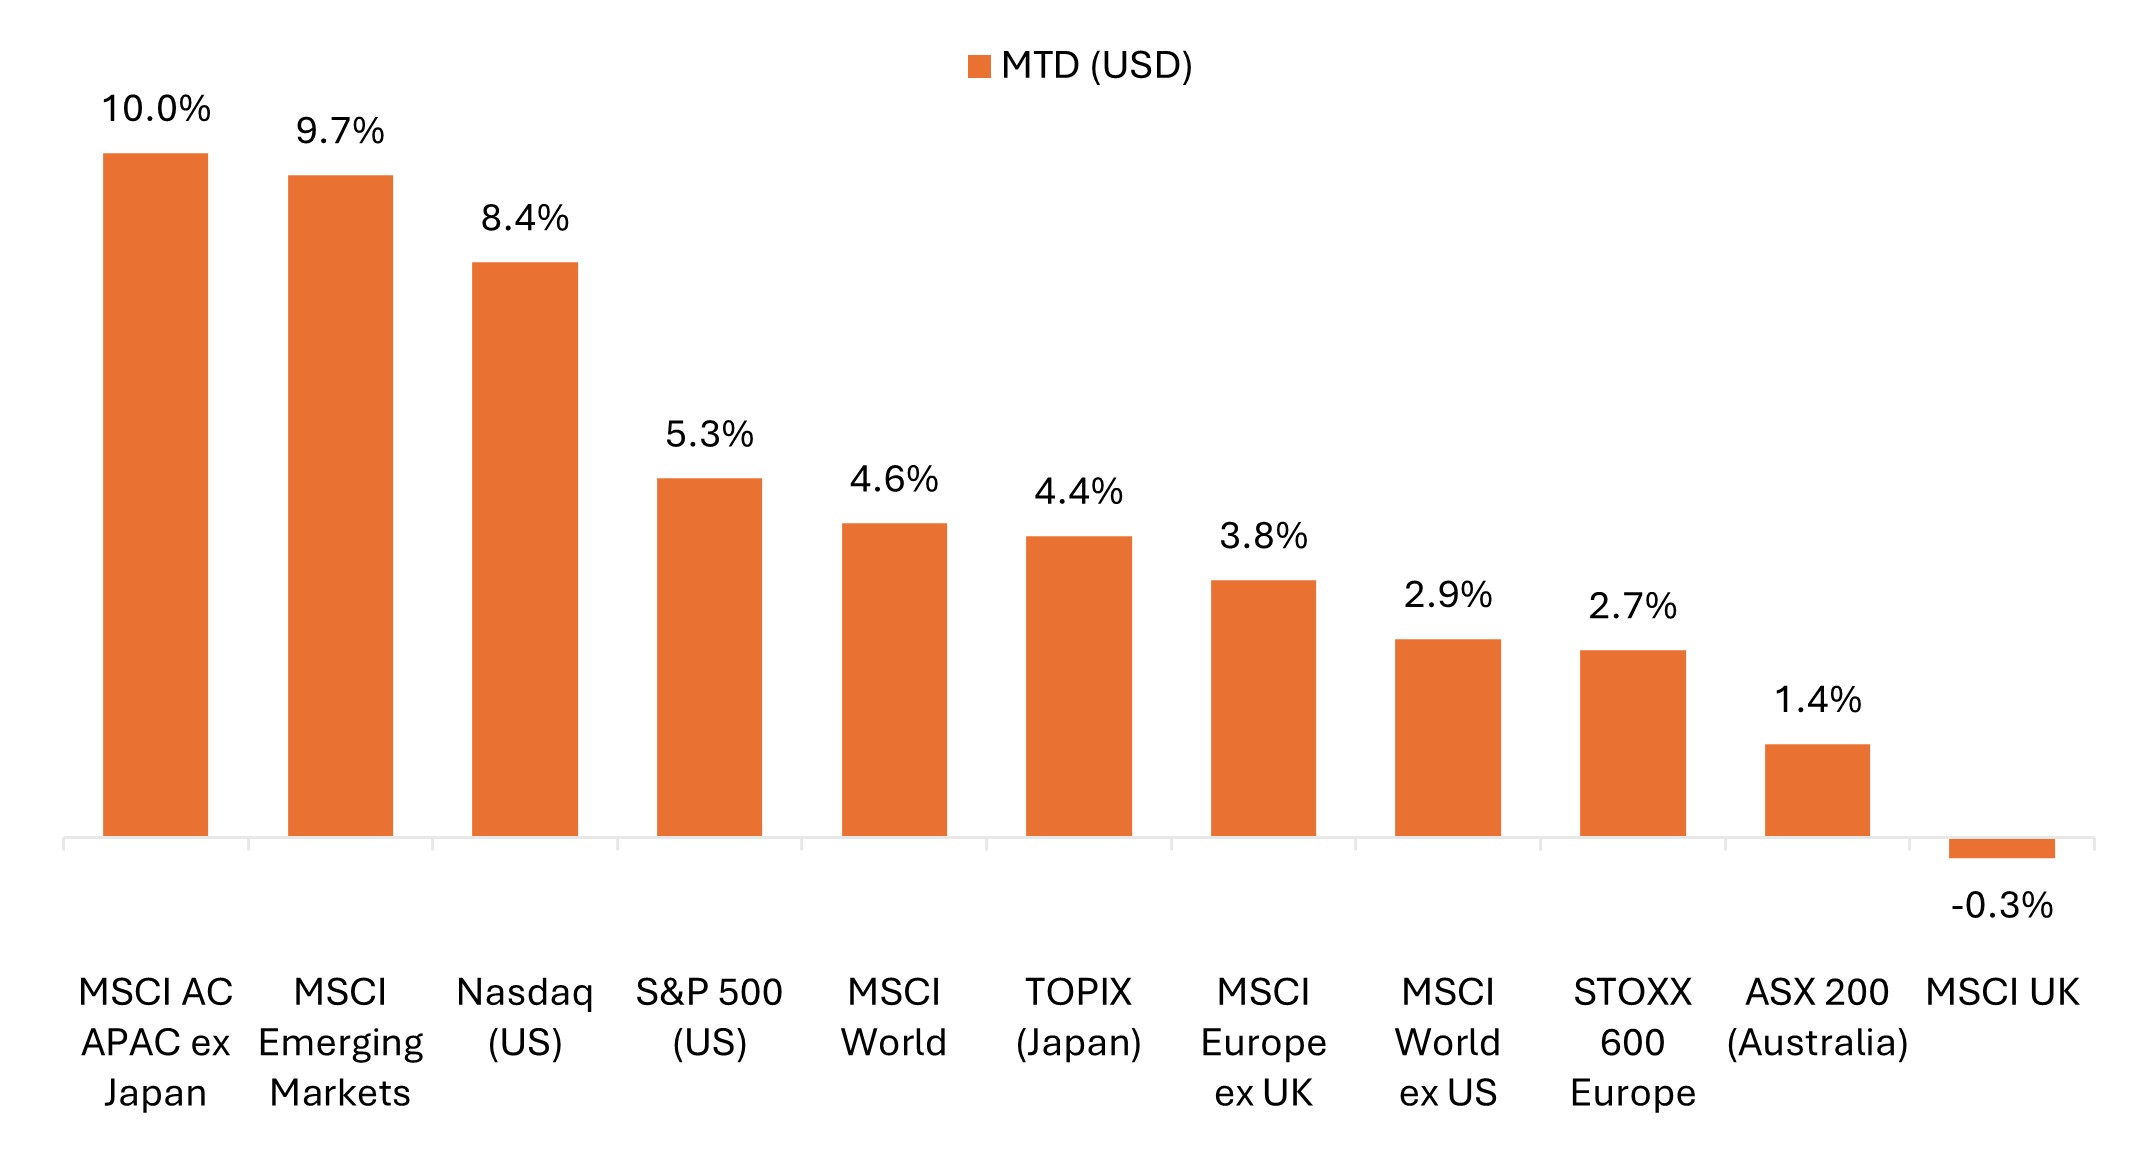 Source: Bloomberg, data from 30 April 2026 to 31 May 2026. Represents index total returns in U.S. dollar terms. Past performance is no guarantee of future results.
Key themes that mattered for markets
- The AI buildout remained dominant, with supply bottlenecks in focus: Semiconductors and AI infrastructure stocks rallied in May, extending a move that gained momentum in April as confidence grew in sustained AI-driven demand for compute. Leading memory chipmakers surged, with some reaching trillion-dollar market capitalizations, while Asian technology markets – particularly South Korea’s Kospi – were among the most direct beneficiaries. Optical connectivity and custom silicon have also emerged as focal points as agentic AI workflows reshape where the supply bottlenecks lie.
- No war and no peace, but Iran deal optimism underpinned markets: While April’s tentative ceasefire largely held, the Strait of Hormuz remained effectively closed, with geopolitical headlines whipsawing between reports of an imminent resolution/extension and fresh military flare-ups. Global equities proved resilient despite the unsettled backdrop, marching to record highs and causing some to argue that a near-term reopening of the Strait may be largely priced in.
- New highs, narrow breadth … with nascent signs of broadening: The first half of May was marked by narrow market leadership, with gains concentrated in technology stocks buoyed by strong earnings growth and AI enthusiasm. The second half, however, saw broader participation across sectors, market caps, and geographies, with equal-weight benchmarks outperforming, offering tentative signs that the rally may be widening beyond its AI leadership core.
- Global bond markets were volatile as yields surged into mid-May before partially retracing: Sovereign bond yields across developed markets rose on war-driven inflation and fiscal concerns, then retreated as oil prices eased amid Iran deal optimism. While yields remained well above pre-conflict levels, the pullback in yields and crude provided a more supportive backdrop for equities into month end, particularly for rate-sensitive and consumer-exposed sectors.
Global long-dated government bond yields remain elevated
Bloomberg Global 10+ Year Total Return Index, yield to worst
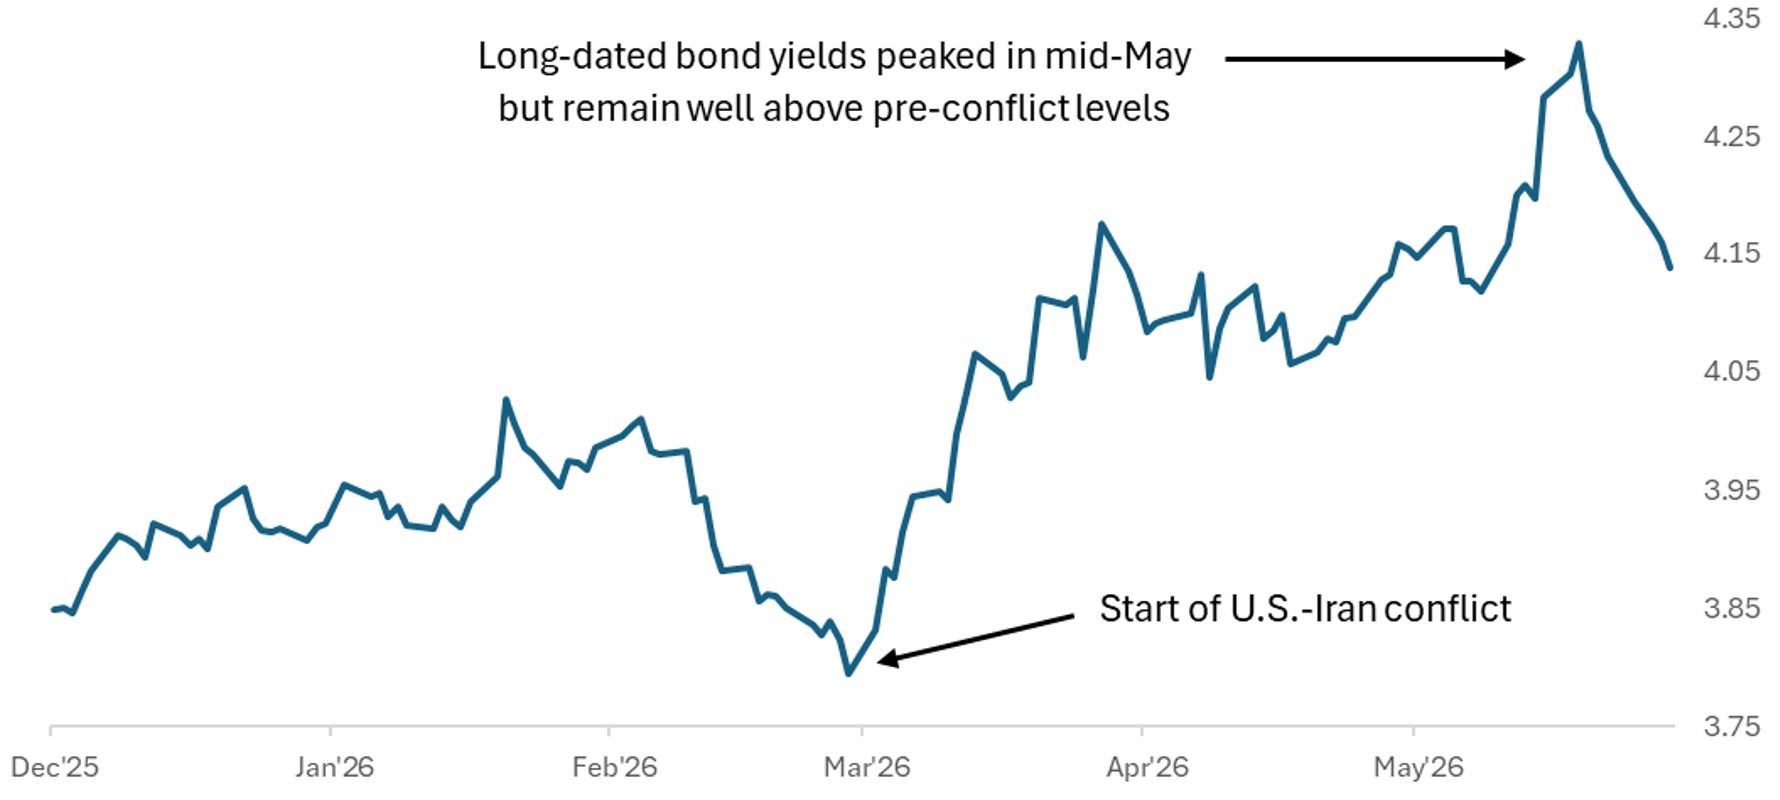
Source: Bloomberg, data from 1 December 2025 to 31 May 2026. The Bloomberg Global 10+ Year Total Return Index tracks investment-grade government and government-related bonds with maturities of 10 years or greater. Past performance is no guarantee of future results.
United States
U.S. equities extended their gains in May, reaching fresh record highs, though leadership was largely concentrated in technology and AI-related companies. The PHLX Semiconductor Index (SOX) gained more than 20% in May, having rallied nearly 70% since the end of March. Energy stocks slid for a second straight month as oil prices eased amid Iran deal optimism, though energy remained the best-performing sector on a year-to-date basis.
- The S&P 500® Index rose 5.3% in May, reaching a new all-time high and recording a streak of nine consecutive weekly gains.
- The S&P 500 Equal Weight Index gained 2.7%, underperforming the cap-weighted index, though it closed the gap in the second half of the month.
- The Nasdaq Composite jumped 8.4%, following April’s 15% gain, closing at a new record high.
- The small-cap Russell 2000 Index rose 4.4% in May, after rallying more than 12% in April.
- Growth outperformed value, with the Russell 1000 Growth Index rising 7.2% versus a 2.9% gain for the Russell 1000 Value Index. The Russell 2500 Growth Index gained 7.3%, while its value counterpart rose 3.0%.
Technology drove the gains, while energy and utilities lagged
S&P 500 sector performance (May and year to date)
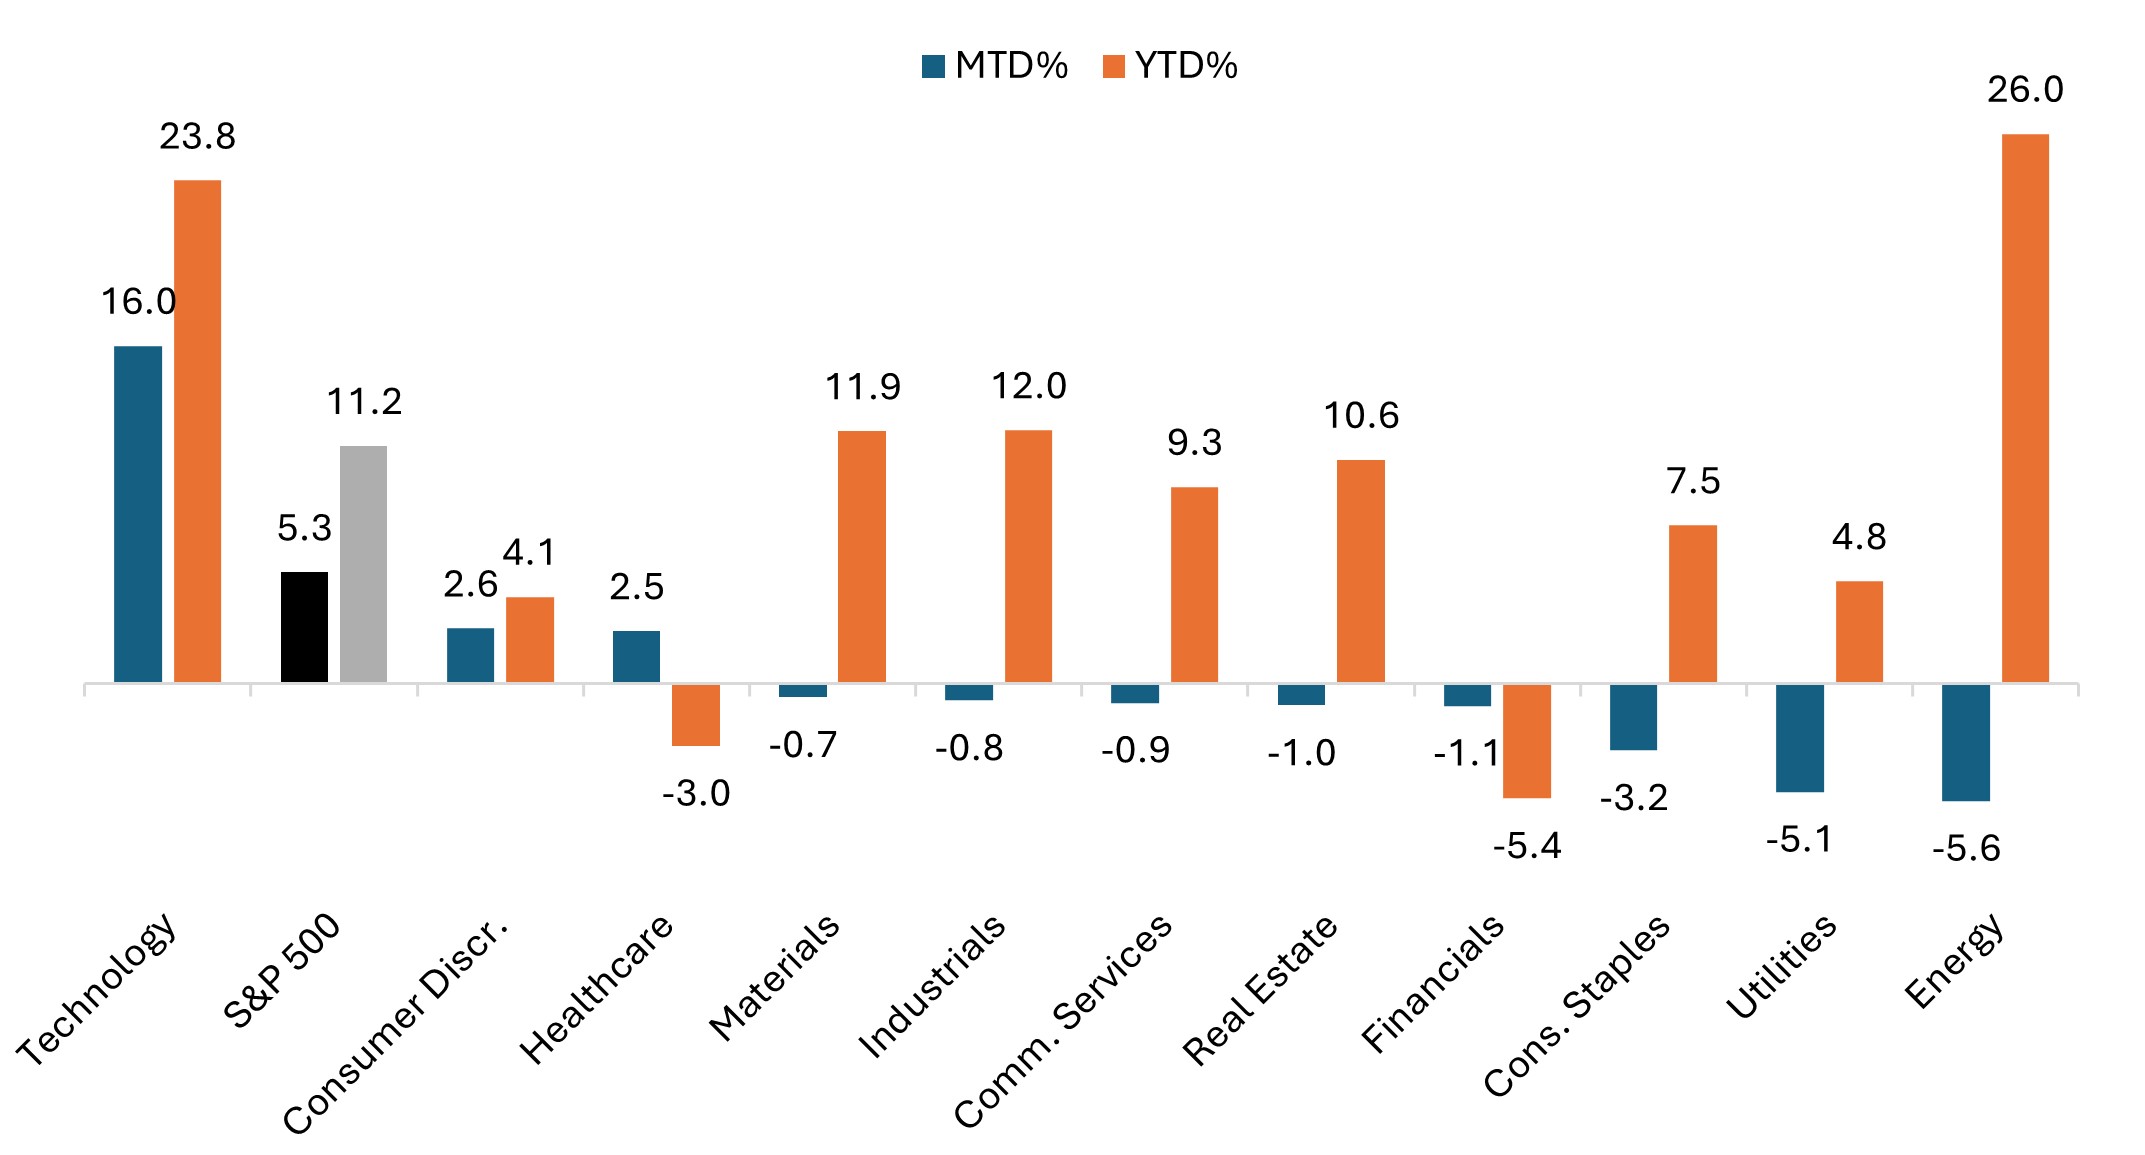
Source: Bloomberg, as of 31 May 2026. Past performance is no guarantee of future results.
U.S. economic data pointed to continued labor market resilience, alongside firmer inflation and mixed activity signals:
- April nonfarm payrolls rose by 115,000, exceeding expectations for a ~60,000 gain, while the unemployment rate held steady at 4.3%. The report follows an upwardly revised 185,000 increase in March, marking the first back-to-back monthly rise in employment in nearly a year.
- Inflation surprised to the upside, as the April Consumer Price Index (CPI) rose 3.8% year over year, up from 3.3% in March and marking the highest reading since May 2023. Core CPI increased 2.8% year over year, up from 2.6%. Meanwhile, the Producer Price Index (PPI) rose1.4% month over month – its largest increase since March 2022 – and 6.0% year over year, both well ahead of expectations.
- Activity data was mixed. S&P Global flash May Purchasing Managers’ Index (PMI) showed manufacturing strengthened while services softened modestly. The manufacturing PMI rose to 55.3 (from 54.5 in April), the highest in over four years, while the services PMI edged down to 50.9 (from 51.0). The release also highlighted increased stockpiling behavior, alongside a sharp rise in input cost pressures.
- The second estimate of U.S. Gross Domestic Product (GDP) growth for the first quarter was revised down to 1.6% from the 2.0% advance estimate, though it still represented a pickup from the 0.5% growth in Q4 2025.
Europe
Eurozone equities advanced in May, supported by strength in the region’s AI-related technology stocks, while a pullback in crude prices helped ease pressure on inflation expectations, bond yields, and sectors exposed to higher fuel costs. The MSCI Europe ex United Kingdom Index rose 4.3% in euro terms and 3.8% in U.S. dollar terms, ending the month just shy of levels seen before the start of the Iran conflict. That said, the macro backdrop remained volatile, and the economic outlook deteriorated further across the continent.
- Final Eurozone CPI for April was confirmed at 3.0% year over year, unchanged from the preliminary estimate. Eurostat’s flash estimate for May, released on June 2, pointed to CPI rising 3.2% year over year, the highest since February 2023.
- European Central Bank (ECB) communication remained hawkish, with policymakers signaling a likely rate hike in the near term. As of the end of May, markets were pricing in a roughly 90% chance of a rate hike at the upcoming June meeting.
- Economic growth indicators remained subdued. Eurozone GDP for the first quarter was confirmed at 0.8% on an annual basis, matching Eurostat’s initial estimate and down from 1.3% in the prior quarter. Separately, the European Commission cut its 2026 Eurozone growth forecast to 0.9% (from 1.2%), citing the impact of higher energy prices and weaker demand.
- Eurozone PMI data suggested that business activity deteriorated further in May, with the flash composite PMI falling to 47.5 (from 48.8 in April), the sharpest pace of contraction since October 2023. The services PMI declined to 46.4 (from 47.6), its lowest level in over five years, while the manufacturing PMI remained in expansion territory at 51.4 (compared to 52.2 prior), albeit at a slower pace.
UK equities lagged broader European markets in May, as a relative lack of technology exposure limited upside. The MSCI United Kingdom Index rose 0.5% in sterling terms but declined 0.3% in U.S. dollar terms as the British pound weakened against the greenback. The FTSE All-Share Index gained 1.2% in sterling and rose 0.3% in U.S. dollars. Softer economic data contributed to a meaningful decline in UK gilt yields as markets dialed back expectations for near-term rate hikes from the Bank of England.
- Labor market conditions showed signs of softening, with the UK unemployment rate rising to 5.0% in the three months to March (from 4.9% prior), while the Office for National Statistics (ONS) estimated the number of payrolled employees fell by 100,000 in April.
- UK inflation eased more than expected as headline CPI slowed to 2.8% year over year in April (from 3.3% in March), below consensus expectations of 3.0%. Economists noted this was partly driven by government measures to reduce electricity bills compared with 2025, though inflation is widely expected to rise in the months ahead as higher energy prices feed through.
- The latest PMI data reflected a sharp decline in services activity as the flash May composite PMI fell to 48.5 (from 52.6 in April). The services PMI declined to 47.9 (from 52.7), while the manufacturing PMI held steady at 53.7, remaining in expansion territory. Separately, April retail sales fell 1.3% month over month, missing expectations and pointing to softer consumer demand.
- Political uncertainty remained at the forefront as Prime Minister Keir Starmer faced mounting pressure following Labour’s poor performance in local elections. Andy Burnham’s bid to contest a June by-election fueled speculation around a potential leadership challenge, contributing to volatility in UK government bond yields.
European equities advanced in May; UK trailed continental Europe
Gains were stronger in local currency terms as the U.S. dollar strengthened.
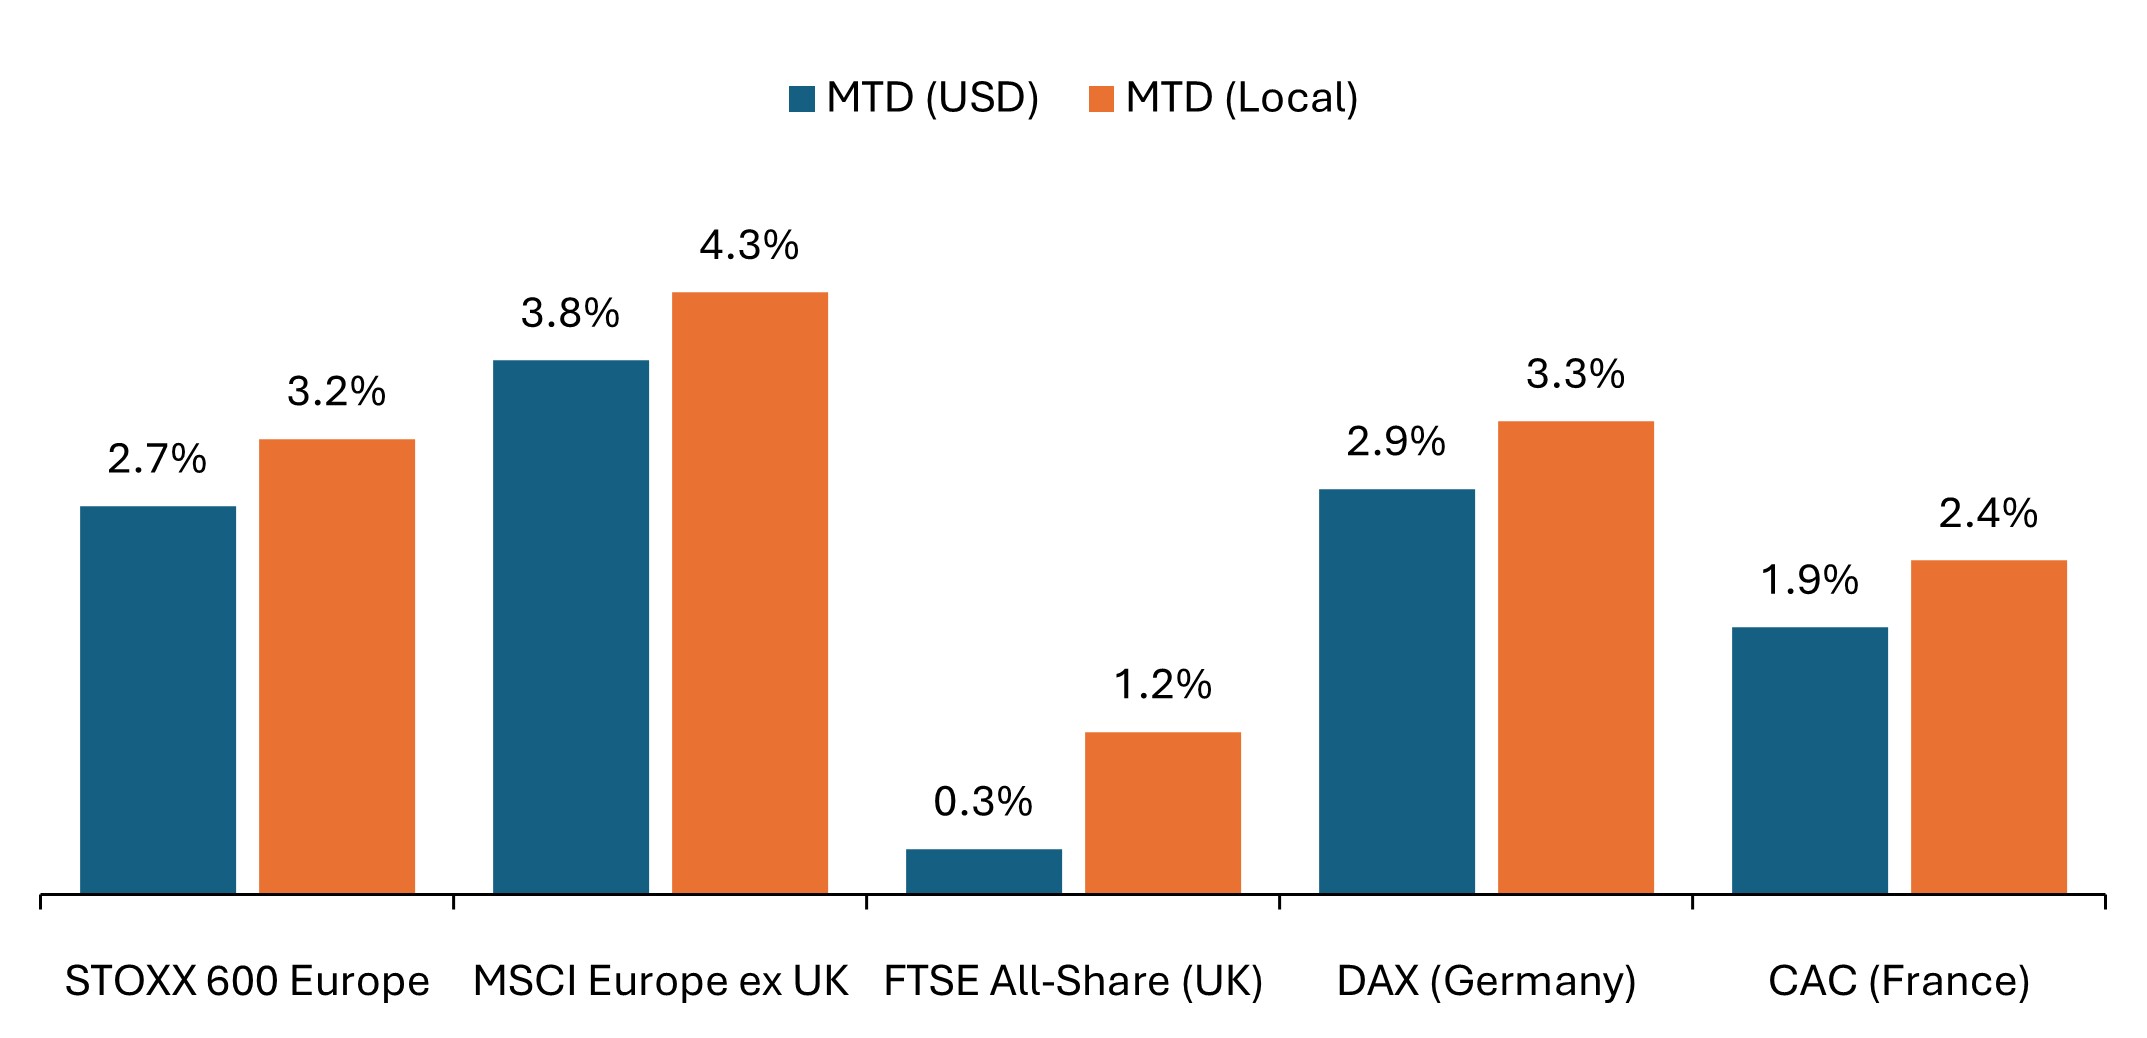
Source: Bloomberg, data as of 31 May 2026. Past performance is no guarantee of future results.
Across the STOXX 600 Index – comprising companies from 17 countries across developed Europe including the UK – sector performance was broadly positive.
- Technology (+12.0% in euro terms) led the advance, supported by continued momentum in AI‑related spending. Basic Resources (+9.1%) also posted strong gains, benefiting from higher metal prices, notably copper, while Travel & Leisure (+9.9%), Consumer (+8.2%) and Retail (+6.0%) were supported by easing fuel-cost pressures and improved consumer sentiment.
- Media (+6.4%) and Telecom (+4.8%) saw good monthly gains. Banks (+5.6%) outperformed relative to Financial Services (+2.6), while Insurance (+0.1%) was little changed. Industrials (+4.1%) delivered solid returns, while Construction & Materials (+1.2%) rose modestly.
- Defensive sectors underperformed amid sector rotation into more risk-on segments. Food, Beverage & Tobacco (+2.5%), Healthcare (+2.2%), and Real Estate (+0.6%) posted modest monthly gains.
- Energy (-6.4%) was the worst-performing sector, reflecting the sharp decline in oil prices during the month, while Utilities (-4.8%) also fell alongside the pullback in bond yields.
Asia Pacific
Japanese equities advanced in May, led by AI-related technology stocks. The TOPIX rose 6.2% in local currency terms and 4.4% in U.S. dollars as the yen weakened against the dollar. The Nikkei 225 surged 11.9% in yen terms and 10.0% in dollars, with the price-weighted benchmark meaningfully outperforming the market cap-weighted TOPIX for a second straight month owing to larger representation from AI-exposed tech stocks.
- Japanese inflation data was mixed. April core CPI eased to 1.4% year over year, a four‑year low, though the Bank of Japan’s new underlying inflation gauge – which excludes one-off factors such as education and energy subsidies – rose to 2.8% (from 2.5%). Meanwhile, wholesale inflation jumped 4.9% year over year, the fastest pace in three years, reinforcing the case for further BoJ policy tightening.
- Economic growth remained resilient in the first quarter, with Q1 GDP expanding at an annualized 2.1%, supported by consumption and exports, though the data largely predated the full impact of higher energy costs.
- Activity indicators pointed to slowing momentum as May flash PMI slipped to a five‑month low. The composite PMI fell to 51.1 (from 52.2), with services PMI stalling at 50.0. Manufacturing PMI remained strong but eased to 54.5 (from 55.1 in April), while input costs rose at the fastest pace since 2022.
Equity markets across Asia Pacific ex Japan were mostly higher, with tech-heavy benchmarks experiencing the strongest returns. The MSCI AC Asia Pacific ex Japan Index rose 10.0% in U.S. dollar terms, with outsized contributions from South Korea and Taiwan amid continued strength in AI-related semiconductors and memory chipmakers. Conversely, the MSCI China Index fell 3.0% in U.S. dollar terms amid an uncertain economic backdrop and mixed sentiment toward Chinese equities. Australia’s ASX gained 1.4% in U.S. dollars terms and 1.3% in AUD. On May 5, the Reserve Bank of Australia (RBA) moved forward with a third consecutive rate hike, as expected, though softer economic data during the month dampened expectations for further rate increases.
Emerging Markets
Emerging market equities advanced in May, led by continued strength in tech-heavy Asian markets, while returns across Latin America and EMEA were mixed. The MSCI Emerging Markets Index rose 9.7% in U.S. dollar terms, building on April’s strong performance. Performance figures below reference MSCI country indices reported in U.S. dollar terms.
- South Korea (+35.0%) and Taiwan (+16.3%) extended their year-to-date gains, bolstered by heavy exposure to AI-related semis and memory chipmakers. Conversely, Indonesia (-12.3%) came under pressure amid growing policy uncertainty and investor concerns around moves to increase state control over key commodity exports. Malaysia (-1.7%) and the Philippines (-1.1%) also underperformed.
- Latin America equities saw mixed results, with the MSCI EM Latin America Index falling 4.1% in U.S. dollar terms. Brazil (9.1%) posted its steepest monthly decline since February 2023, driven in part by foreign capital outflows. Argentina (+12.1%) rallied amid signs of progress on the government’s economic reform agenda, with Fitch raising the country’s sovereign credit rating to B- from CCC+ early in the month. Peru (+11.9%) also posted strong gains, with its mining-heavy index benefiting from higher copper prices, while Mexico (+3.7%), Colombia (+0.6%), and Chile (+0.2%) also advanced.
- In EMEA, performance remained highly uneven. Poland (+7.3%) and Hungary (+3.6%) delivered solid gains, while Turkey (-8.4%) fell amid renewed political uncertainty, following a court ruling that removed a prominent opposition leader. South Africa (+2.5%) posted a modest gain.
- India (-0.4%) ended the month modestly lower, with Prime Minister Modi highlighting the need to ease pressure on foreign exchange reserves amid continued currency weakness.
Fixed Income
Global government bonds delivered modest positive returns, despite a volatile geopolitical backdrop that contributed to large swings in yields. Sovereign yields rose sharply into mid-May before pulling back late in the month. Still, long-dated bond yields remained well above levels seen before the start of the Iran conflict.
- The Bloomberg Global Treasury Index gained 0.5% in U.S. dollar-hedged terms.
- The U.S. Treasury curve shifted slightly higher, continuing the recent bear-flattening trend. The spread between 10-year and 2-year yields narrowed from 50 bps at the start of the month to 43 bps at the end of May.
- The U.S. 10-year Treasury yield rose to 4.44%, though it ended the month well below its peak of nearly 4.7% on May 19.
U.S. Treasury yield curve (month-on-month change)
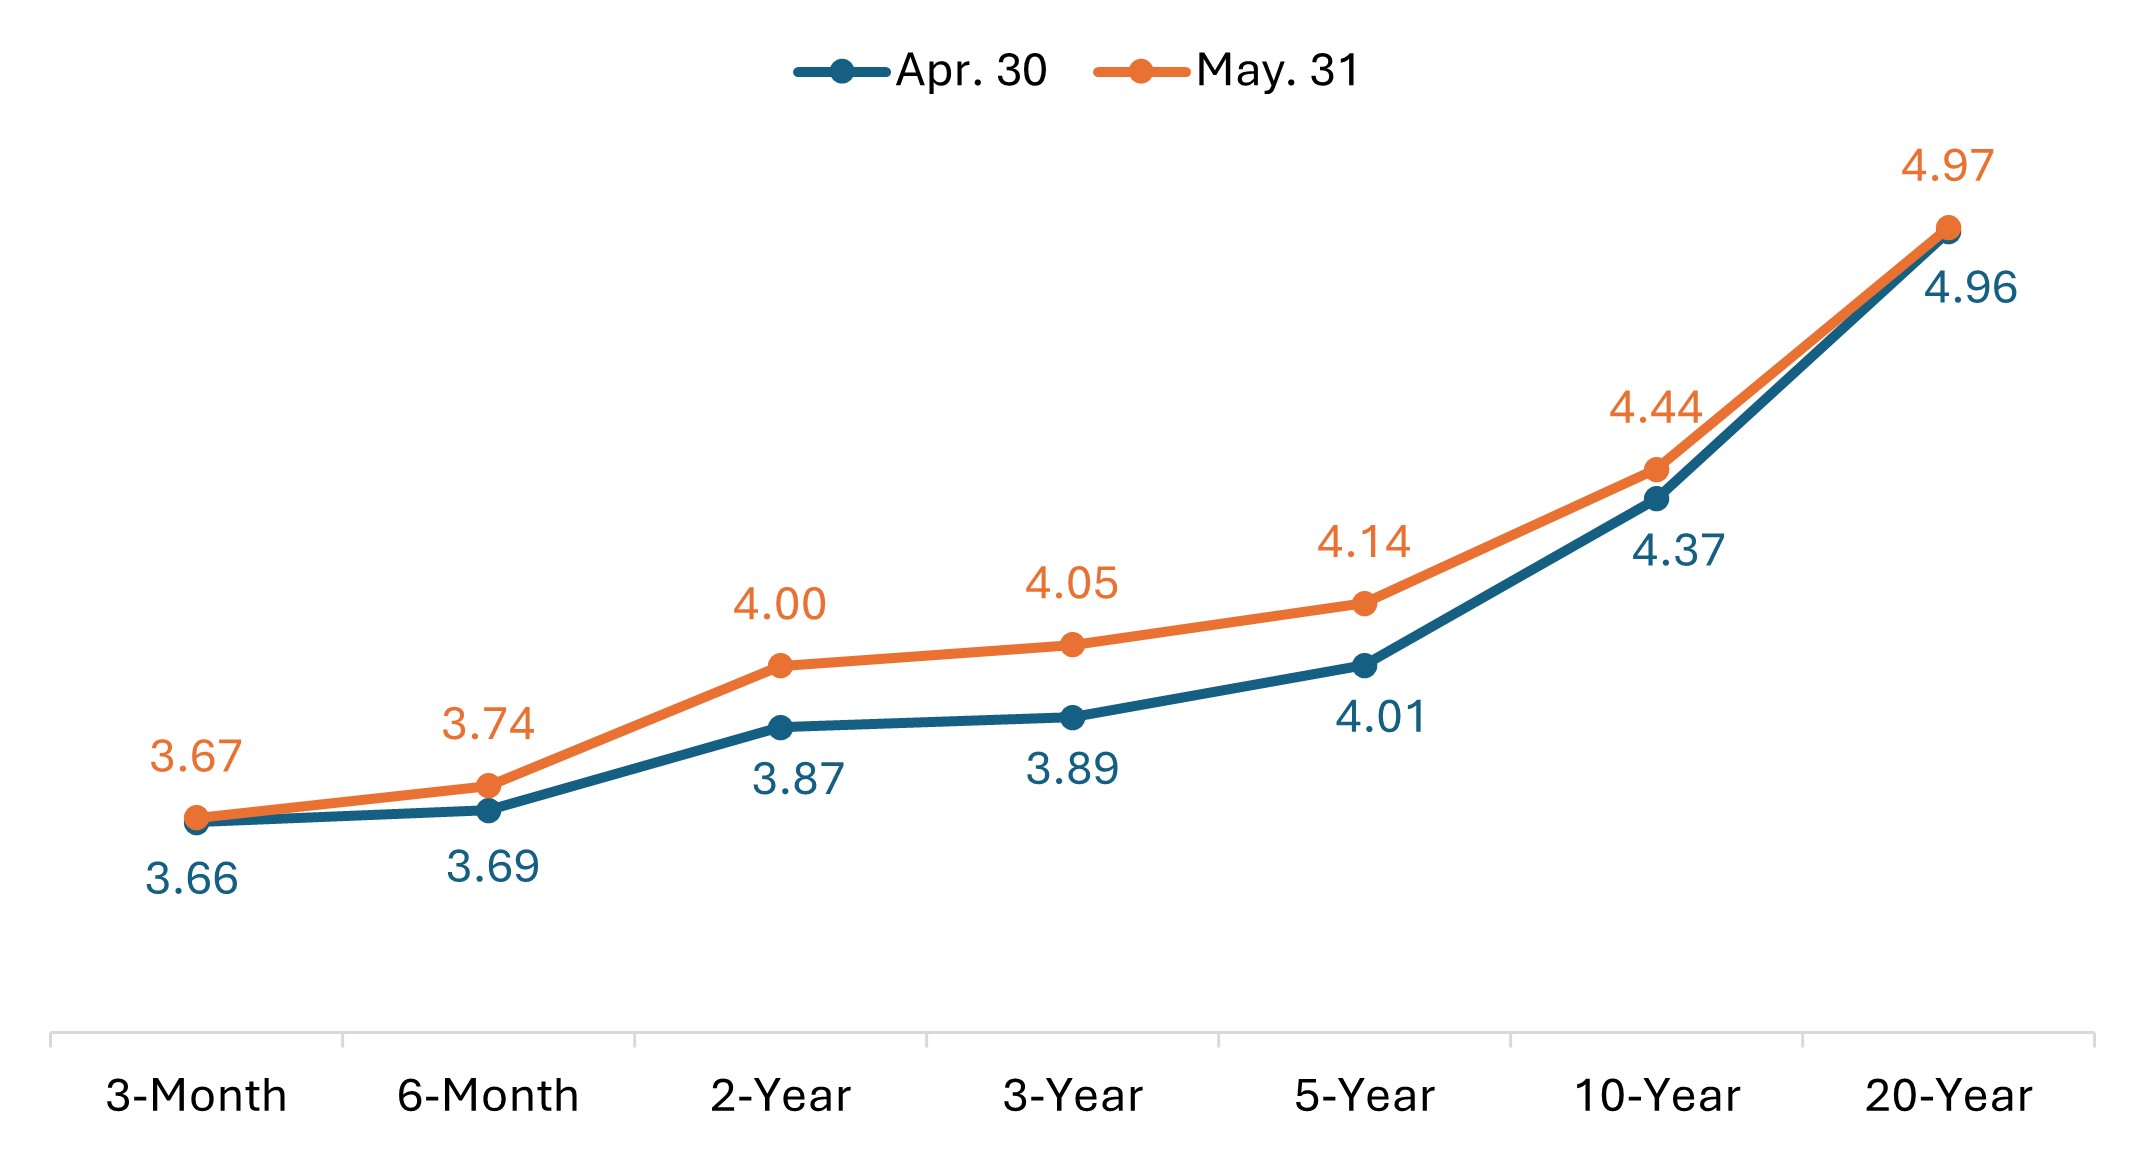
Source: Bloomberg, as of 31 May 2026. Past performance is no guarantee of future results.
- In Europe, UK government bonds delivered strong returns, despite volatility driven by political instability and fiscal concerns, as yields fell sharply late in the month. The 10-year gilt yield declined roughly 20 bps over the month, having initially risen to nearly 5.2% before retreating to end the period just above 4.8%.
- German sovereign bonds also outperformed. The yield on the 10-year bund fell by approximately 10 bps.
- Japanese government bonds (JGB) fell as yields continued their rise amid expectations for further BoJ tightening. The yield on the 10-year JGB increased by roughly 17 bps, reaching its highest level since 1997.
Spread sectors delivered positive returns in May, with option-adjusted spreads (OAS) narrowing amid resilient risk sentiment, despite volatility in rates and geopolitics. Returns were more muted relative to April’s risk-on backdrop, and performance across credit segments was more mixed.
- The Bloomberg Global Aggregate Corporate Index rose 0.6% in U.S. dollar terms, while the Bloomberg Global High Yield Index returned 0.7%.
- Global investment-grade spreads narrowed by approximately 5 bps, while high-yield spreads narrowed by roughly 11 bps.
- U.S. investment-grade corporates outperformed, with the Bloomberg U.S. Corporate Index returning 0.8%, compared to 0.5% for high yield.
- U.S. investment-grade spreads narrowed by approximately 6 bps in May. U.S. high-yield spreads narrowed by roughly 11 bps.
- In securitized markets, asset-backed securities (ABS) and mortgage-backed securities (MBS) spreads narrowed by approximately 2 to 3 bps, with benchmarks delivering modestly positive monthly returns.
Central Bank Watch
May brought a lighter calendar of major central bank meetings, but the hawkish tilt across global monetary policy broadly held. In the U.S., Kevin Warsh was sworn in as Federal Reserve chair, while hawkish takeaways from the April FOMC minutes supported a shift in market expectations toward a possible hike by year end. The European Central Bank’s (ECB) June meeting is shaping up as a near-certain hike, while the Bank of Japan is widely expected to raise rates in June or July. In contrast, markets modestly dialed back near-term tightening expectations for the Bank of England as softer UK data reduced the urgency for rate hikes.
- Reserve Bank of Australia (May 5): The RBA raised its cash rate by 25 bps to 4.35%, its third consecutive increase. Minutes released on May 19 showed the board noted the move would give it “space to monitor” how households and firms respond to the Middle East energy shock, while Governor Bullock signaled the central bank is now in more of a wait-and-see posture.
- People’s Bank of China (May 20): The PBOC left its one-year and five-year loan prime rates unchanged for a twelfth consecutive month, at 3.0% and 3.5% respectively, in line with expectations. Separately, the central bank allowed its one-year Medium-Term Lending Facility rate to fall to a record low of 1.45% from 1.5%, signaling a continued easing bias as Beijing steps up efforts to support a sluggish economy.
- Bank of Korea (May 28): The BOK held its seven-day repurchase rate at 2.5% for an eighth consecutive meeting, but in a more divided 5-2 vote. The two dissenting members called for an immediate 25 bp hike to 2.75%. New Governor Shin Hyun Song struck a hawkish tone, citing intensifying inflation pressures from the Middle East conflict and a booming semiconductor sector.
- Reserve Bank of New Zealand (May 27): The RBNZ held its Official Cash Rate at 2.25% for a third consecutive meeting, but only after a dramatic 3-3 split on the Monetary Policy Committee was resolved by Governor Anna Breman’s casting vote. Three members preferred an immediate 25 bp hike, and the RBNZ’s updated forecasts signal at least two 25 bp hikes before year-end. The New Zealand dollar rallied more than 1% against the greenback following the decision.
- Other central banks: Rate decisions elsewhere reflected the divergent policy paths across developing markets. Poland (May 6) held its benchmark rate at 3.75% but Governor Glapinski struck a hawkish tone saying rate hikes are now “more likely” than cuts. Mexico (May 7) cut its benchmark rate by 25 bps to 6.50% in a split 3-2 vote, declaring its two-year easing cycle over. Indonesia (May 20) delivered a surprise 50 bp hike to 5.25%, exceeding the 25 bp consensus, in a defensive move to stem currency depreciation and capital outflows. Hungary (May 26) held its base rate at 6.25% in a split decision, signaling a possible cut as early as June as currency appreciation helped moderate the inflation outlook. South Africa (May 28) raised its repo rate by 25 bps to 7% in a 4-2 vote, its first hike since 2023, while sharply revising its 2026 CPI forecast to 4.4% from 3.7% and hinting that further tightening may follow if the Iran conflict persists.
Key events on tap in June
- Jun. 1, 2 – Global Manufacturing PMIs (May, final)
- Jun. 3 – Global Services and Composite PMIs (May, final)
- Jun. 5 – U.S. Nonfarm Payrolls, Unemployment Rate (May)
- Jun. 10 – U.S. Consumer Price Index (May)
- Jun. 10 – Bank of Canada (BoC) Rate Decision
- Jun. 11 – European Central Bank (ECB) Rate Decision
- Jun. 16 – Bank of Japan (BoJ) Rate Decision
- Jun. 17 – UK Consumer Price Index (May)
- Jun. 17 – Eurozone Consumer Price Index (May, final)
- Jun. 17 – FOMC (Fed) Rate Decision
- Jun. 18 – Bank of England (BoE) Rate Decision
- Jun. 22 – People’s Bank of China (PBOC) Rate Decision
- Jun. 23 – Global PMIs (June, flash estimate)
- Jun. 25 – U.S. Core PCE Price Index (May) / GDP (Q1, third estimate)
- Jun. 30 – UK Gross Domestic Product (Q1, final)
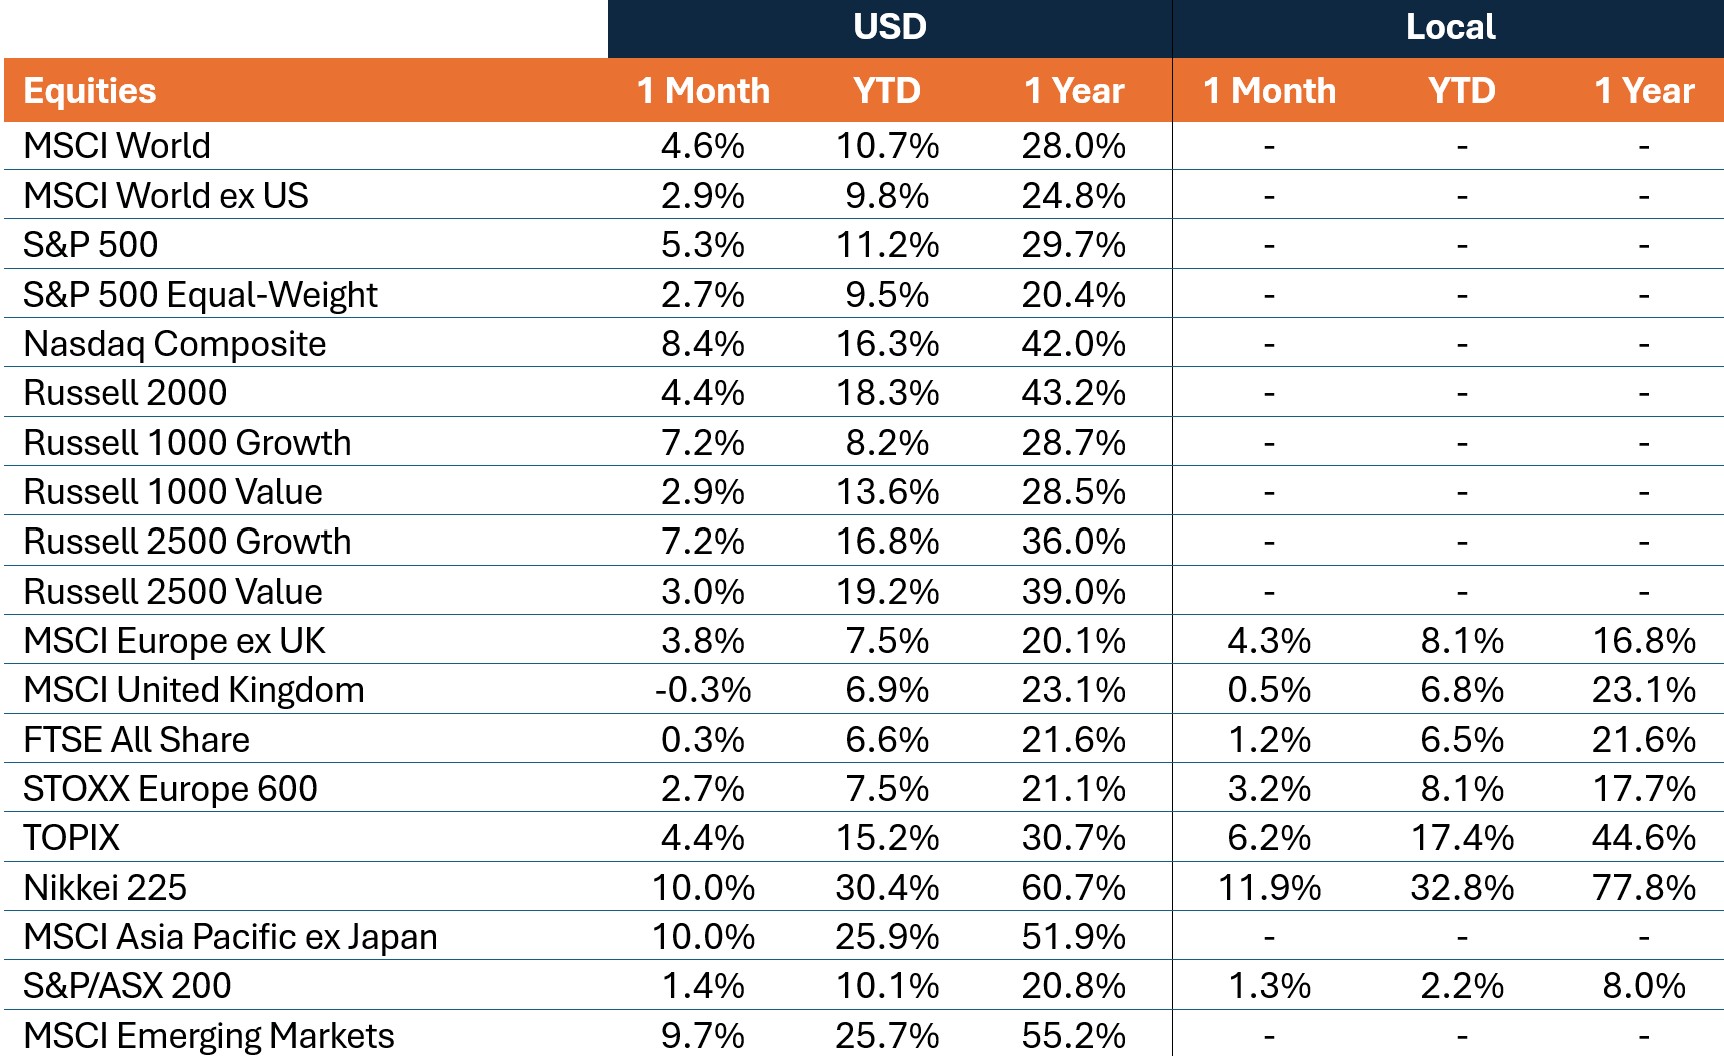
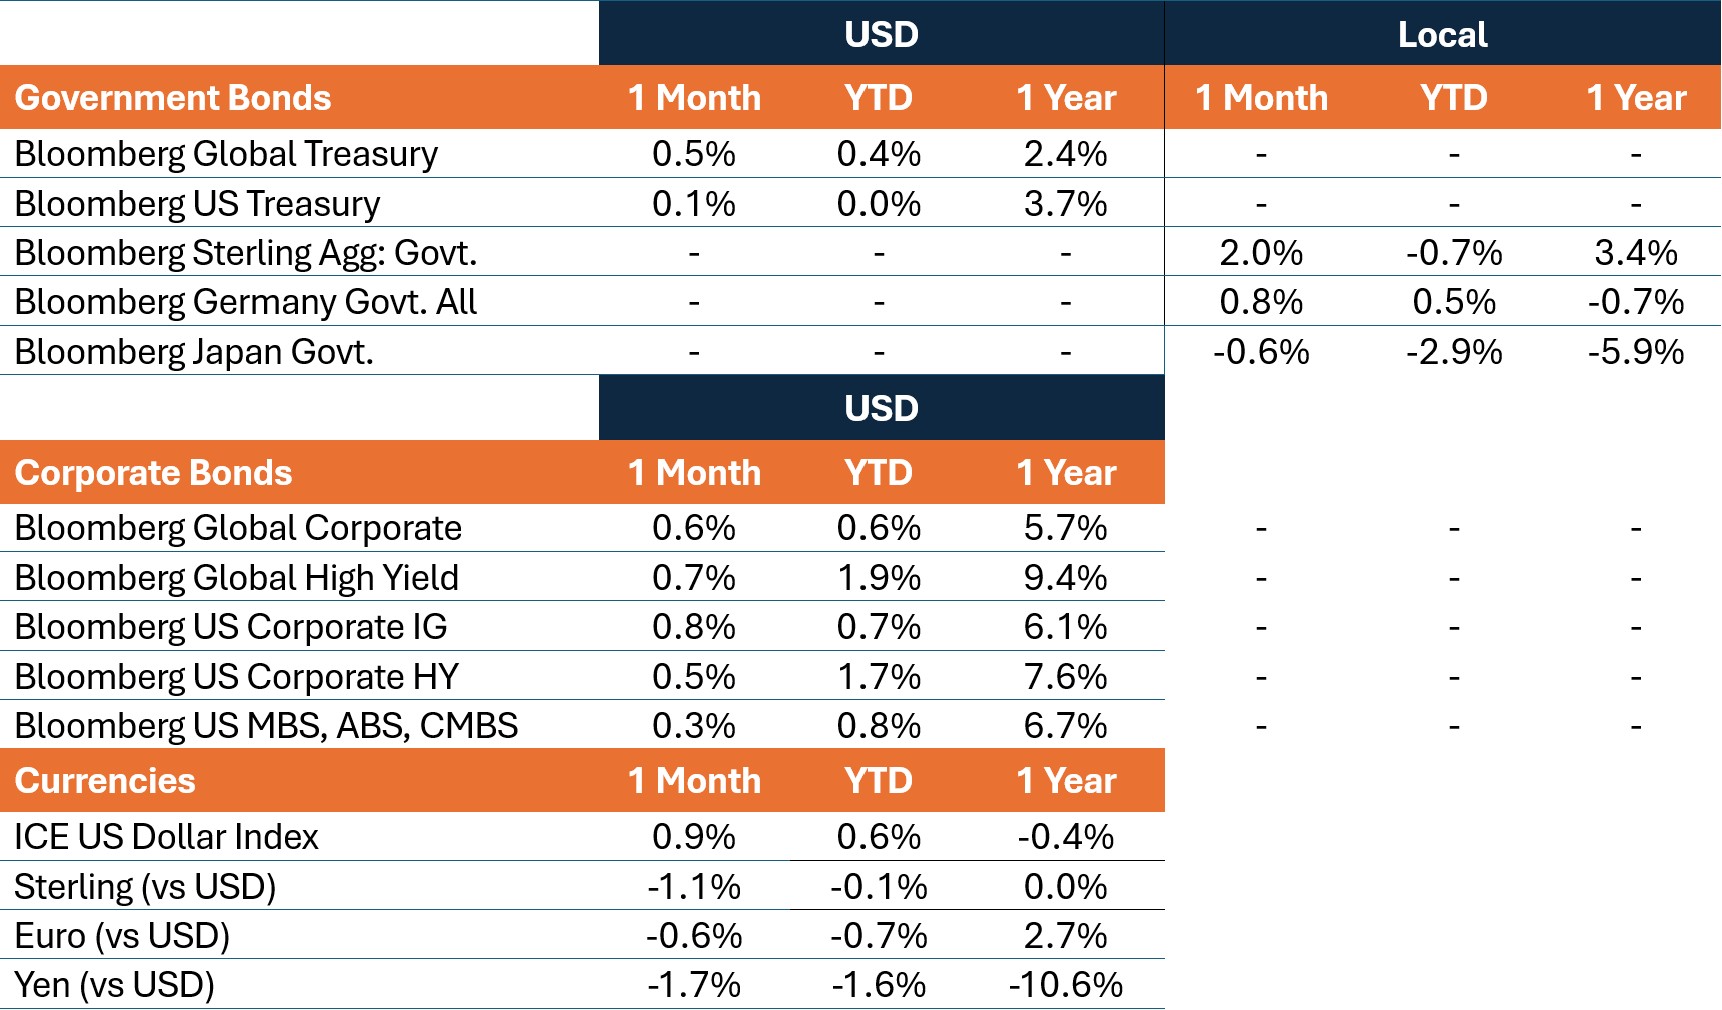
Market Performance
Total returns (%), periods ended May 31, 2026
IMPORTANT INFORMATION
Artificial intelligence (“AI”) focused companies, including those that develop or utilize AI technologies, may face rapid product obsolescence, intense competition, and increased regulatory scrutiny. These companies often rely heavily on intellectual property, invest significantly in research and development, and depend on maintaining and growing consumer demand. Their securities may be more volatile than those of companies offering more established technologies and may be affected by risks tied to the use of AI in business operations, including legal liability or reputational harm.
Equity securities are subject to risks including market risk. Returns will fluctuate in response to issuer, political and economic developments.
Fixed income securities are subject to interest rate, inflation, credit and default risk. As interest rates rise, bond prices usually fall, and vice versa. High-yield bonds, or “junk” bonds, involve a greater risk of default and price volatility. Foreign securities, including sovereign debt, are subject to currency fluctuations, political and economic uncertainty and increased volatility and lower liquidity, all of which are magnified in emerging markets.
Securitized products, such as mortgage- and asset-backed securities, are more sensitive to interest rate changes, have extension and prepayment risk, and are subject to more credit, valuation and liquidity risk than other fixed-income securities.
Bloomberg Asian-Pacific Japan Government-Related Index is a fixed-rate, investment grade, JPY-denominated benchmark that includes debt from government-related issuers.
Bloomberg Germany Government All Bonds Index measures the performance of German government bonds (Bunds) issued by the German government.
Bloomberg Global 10+ Year Total Return Index tracks investment-grade government and government-related bonds with maturities of 10 years or greater.
Bloomberg Global Aggregate – Corporate Index is a flagship measure of global investment grade, fixed-rate corporate debt. This multi-currency benchmark includes bonds from developed and emerging markets issuers.
Bloomberg Global High Yield Index is a multi-currency flagship measure of the global high yield debt market. The index represents the union of the US High Yield, the Pan-European High Yield, and Emerging Markets (EM) Hard Currency High Yield Indices.
Bloomberg Global Treasury Index tracks fixed-rate, local currency government debt of investment grade countries, including both developed and emerging markets.
Bloomberg Sterling Aggregate: Government Index measures the performance of UK government bonds (Gilts) within the broader Bloomberg Sterling Aggregate Index, which covers the investment-grade, fixed-rate, sterling-denominated bond market.
Bloomberg US Corporate Bond Index measures the investment grade, fixed-rate, taxable corporate bond market. It includes USD-denominated securities from US and non-US issuers.
Bloomberg US Corporate High Yield Bond Index measures the USD-denominated, high yield, fixed-rate corporate bond market. Bonds from issuers with an emerging markets country of risk, based on Bloomberg EM country definition, are excluded.
Bloomberg US Securitized: MBS, ABS, and CMBS Index tracks all USD-denominated, investment grade, securitized issues within the Bloomberg US Aggregate Index.
Bloomberg US Treasury Index measures U.S. dollar-denominated, fixed-rate, nominal debt issued by the U.S. Treasury.
The DAX is a blue-chip stock market index consisting of the 40 major German companies trading on the Frankfurt Stock Exchange.
The France CAC 40 Index is a market value weighted index, composed of the 40 highest levels among the 100 highest market caps on the Paris Bourse.
FTSE All-Share Index reflects the equity market performance of the United Kingdom. The index includes nearly all eligible companies on the London Stock Exchange, covering large, mid, and small-cap stocks.
ICE U.S. Dollar Index is a benchmark measuring the U.S. dollar’s value against a basket of six major world currencies (Euro, Yen, Pound Sterling, Canadian Dollar, Swedish Krona, Swiss Franc).
MSCI AC Asia Pacific ex Japan Index reflects the equity market performance of the Asia Pacific region, excluding Japan, covering both developed and emerging markets.
MSCI ACWI ex USA Index captures large- and mid-cap representation across 22 of 23 developed markets (excluding the US) and 24 emerging markets countries.
MSCI China Index captures large and mid cap representation across China A shares, H shares, B shares, Red chips, P chips and foreign listings (e.g. ADRs).
MSCI Emerging Markets Index reflects the equity market performance of emerging markets.
MSCI Emerging Markets (EM) Latin America Index captures large and mid cap representation across Emerging Markets (EM) countries in Latin America. The index covers approximately 85% of the free float-adjusted market capitalization in each country.
MSCI Europe Index reflects the equity market performance of large and mid-sized companies listed in developed markets in Europe.
MSCI Europe ex UK Index reflects the equity market performance of large and mid-sized companies listed in developed markets in Europe excluding the United Kingdom.
MSCI United Kingdom Index reflects the equity market performance of large and mid-sized companies listed in the UK market.
MSCI World Index captures large- and mid-cap representation across 22 of 23 developed markets countries, excluding the United States.
MSCI World ex USA Index reflects the equity market performance of global developed markets excluding the United States.
NASDAQ Composite Stock Index: National Association of Securities Dealers Automated Quotation System (NASDAQ) is a nationwide computerized quotation system for over 5,500 over-the-counter stocks. The index is compiled of more than 4,800 stocks that are traded via this system.
Nikkei 225 Index (also known as Nikkei Stock Average): A measure of Japanese equity market performance. The index includes 225 of the largest companies listed on the Tokyo Stock Exchange.
The PHLX Semiconductor Sector Index (SOX) is a specialized, modified market capitalization-weighted index composed of companies primarily involved in the design, distribution, manufacture, and sale of semiconductors.
Purchasing Managers’ Index (PMI) is an index of the prevailing direction of economic trends in the manufacturing and service sectors, based on a survey of private sector companies.
Russell 1000® Growth Index reflects the performance of U.S. large-cap equities with higher price-to-book ratios and higher forecasted growth values.
Russell 1000® Value Index reflects the performance of U.S. large-cap equities with lower price-to-book ratios and lower forecasted growth values.
Russell 2000® Index reflects the performance of U.S. small-cap equities.
Russell 2500™ Growth Index reflects the performance of U.S. small to mid-cap equities with higher price-to-book ratios and higher forecasted growth values.
Russell 2500™ Value Index reflects the performance of U.S. small to mid-cap equities with lower price-to-book ratios and lower forecasted growth values.
S&P 500® Index reflects U.S. large-cap equity performance and represents broad U.S. equity market performance.
S&P 500® Equal Weight Index (EWI) is the equal-weight version of the S&P 500. The index includes the same constituents as the capitalization weighted index, but each company is allocated a fixed weight – or 0.2% of the index total at each quarterly rebalance.
S&P/ASX 200 Index reflects the performance of the 200 largest, most liquid companies listed on the Australian Securities Exchange (ASX).
STOXX Europe 600 Index: An index of the 600 largest listed stocks in the European equity market, comprising 17 countries and 11 industries
TOPIX: A capitalization-weighted index of all the companies listed on the First Section of the Tokyo Stock Exchange and is widely regarded as a broad benchmark for Japanese stock prices.
10-year bond: A bond that is set to mature (repay the principal value) in 10 years.
10-Year Treasury Yield is the interest rate on U.S. Treasury bonds that will mature 10 years from the date of purchase.
Agency Mortgage-backed Securities (Agency MBS): A type of asset-backed security that is specifically secured by a collection of mortgages.
Asset-backed Securities (ABS): These are financial instruments that are backed by a pool of assets—typically those that generate a cash flow from debt, such as loans, leases, credit card balances, or receivables.
Basis point: One basis point (bp) equals 1/100 of a percentage point, 1bp = 0.01%.
Bund yield: Bund yields are viewed as benchmark yield indicators for European government bonds; those with a 10-year maturity are considered to be the German equivalent of U.S. Treasury bonds.
Commercial Mortgage-backed Securities (CMBS): A type of mortgage-backed security that is secured by the loan on commercial real estate properties rather than residential real estate.
Consumer Price Index (CPI): A measure that examines the price change of a basket of consumer goods and services over time. It is used to estimate inflation.
Credit spread: The difference in yield between securities with similar maturity but different credit quality. Widening spreads generally indicate deteriorating creditworthiness of corporate borrowers, and narrowing indicate improving.
Curve/Yield curve: A yield curve plots the yields (interest rate) of bonds with equal credit quality but differing maturity dates. Typically bonds with longer maturities have higher yields.
The Federal Open Market Committee (FOMC) is the body of the Federal Reserve System that sets national monetary policy.
Fiscal policy: Describes government policy relating to setting tax rates and spending levels. Fiscal policy is separate from monetary policy, which is typically set by a central bank.
Gilt yield: Gilt yields are viewed as benchmark yield indicators for United Kingdom government bonds; those with a 10-year maturity are considered to be the UK equivalent of U.S. Treasury bonds.
Hawkish policy aims to curb inflation and slow down growth in the economy by raising interest rates and reducing the supply of money.
High yield bond: Also known as a sub-investment grade bond, or ‘junk’ bond. These bonds usually carry a higher risk of the issuer defaulting on their payments, so they are typically issued with a higher interest rate (coupon) to compensate for the additional risk.
Inflation: The rate at which the prices of goods and services are rising in an economy. The Consumer Price Index (CPI) and Retail Price Index (RPI) are two common measures.
Investment grade bond: A bond typically issued by governments or companies perceived to have a relatively low risk of defaulting on their payments, reflected in the higher rating given to them by credit ratings agencies.
JGB yield: JGB yields are viewed as benchmark yield indicators for Japanese government bonds; those with a 10-year maturity are considered to be the Japanese equivalent of U.S. Treasury bonds.
Monetary policy: The policies of a central bank, aimed at influencing the level of inflation and growth in an economy. Monetary policy tools include setting interest rates and controlling the supply of money. Dovish policy aims to stimulate economic growth by lowering interest rates and increasing the money supply.
Option-Adjusted Spread (OAS) measures the spread between a fixed-income security rate and the risk-free rate of return, which is adjusted to take into account an embedded option.
Producer Price Index (PPI) measures the average change over time in the selling prices received by domestic producers for their output.
Securitization: The process in which certain types of assets are pooled so that they can be repackaged into interest-bearing securities. The interest and principal payments from the assets are passed through to the purchasers of the securities.
U.S. Treasury securities are direct debt obligations issued by the U.S. Government. Treasury Bills and U.S. Government Bonds are guaranteed by the full faith and credit of the U.S. government, are generally considered to be free of credit risk.
Volatility measures risk using the dispersion of returns for a given investment.
Quantitative Easing (QE) is a government monetary policy occasionally used to increase the money supply by buying government securities or other securities from the market.
Yield: The level of income on a security over a set period, typically expressed as a percentage rate. For equities, a common measure is the dividend yield, which divides recent dividend payments for each share by the share price. For a bond, this is calculated as the coupon payment divided by the current bond price.
Yield to worst (YTW) is the lowest yield a bond can achieve provided the issuer does not default and accounts for any applicable call feature (i.e., the issuer can call the bond back at a date specified in advance). At a portfolio level, this statistic represents the weighted average YTW for all the underlying issues.