
Key takeaways:
- Important economic cycles are in or nearing weak phases, implying that the global economy is more than usually vulnerable to shocks.
- Monetary trends were supportive before Gulf War III but real money growth will be squeezed by a pick-up in inflation, with possible additional drags from central bank policy tightening and reduced credit availability.
- Global nominal money growth remains moderate, arguing against a sustained inflation rise – a key difference from the 1970s.
Cycle analysis indicates that the global economy is in a time window for weakness, suggesting a significant risk that the Gulf War III shock triggers a recession. Real money trends will be key for assessing whether a negative scenario is playing out.
The housing (Kuznets), business investment (Juglar) and stockbuilding (Kitchin) cycles average 18, 9 and 3.5 years respectively.1 The most recent lows are judged to have occurred in 2009, 2020 and 2023, suggesting that the next bottoms will be reached around 2027, 2029 and 2027. All three cycles, therefore, are expected to be in downswings over the next 1-3 years.
Cycle history suggests two possibilities. If the three downswings coincide, a major recession is likely. Historical precedents include the severe global downturns of 1974-75 and 2008-09.
If the cycle lows are spaced out over several years, the template would be the early 1990s – a longer period of rolling economic weakness involving a less damaging recession.
An earlier episode of triple cycle weakness in the late 1950s was also associated with a less pronounced recession but the fall in output on that occasion was limited by strong trend economic growth, reflecting post-war reconstruction.
The impact of shocks on the global economy depends on the cyclical backdrop. Activity bounced back strongly after the 2020 covid shock partly because the stockbuilding and business investment cycles were in time windows to enter recovery phases, while the housing cycle remained in an upswing.
Similarly, economic damage from the 2022 energy shock due to Russia’s invasion of Ukraine was limited by support from the business investment and housing cycles, with only the stockbuilding cycle then in a weak phase.
The timing of the Gulf War III shock echoes the 1973 Arab oil embargo, which hit as the three cycles were peaking and resulted in synchronised and self-reinforcing downswings into 1975 lows.
There are important mitigating differences from the 1973 shock. The oil price rise has been much smaller, while the oil intensity of GDP has fallen significantly. The 1973 shock occurred against a backdrop of double-digit G7 money growth, ensuring an inflationary outcome – current expansion is still low. Surging inflation forced major monetary policy tightening, the combined result being a severe real money squeeze – see chart 1.
Chart 1: G7 Industrial Output & Real Narrow Money (% YoY)
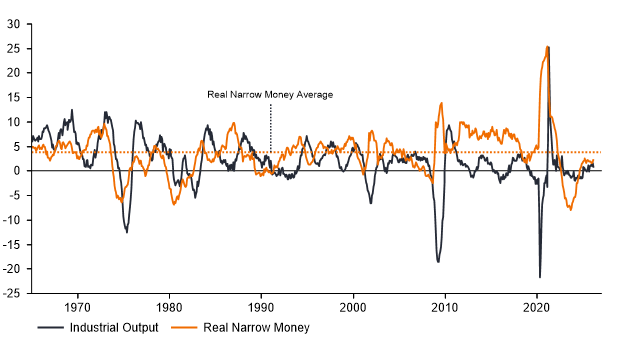
Source: LSEG Datastream, as at 15 April 2026
Real money trends appeared modestly supportive before the current shock: global / G7 growth had firmed into early 2026, suggesting that economic expansion was on course to hold up through Q3.
The mechanical impact of higher energy and other costs on consumer price inflation will ensure a sharp slowdown in real money momentum into mid-year – chart 2. The extent of the decline will be key for assessing the likely degree of economic weakness. As noted, modest money growth argues against significant “second-round” inflation effects but central banks are hinting at precautionary tightening, which would magnify monetary weakness.
Chart 2: G7 + E7 Consumer Prices & Commodity Prices (% 6m)
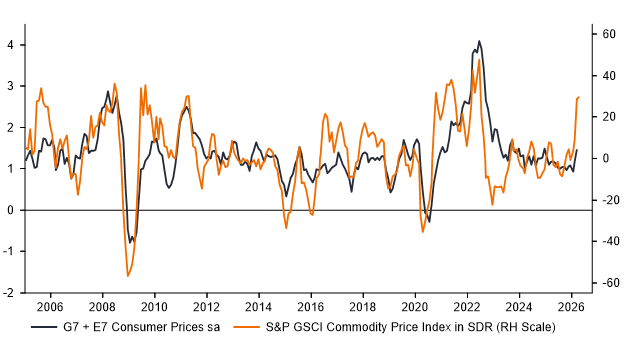
Source: LSEG Datastream, as at 15 April 2026. There is no guarantee that past trends will continue, or forecasts will be realized.
A further risk is of “endogenous” monetary tightening if the Gulf War III shock interacts with recent problems in private lending, leading to a generalised reduction in credit availability. Such a shift could be signalled in ECB and Fed loan officer surveys due in late April and early May respectively.
Country real money numbers through February suggest that US economic prospects were improving absolutely and relative to other majors before the shock – chart 3.
Chart 3: Real Narrow Money (% 6m)
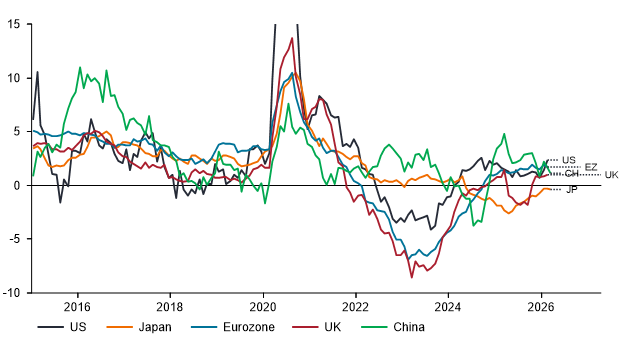
Source: LSEG Datastream, as at 15 April 2026.
Japanese monetary weakness continues to argue that BoJ policy tightening – via large-scale QT as well as rate hikes – has been misguided. As expected, core CPI inflation – ex. food and energy – has fallen and is below 2% even stripping out the impact of government subsidies.
Recoveries in Eurozone and UK real money momentum have stalled at unimpressive levels, suggesting dull economic prospects before the shock. Within the Eurozone, readings are similar across the large economies, with France no longer a negative outlier.
Chinese real money momentum has slowed but may hold up better than elsewhere going forward, reflecting stable interest rates and government intervention to limit price rises. A strong balance of payments position, partly stemming from a still significantly undervalued currency, is generating monetary inflows.
1 In economic theory, the Kitchin, Juglar, and Kuznets cycles represent distinct periodic fluctuations in economic activity, often viewed as nested within one another. The average durations of 3.5 years, 9 years, and 18 years correspond to the classic definitions of these cycles, which are driven by different underlying economic forces.
Consumer price index (CPI): A measure that examines the price change of a basket of consumer goods and services over time. It is used to estimate inflation. ‘Headline’ CPI inflation is a calculation of total inflation in an economy, and includes items such as food and energy where prices tend to be more volatile. ‘Core’ CPI inflation is a measure of inflation that excludes transitory or volatile items such as food and energy.
Commodity: A physical good such as oil, gold, or wheat.
Credit: Credit is typically defined as an agreement between a lender and a borrower. It is often narrowly used to describe corporate borrowings, which can take the form of corporate bonds, loans, or other fixed-interest asset classes.
Economic cycle: The fluctuation of the economy between expansion (growth) and contraction (recession), commonly measured in terms of gross domestic product (GDP). It is influenced by many factors, including household, government and business spending, trade, technology, and central bank policy. The economic cycle consists of four recognised stages. ‘Early cycle’ is when the economy transitions from recession to recovery; ‘mid-cycle’ is the subsequent period of positive, but more moderate growth. In the ‘late cycle’, growth slows as the economy reaches its full potential, wages start to rise, and inflation begins to pick up, leading to lower demand, falling corporate earnings, and eventually the fourth stage—recession.
Gross domestic product (GDP): GDP is a measure of the size and heath of a country’s economy over a specific period, usually either quarterly or yearly.
Inflation: The rate at which the prices of goods and services are rising in an economy. The consumer price index (CPI) and retail price index (RPI) are two common measures; the opposite of deflation.
Interest rates: The amount charged for borrowing money, shown as a percentage of the amount owed. Base interest rates (the Bank Rate) are generally set by central banks, such as the Federal Reserve in the US or Bank of England in the UK, and influence the interest rates that lenders charge to access their own lending or saving.
Monetary policy: The policies of a central bank aimed at influencing the level of inflation and growth in an economy. Monetary policy tools include setting interest rates and controlling the supply of money. Monetary stimulus refers to a central bank increasing the supply of money and lowering borrowing costs. Monetary tightening refers to central bank activity aimed at curbing inflation and slowing down growth in the economy by raising interest rates and reducing the supply of money. See also fiscal policy.
Money supply: Money supply is the total amount of money within an economy. The narrow definition of money supply includes notes and coins in circulation and money equivalents that can be converted into cash easily. The broader definition includes various kinds of longer-term, less-liquid bank deposits.
Recession: A sustained decline in economic activity, usually perceived as two consecutive quarters of economic contraction.
These are the views of the author at the time of publication and may differ from the views of other individuals/teams at Janus Henderson Investors. References made to individual securities do not constitute a recommendation to buy, sell or hold any security, investment strategy or market sector, and should not be assumed to be profitable. Janus Henderson Investors, its affiliated advisor, or its employees, may have a position in the securities mentioned.
Past performance does not predict future returns. The value of an investment and the income from it can fall as well as rise and you may not get back the amount originally invested.
The information in this article does not qualify as an investment recommendation.
There is no guarantee that past trends will continue, or forecasts will be realised.
Marketing Communication.