
Key takeaways:
- Real diversification can be difficult to achieve in today’s uncertain markets, with positive correlations between asset classes drawing attention to the structure of traditional ‘balanced’ strategies built around equities and bonds.
- With investors facing a far more polarised environment than we have seen in some years, investors might want to consider the value of a flexible liquid alternatives strategy that can potentially improve the correlation profile of a broader portfolio.
- Current interest rates suggest an arguably lower need for exposure to long-only equities in a broader portfolio. With market volatility likely to persist in 2023 and beyond, the question for investors is just how much of their equity allocation could be better invested in alternatives?
It has been a fascinating time for people who are focused on macro themes, with big changes in both politics and economies. It was our view at the start of the year that, if 2022 was the year of rising rates, then 2023 would be the year of living with them. We could see the risk of more issues across the wider economy as the year progressed. We saw risks that the fallout from rapid interest rate hikes might drive shocks to the system, which could drive a break or a change in the direction of legislation and the monetary and fiscal environment.
We said that if 2022 was the year of rising rates, then 2023 would be the year of living with them. We could see the risk of more issues across the wider economy as the year progressed.
One such point came in the banking sector in early March, when the collapse of Silicon Valley Bank (SVB) sent shockwaves through the financial system. Panicked depositors began to withdraw their money after SVB announced plans to raise $2.25 billion in capital, stoking concerns that the bank had solvency issues. The bank was forced to liquidate some of its Treasury holdings at a significant loss, and with fears growing about the risk of a 2008-style banking run, regulators were forced to step in, once again, to ward off contagion.
Thankfully, lessons had been learned from 2008. Regulators and the Fed quickly intervened to backstop deposits, creating a new lender of last resort facility (among other measures), ensuring that SVB’s travails remained idiosyncratic. But it wasn’t over. Once the dust settled, the collapse of First Republic, SVB, and Signature Bank were the second, third, and fourth biggest bank failures in US history.
The collapse of these three banks reminded us of the potentially far-reaching consequences of swift changes in monetary (and fiscal) policy. But despite these bank failures, equities continued rallying. Part of this was a response to the scale and speed of intervention, but also a sign that we might be close to a peak for the US Federal Reserve rate, with investors just buying the put to offset the risk of a market fall.
But while equities were rallying, the reaction from the bond market was completely different. Yields on 2-year Treasuries have been higher than those on offer for 10-year notes since the middle of 2022, reaching their widest margin since September 1981 in February (Exhibit 1). This created a relative value opportunity for strategies positioned to benefit from a steepening of the US curve, based on a narrowing of 2-/10-year yield spread (Exhibit 1). The collapse of SVB was the catalyst for a reversal in the US short-term rates market – a record move for 2-year rates (Exhibit 2). Short credit positions also had a brief window of opportunity to shine.
Exhibit 1: A multi-decade inversion in the US yield curve…
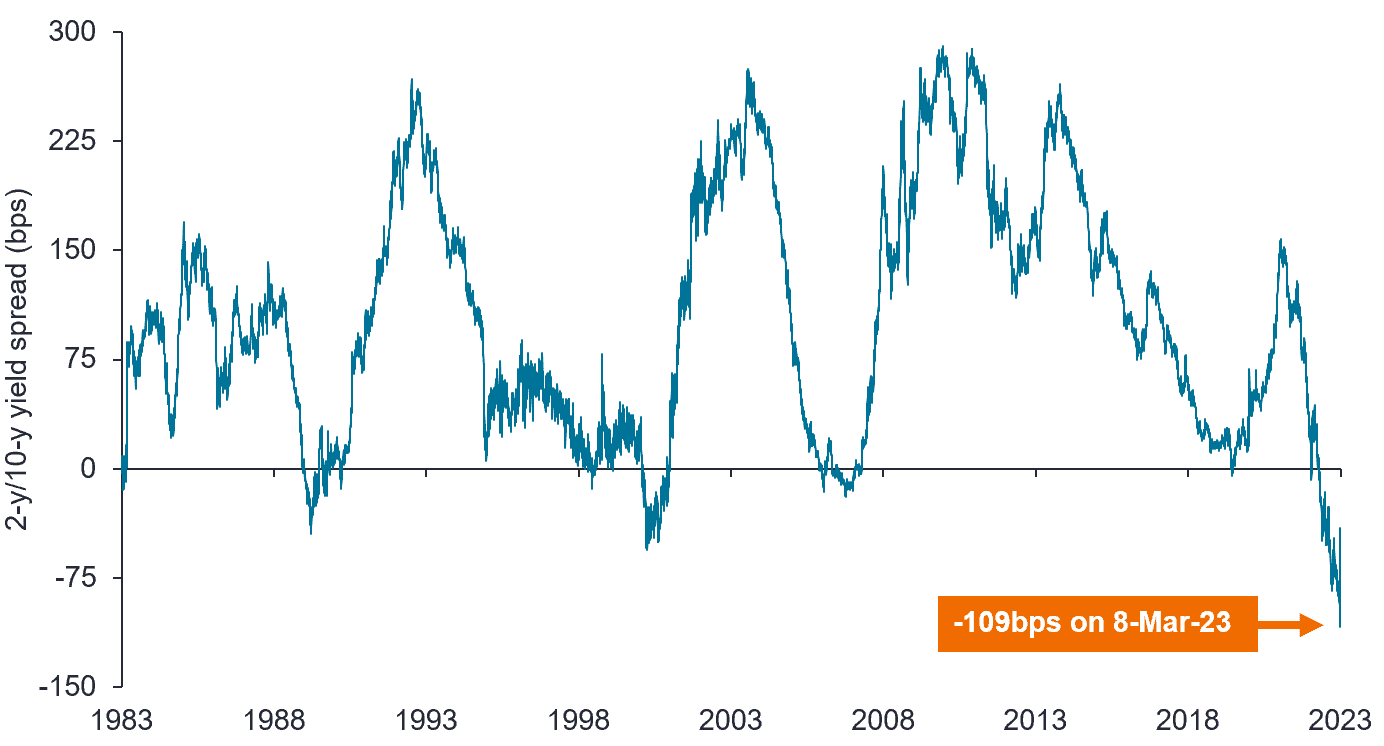 Source: Bloomberg, Janus Henderson, 1 January 1983 to 31 May 2023. Chart shows US 10-year Treasury yield minus US 2-year Treasury yield. BPS = basis points. 1 basis point = 0.01%. Past performance does not predict future returns.
Exhibit 2: …led to a record move when SVB collapsed
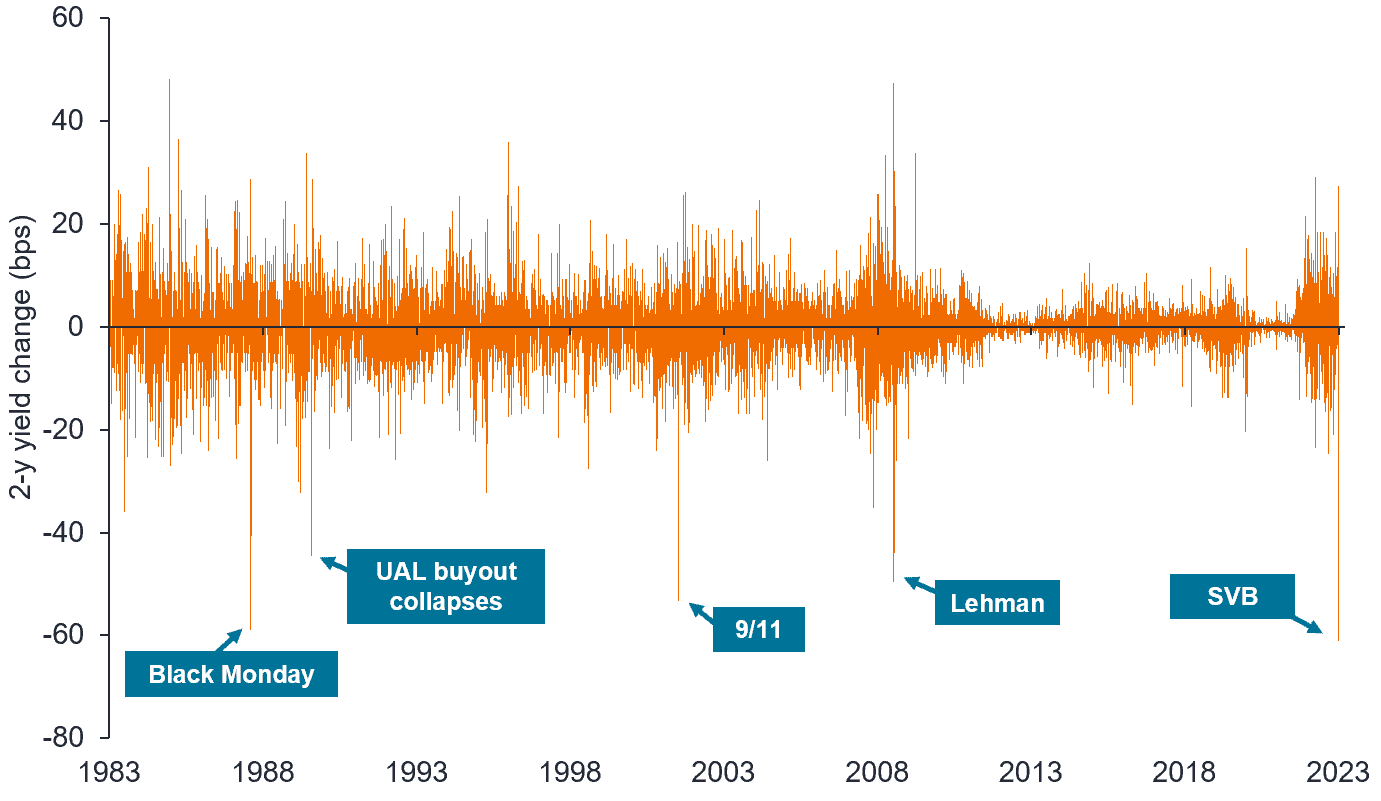 Source: Bloomberg, 1 January 1983 to 31 May 2023. Chart shows daily change in yields on 2-year Treasury. Past performance does not predict future returns.
How do investors prepare for unpredictability?
We talk a lot about what the biggest problems are that investors could potentially solve with alternatives.
Our focus is on liquid alternatives – assets a client can reliably sell in a short timescale when they want to sell. It means that the underlying investments are typically standard securities rather than being partnerships ventures, less liquid strategies, etc.
One of the consequences of seeing inflation back in the system has been the need to re-evaluate traditional portfolio asset allocation. The traditional ‘60/40’ asset allocation strategy that has fulfilled a particular role for investors over the past few decades has been conditioned on an environment of perpetually low inflation/disinflation. This demanded a higher allocation to risk assets than might ordinarily be desirable, given the negligible risk-free rate.
However, with the US Federal funds rate at 5.0%-5.25% (at the time of writing) and other major central banks (Japan aside) committed to reining in inflation, this would suggest an arguably lower need for risk assets, via long-only equities, which opens the door to consider other options. With volatility, in our view, likely to persist in 2023, the question for investors is how much of that equity portion of the 60/40 could be diversified with alternatives to bring in different drivers of performance and potentially improve the correlation profile of a broader portfolio?
…there are known knowns; there are things we know we know. We also know there are known unknowns; that is to say we know there are some things we do not know. But there are also unknown unknowns – the ones we don’t know we don’t know…it is the latter category that tends to be the difficult ones. – Donald Rumsfeld, former US Secretary of Defence
Risk reduction to remain key
What is clear is that we are operating in a far more polarised environment than existed a decade ago, bringing to mind Donald Rumsfeld’s comment about ‘unknown unknowns’. Even if you had access to a crystal ball that could give you some foresight of things to come, the way the market is going to react could be totally counterintuitive. So, when we consider the balance of opportunities, we are thinking about the potential for almost radical uncertainty, and what liquid alternatives can offer in that environment.
We believe strongly in the value of a strategy that offers various levers to deliver performance, and that is capable of producing long-term, consistent returns that are uncorrelated to traditional assets like equities and fixed income. What worked two years ago or 10 years ago does not necessarily work today. It comes down to having the right set of tools for the environment and the ability to adjust positioning as needed.
For example, in 2022, we saw equities and fixed income go down and some inflation-sensitive assets, like commodities, go up. Those environments where prices move consistently in the same direction over time is logically a good one for trend following strategies. But in environments characterised by jumps in asset prices, such as the above-mentioned counter-trend shock to the US two-year note, trend following strategies are, unsurprisingly, more likely to struggle, prompting a search for other options, particularly non-directional strategies.
In periods of higher volatility, investors might want to consider non-directional strategies that can potentially do very well if the market moves rapidly in either direction. That would include strategies that have more optionality that use derivative markets to get those positively convex payoffs.
After some time out in the wilderness, convertible bonds saw a resurgence in demand in the first half of 2023, reflecting expectations that the US Federal Reserve is close to the end of this particular tightening cycle. Levels of new paper issued were significantly higher than in 2022, aimed at funding growth, refinancing debt, and providing fuel for merger and acquisition activity. This helped inject a bit more of the desired convexity into the market – and given the higher coupons on offer (in response to higher interest rates), potentially more favourable entry points for ‘buy and hold’ exposure to assets that combine equity and debt.
True alternatives
The argument for liquid alternatives is not just about whether they can offer diversification, but also what kind of diversification that means. Not all strategies are created equal, and there is a risk that what is offered as an alternative fails to deliver consistently on its objectives. Right now, alternatives that could act as an uncorrelated ‘shock absorber’ with the potential to generate alpha seem like a good solution to help keep the balance between offence and defence in investors’ portfolios. Our view remains that alternatives managers will need to focus on improving the range and adaptability of their offerings if they aim to provide investors with a reliable platform capable of performing throughout the market cycle.
‘60/40’: A mainstay of balanced portfolio investing in the modern era, the 60/40 strategy is one where investors allocate 60% of their portfolio to growth assets (usually equities), and 40% to fixed income. These strategies are designed to offer diversification between asset classes, with the potential to deliver both growth and income, with bonds used to help reduce overall volatility.
Alpha: A measure that can help determine whether an actively managed portfolio has added value in relation to risk taken relative to a benchmark index. A positive alpha indicates that a manager has added value. Alpha is the difference between a portfolio’s return and its benchmark’s return after adjusting for the level of risk taken.
Alternatives: An investment that is not included among the traditional asset classes of equities, bonds or cash. Alternative investments include property, hedge funds, commodities, private equity and infrastructure.
Convertible bond: A hybrid fixed-income debt security that yields interest payments, with the option to convert into a predetermined number of common shares.
Convex/convexity: Convexity is the curvature in the relationship between bond prices and bond yields that demonstrates how the duration of a bond changes as the interest rate changes. If a bond’s duration increases as yields decline, it has positive convexity.
Correlation: How far the price movements of two variables (eg, equity or fund returns) match each other in their direction. If variables have a correlation of +1, then they move in the same direction. If they have a correlation of -1, they move in opposite directions. A figure near zero suggests a weak or non-existent relationship between the two variables.
Coupons: A regular interest payment that is paid on a bond. It is described as a percentage of the face value of an investment. For example, if a bond has a face value of £100 and a 5% annual coupon, the bond will pay £5 a year in interest.
Credit: Refers to bonds within fixed income markets where the borrower is not a sovereign or government entity. Typically, the borrower will be a company or an individual, and the borrowings will be in the form of bonds, loans or other fixed interest asset classes.
Diversification neither assures a profit nor eliminates the risk of experiencing investment losses.
Inflation: The rate at which the prices of goods and services are rising in an economy. The CPI and RPI are two common measures.
Liquid alternatives: Assets classed as alternatives that can be easily bought or sold in the market.
Long-only equities: A portfolio that only invests in long positions (securities purchased in the expectation that they will rise in value over time).
Market cycle: Asset performance is often driven largely by cyclical factors tied to the state of the economy. Economies and markets are cyclical and the cycles can last from a few years to nearly a decade.
Monetary/fiscal policy: Monetary policy covers the actions of a central bank, aimed at influencing the level of inflation and growth in an economy. It includes controlling interest rates and the supply of money. Fiscal policy relates to government policies, relating to setting tax rates, spending levels and debt.
New paper: A term used to describe the issue of a new bond, referring to a time when bonds were issued with a certificate of ownership, made using a high quality, durable mix of paper and cotton.
Non-directional strategies: A neutral investment strategy designed to help investors manage risk and volatility during periods when markets have no clear trends, or during periods when markets are expected to remain flat. They invest in holdings that are capable of delivering a return whichever direction the market moves.
Option: A contract in which two parties agree to give one of them the right to buy or the right to sell a specific asset, such as shares, bonds or currencies, within a stated time period at a price that is fixed when the option is bought. An option is a form of derivative.
Risk assets: Financial securities that can have significant price movements (hence carry a greater degree of risk). Examples include equities, commodities, property and bonds.
Short (ie. short credit positions): Fund managers use this technique to borrow then sell what they believe are overvalued assets, with the intention of buying them back for less when the price falls. The position profits if the security falls in value.
Tightening cycle: Monetary tightening refers to central bank activity aimed at curbing inflation and slowing down growth in the economy, including raising interest rates or reducing the supply of money. See also fiscal policy. The ‘cycle’ covers the whole period in which a central bank pursues this policy.
Treasuries (Treasury securities): Bonds issued and backed by the US government, with varying maturity dates usually ranging from one month to 30 years. Treasury bond yields are used to plot the yield curve, commonly used as an indicator of the state of the economy. An inverted yield curve, where shorter-term Treasuries (ie. 2-year Treasury) have a higher yield that longer-term bonds (ie. 10-year Treasury) is considered as an indicator of a potential future recession.
Trend following strategies: Trend trading is a trading style that attempts to capture gains through the analysis of the momentum of an asset (or group of assets) in a particular direction. When the price is moving in one overall direction, such as up or down, that is called a trend. A trend following strategy can potentially utilise multiple measures of trend, across markets and asset classes, within the same portfolio.
Volatility: The rate and extent at which the price of a portfolio, security or index, moves up and down. If the price swings up and down with large movements, it has high volatility. If the price moves more slowly and to a lesser extent, it has lower volatility. Higher volatility means the higher the risk of the investment.
Yields: The level of income on a security, typically expressed as a percentage rate. For equities, a common measure is the dividend yield, which divides recent dividend payments for each share by the share price. For a bond, this is calculated as the coupon payment divided by the current bond price.
Yield curve: A graph that plots the yields of similar quality bonds against their maturities. In a normal/upward sloping yield curve, longer maturity bond yields are higher than short-term bond yields. A yield curve can signal market expectations about a country’s economic direction.
These are the views of the author at the time of publication and may differ from the views of other individuals/teams at Janus Henderson Investors. References made to individual securities do not constitute a recommendation to buy, sell or hold any security, investment strategy or market sector, and should not be assumed to be profitable. Janus Henderson Investors, its affiliated advisor, or its employees, may have a position in the securities mentioned.
Past performance does not predict future returns. The value of an investment and the income from it can fall as well as rise and you may not get back the amount originally invested.
The information in this article does not qualify as an investment recommendation.
There is no guarantee that past trends will continue, or forecasts will be realised.
Marketing Communication.