
Key takeaways:
- Over a 20-year horizon, European quality value stocks have provided returns in excess of deep value.
- While deep value stocks have outperformed at valuation extremes, such outperformance came about over a relatively short period and was ultimately eroded.
- We believe that European quality value stocks are more attractive for long-term investors.
Within the value sector of the European market where do the best and most consistent returns lie?
This is a question I am often asked by clients and my typical answer is that quality value tends to outperform deep value over time. Yes, deep value has its moments in the sun, but these tend to be of short duration and are usually superseded by prolonged periods of quality value outperformance.
To illustrate this phenomenon, I conducted a study in Euro denominated markets. The results demonstrate that deep value stocks tend to outperform when the valuation spread (the difference in valuation between cheap and expensive stocks) in markets is at high or extreme levels. Once these spreads begin to narrow, quality value stocks tend to take over as the outperformers.
The value test
For the purposes of the exercise, I used historic price-to-book (P/B) valuations to define deep value as, in my opinion, this metric most closely reflects the business environment for individual companies via retained earnings/losses. Quality value was defined as stocks mispriced relative to their balance sheet structure, earnings/cashflows, their retention policy and current rating relative to their assumed sustainable return profile, the core of the screen we use to find quality mispriced stocks for the Euroland strategy.
Using FactSet we analysed 20 years of historic company data (31/01/2003 – 31/01/2023) and plotted the returns of the cheapest stocks in two groups (deep value and quality value, as defined above). Both groups had roughly the same sample size and there was no survivorship bias in the study; however, it is important to note that there is a small cap effect in the overall results, as all holdings were equally weighted over the 20-year period. In addition, financial stocks are shown separately because the screen used to identify quality value for non-financial stocks includes a cash measure which is not appropriate for the financial sector.
The study supports the premise that at valuation extremes, deep value does indeed outperform quality value, but that such outperformance comes about over a relatively short period and is ultimately eroded and surpassed.
The study suggests that, over the period studied, quality value outperforms deep value roughly 80%+ of the time for non-financials and roughly 85% of the time for financials. Average comparative returns for each bucket shown in chart 1 are for the 12-month holding period from the date of selection. Numerically the lower the value for the bucket the lower the valuation dispersion in markets and vice versa.
For the non-financials universe, the average 12-month returns over the 20-year period were as follows: Deep value: 9.4% per annum, quality value: 13.0% per annum.
For the financials universe, the average 12-month returns over the 20-year study period were as follows: Deep value: 0.5% per annum, quality value: 4.0% per annum.
Non-Financials
Chart 1: Quality value returns versus deep value returns and levels of dispersion (non-financials)
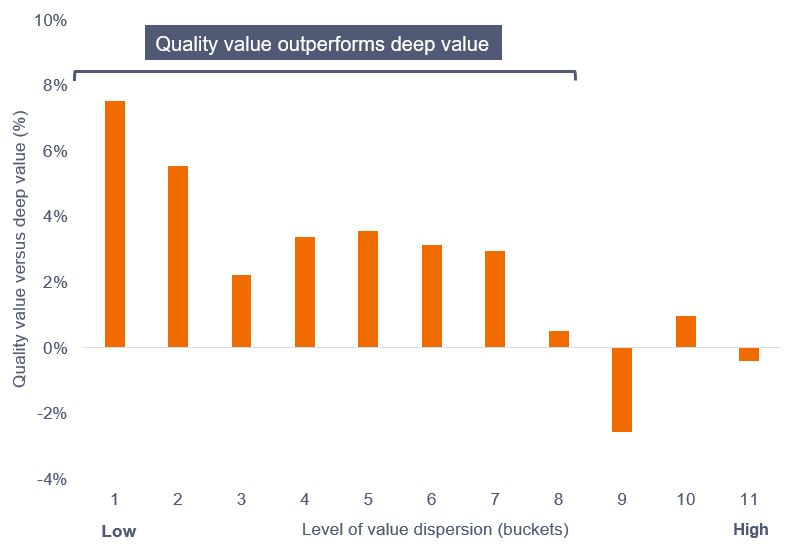
Source: FactSet/Janus Henderson, Universe = MSCI EMU Index & FTSE World EMU region Index non-financial stocks amalgamated. 20-year difference in average monthly returns between Quality Value and Deep Value from January 2003 to January 2023. Buckets assigned associated with levels of valuation dispersion within markets, valuation determined by P/B. Past performance does not indicate future returns.
Chart 2: Time spent in level of dispersion bucket (non-financials)
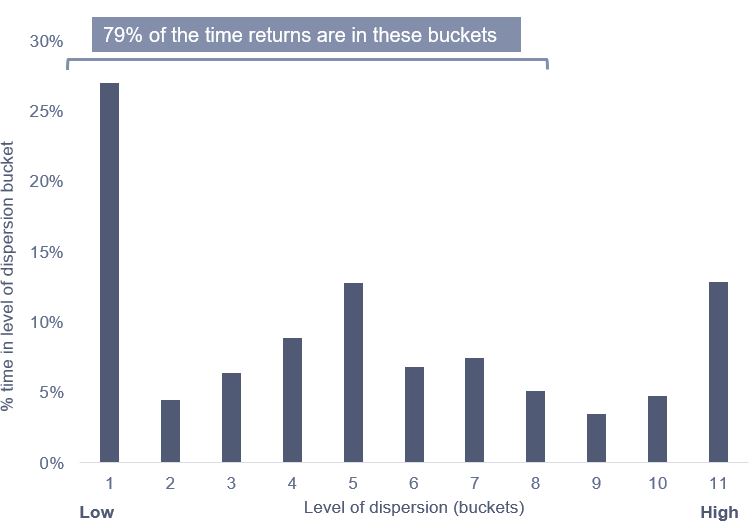
Source: FactSet/Janus Henderson, Universe = MSCI EMU Index & FTSE World EMU region Index non-financial stocks amalgamated, 20-years from January 2003 to January 2023. Buckets assigned associated with levels of valuation dispersion within markets, valuation determined by P/B. Past performance does not indicate future returns.
Financials
The study for financials was more problematic in two ways. First, the dispersion of valuations in the sector has been much higher over the last 20 years. For this reason, we have included more buckets in our analysis. Second, the more eagle-eyed readers may spot that there is no ‘bucket 1’. This is because 1) the level of dispersion in the financials sector never got low enough to enter the parameters we set for this bucket and 2) the returns were more volatile on a 12-month basis. If we were to move the holding period out to a longer time frame – say two to three years – the shape of return comes closer to that of the rest of the market. However, to enable us to better compare financials and non-financials, we have maintained a 12-month timeframe. As was the case for non-financials, the financials sector demonstrates prolonged outperformance for quality value.
Chart 3: Quality value returns versus deep value returns and levels of dispersion (financials)
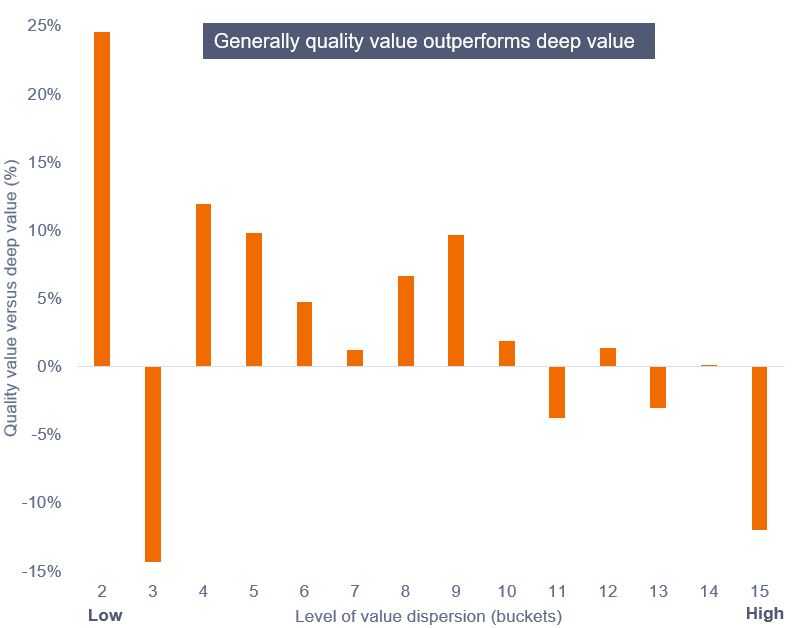
Source: FactSet/Janus Henderson, Universe = MSCI EMU Index & FTSE World EMU region Index financial stocks amalgamated. 20-year difference in average monthly returns between Quality Value and Deep Value from January 2003 to January 2023. Buckets assigned associated with levels of valuation dispersion within markets, valuation determined by P/B. Past performance does not indicate future returns.
Chart 4: Time spent in level of dispersion bucket (financials)
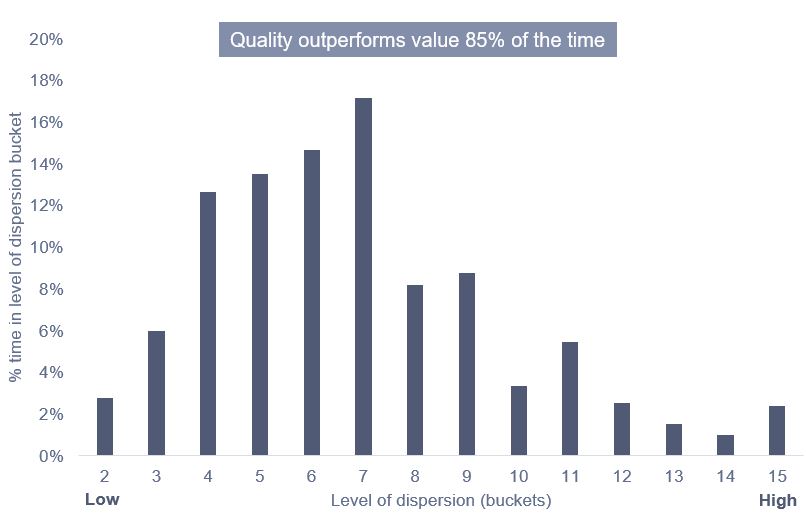
Source: FactSet/Janus Henderson, Universe = MSCI & FTSE World EMU region financial stocks Index amalgamated. 20-years from January 2003 to January 2023. Buckets assigned associated with levels of valuation dispersion within markets, valuation determined by P/B. Past performance does not indicate future returns.
Conclusion
Our study supports the premise that at valuation extremes, deep value outperforms quality value but that such outperformance comes about over a relatively short period and is ultimately eroded. Over the longer term, the study (20 years of monthly data) suggests that quality value outperforms deep value roughly 80%+ of the time for non-financials and roughly 85% of the time for financials.
At present levels in Europe, quality has underperformed, on a relative basis, to levels last seen in 1999/2000 – chart 5.
Chart 5: Relative performance for European quality stocks
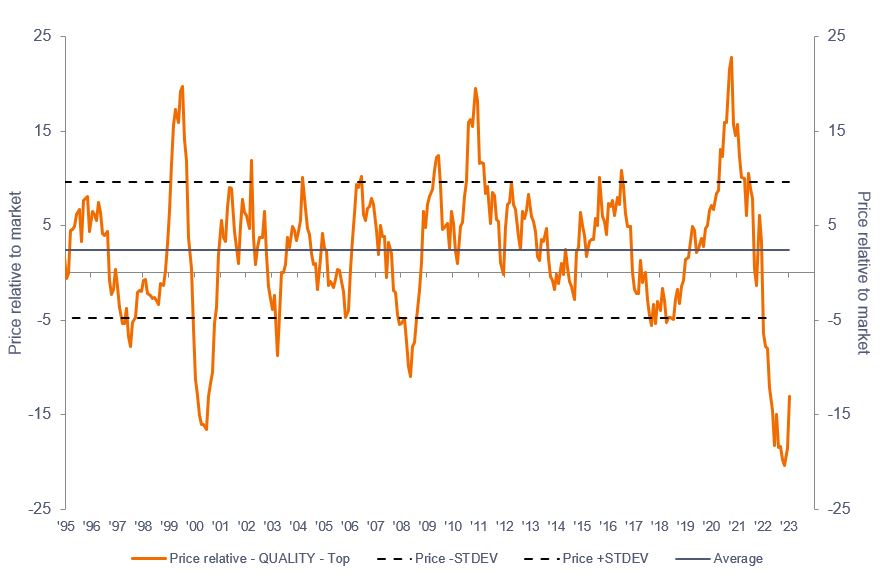
Source: JP Morgan. Data from December 1994 to January 2023. Past performance does not indicate future returns.
While timing will always be difficult to predict, when answering the question of why investors should hold quality value rather than deep value, the argument supports holding quality value over anything other than the short term.
These are the views of the author at the time of publication and may differ from the views of other individuals/teams at Janus Henderson Investors. References made to individual securities do not constitute a recommendation to buy, sell or hold any security, investment strategy or market sector, and should not be assumed to be profitable. Janus Henderson Investors, its affiliated advisor, or its employees, may have a position in the securities mentioned.
Past performance does not predict future returns. The value of an investment and the income from it can fall as well as rise and you may not get back the amount originally invested.
The information in this article does not qualify as an investment recommendation.
There is no guarantee that past trends will continue, or forecasts will be realised.
Marketing Communication.