For Financial Professionals in the US

JGRTX Enterprise Fund

A differentiated mid-cap growth strategy that takes a moderate approach to an asset class known for rapid growth potential

NAV
$122.82
As of 09/25/2023

1-Day Change
$0.03 (0.02%)
As of 09/25/2023

YTD Return
8.35%
As of 09/25/2023

Morningstar Rating

As of 08/31/2023

Morningstar Medalist Rating ™

Bronze Morningstar Analyst Rating
As of 07/13/2023

Overview

ABOUT THIS FUND

By taking a moderate approach to an asset class with potential for rapid growth, this mid-cap growth fund has demonstrated lower volatility than the index. Unlike many competitor products that focus on short-term growth rates, this strategy seeks to invest in companies that exhibit sustainable and durable growth.

WHY INVEST IN THIS FUND

Smart Growth Approach
The Fund’s investment approach focuses on long-duration, sustainable-growth companies with strong competitive advantages and large addressable markets. We seek to avoid companies with rapid but unsustainable, short-term growth profiles.

Deep, Specialized Team
The Fund benefits from experienced Portfolio Managers with expertise in mid-cap investing; in-depth fundamental research conducted by a dedicated team of experts exclusively focused on small-mid-cap companies; and the broader support of an insightful team of equity investment professionals.

Growth Potential with Tempered Volatility
The Portfolio offers exposure to medium-size companies with resilient business models and is designed to weather a variety of market environments and take on moderately less risk than the index.

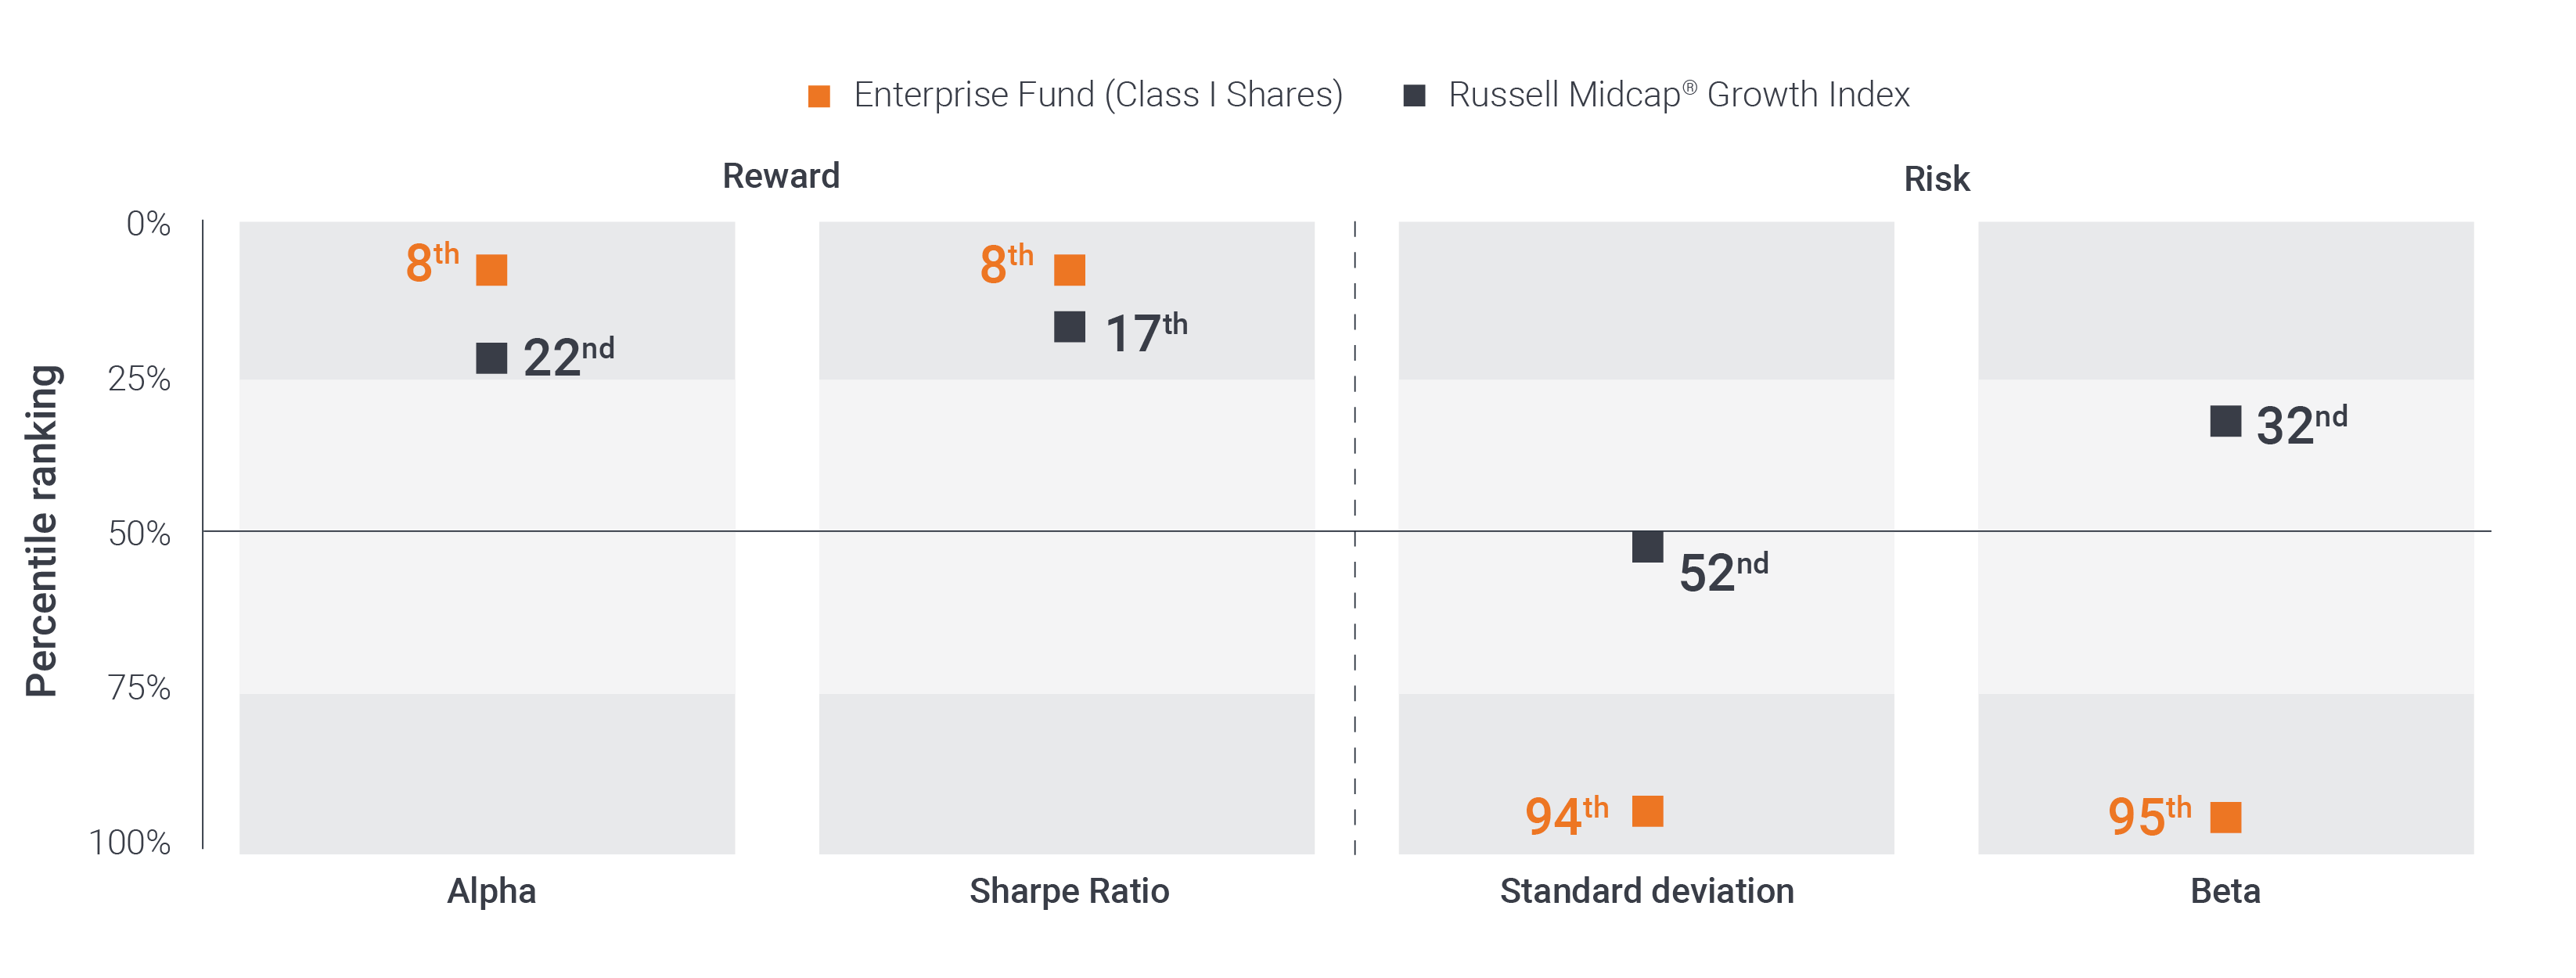
Strong risk-adjusted performance vs. peers

10-Year Rankings in Morningstar Mid-Cap growth category (489 funds) as of 6/30/23Enterprise Fund Proof Point Chart Q2 2023

Enterprise Fund 3-Year rankings in Morningstar Mid Cap Growth Category as of 6/30/23: Alpha – 10th percentile ranked 39 of 535 funds, Sharpe Ratio – 5th percentile ranked 20 of 535 funds, Standard Deviation – 93rd percentile ranked 503 of 535 funds and Beta – 97th percentile ranked 517 of 535 funds.

Past performance is no guarantee of future results.

PORTFOLIO MANAGEMENT

Brian Demain, CFA

Portfolio Manager

Industry since 1999. Joined Firm in 1999.

Cody Wheaton, CFA

Portfolio Manager | Research Analyst

Industry since 2001. Joined Firm in 2001.

Performance

RETURNS (%) (As of 08/31/2023)
Enterprise Fund - Class S Shares Russell Midcap® Growth Index
 
3M YTD 1YR 3YR 5YR 10YR Since Inception
(09/01/1992)
Enterprise Fund - Class S Shares 6.49 12.15 11.74 8.59 8.78 12.32 10.80
Russell Midcap® Growth Index 7.33 15.51 13.00 3.85 7.95 11.03 10.12
RETURNS (%) (As of 06/30/2023)
Enterprise Fund - Class S Shares Russell Midcap® Growth Index
 
3M YTD 1YR 3YR 5YR 10YR Since Inception
(09/01/1992)
Enterprise Fund - Class S Shares 4.00 12.72 18.22 12.26 10.43 12.70 10.89
Russell Midcap® Growth Index 6.23 15.94 23.13 7.63 9.72 11.53 10.19
Calendar Year Returns (%)
Enterprise Fund - Class S Shares Russell Midcap® Growth Index
2022 2021 2020 2019 2018 2017 2016 2015 2014 2013
Enterprise Fund - Class S Shares -16.35 16.92 19.85 34.72 -1.30 26.03 11.63 3.04 11.65 30.31
Russell Midcap® Growth Index -26.72 12.73 35.59 35.47 -4.75 25.27 7.33 -0.20 11.90 35.74

MORNINGSTAR PERCENTILE

(As Of 06/30/2023)
1 YR 3 YR 5 YR 10 YR SINCE INCEPTION
Percentile Ranking 50 11 19 9 27
Mid-Cap Growth | Rank/Count 298/562 45/535 100/513 42/475 37/126
(As Of 08/31/2023)
1 YR 3 YR 5 YR 10 YR SINCE INCEPTION
Percentile Ranking 30 10 22 9 26
Mid-Cap Growth | Rank / Count 155/562 43/536 112/518 42/479 36/126
GROWTH OF A HYPOTHETICAL INVESTMENT

RETURNS-BASED STATISTICS (As of 08/31/2023 Class I Shares)

RISK / REWARD
VS. Russell Mid Cap Growth TR USD
3YR 5YR
Information Ratio 0.57 0.15
Alpha 5.22 1.96
Tracking Error 8.83 7.69
Beta 0.80 0.86
R-squared (%) 83.01 88.64
UP/DOWN MARKET CAPTURE (%)
VS. Russell Mid Cap Growth TR USD
3YR 5YR
Up Capture Ratio 90.24 85.90
Down Capture Ratio 77.61 85.64
STANDARD DEVIATION 3YR 5YR
Enterprise Fund 18.25 20.31
Russell Mid Cap Growth TR USD 20.90 22.24
SHARPE RATIO 3YR 5YR
Enterprise Fund 0.40 0.37
Russell Mid Cap Growth TR USD 0.10 0.28
ANNUAL FEES & EXPENSES (As of the most recent prospectus)
CLASS S SHARES
Management Fees 0.64%
12b-1 Fees 0.25%
Other Expenses 0.27%
Total Gross Expenses 1.16%
Waivers 0.00%
Total Net Expenses 1.16%

Portfolio

Index represents the Russell MidCap® Growth Index.

Top Holdings (As of 08/31/2023)
% of Fund
Constellation Software Inc/Canada 3.48
ON Semiconductor Corp 3.41
Boston Scientific Corp 2.98
SS&C Technologies Holdings Inc 2.62
WEX Inc 2.56
Intact Financial Corp 2.55
Flex Ltd 2.51
Amdocs Ltd 2.36
GoDaddy Inc 2.20
Teleflex Inc 2.13
Total 26.80
View full holdings
Portfolio Characteristics (As of 08/31/2023)
  FUND INDEX
Number of Holdings
Equity Issues
82 333
Market Capitalization
Weighted Average
$23.14B $23.40B
Portfolio Turnover Rate
(1-year trailing)
12.46% -
Price/Earnings Ratio
(1-year forward)
17.42 22.57
Price/Book Ratio
3.34 8.16
Earnings Growth Rate
(1-year forward)
11.41% 20.29%
Sector Allocation % OF FUND % of Index % OF FUND % of Index (As of 08/31/2023)
Regional Allocation % OF FUND % of Index % OF FUND % of Index (As of 08/31/2023)
Market Capitalization Range of Equity Holdings % OF FUND % of Index % OF FUND % of Index (As of 08/31/2023)
Developed vs Emerging Markets % OF FUND % of Index % OF FUND % of Index (As of 08/31/2023)

Documents