Quarterly Update
Watch the investment team recap this quarter.
(Note: Filmed in May 2026).
About this fund
By taking a moderate approach to an asset class with potential for rapid growth, this mid-cap growth fund has demonstrated lower volatility than the index. Unlike many competitor products that focus on short-term growth rates, this strategy seeks to invest in companies that exhibit sustainable and durable growth.
Why invest in this fund
Smart Growth Approach
The Fund’s investment approach focuses on long-duration, sustainable-growth companies with strong competitive advantages and large addressable markets. We seek to avoid companies with rapid but unsustainable, short-term growth profiles.
Deep, Specialized Team
The Fund benefits from experienced Portfolio Managers with expertise in mid-cap investing; in-depth fundamental research conducted by a dedicated team of experts exclusively focused on small-mid-cap companies; and the broader support of an insightful team of equity investment professionals.
Growth Potential with Tempered Volatility
The Portfolio offers exposure to medium-size companies with resilient business models and is designed to weather a variety of market environments and take on moderately less risk than the index.
Strong risk-adjusted performance vs. peers
10-Year Rankings in Morningstar Mid-Cap growth category (442 funds) as of 3/31/26
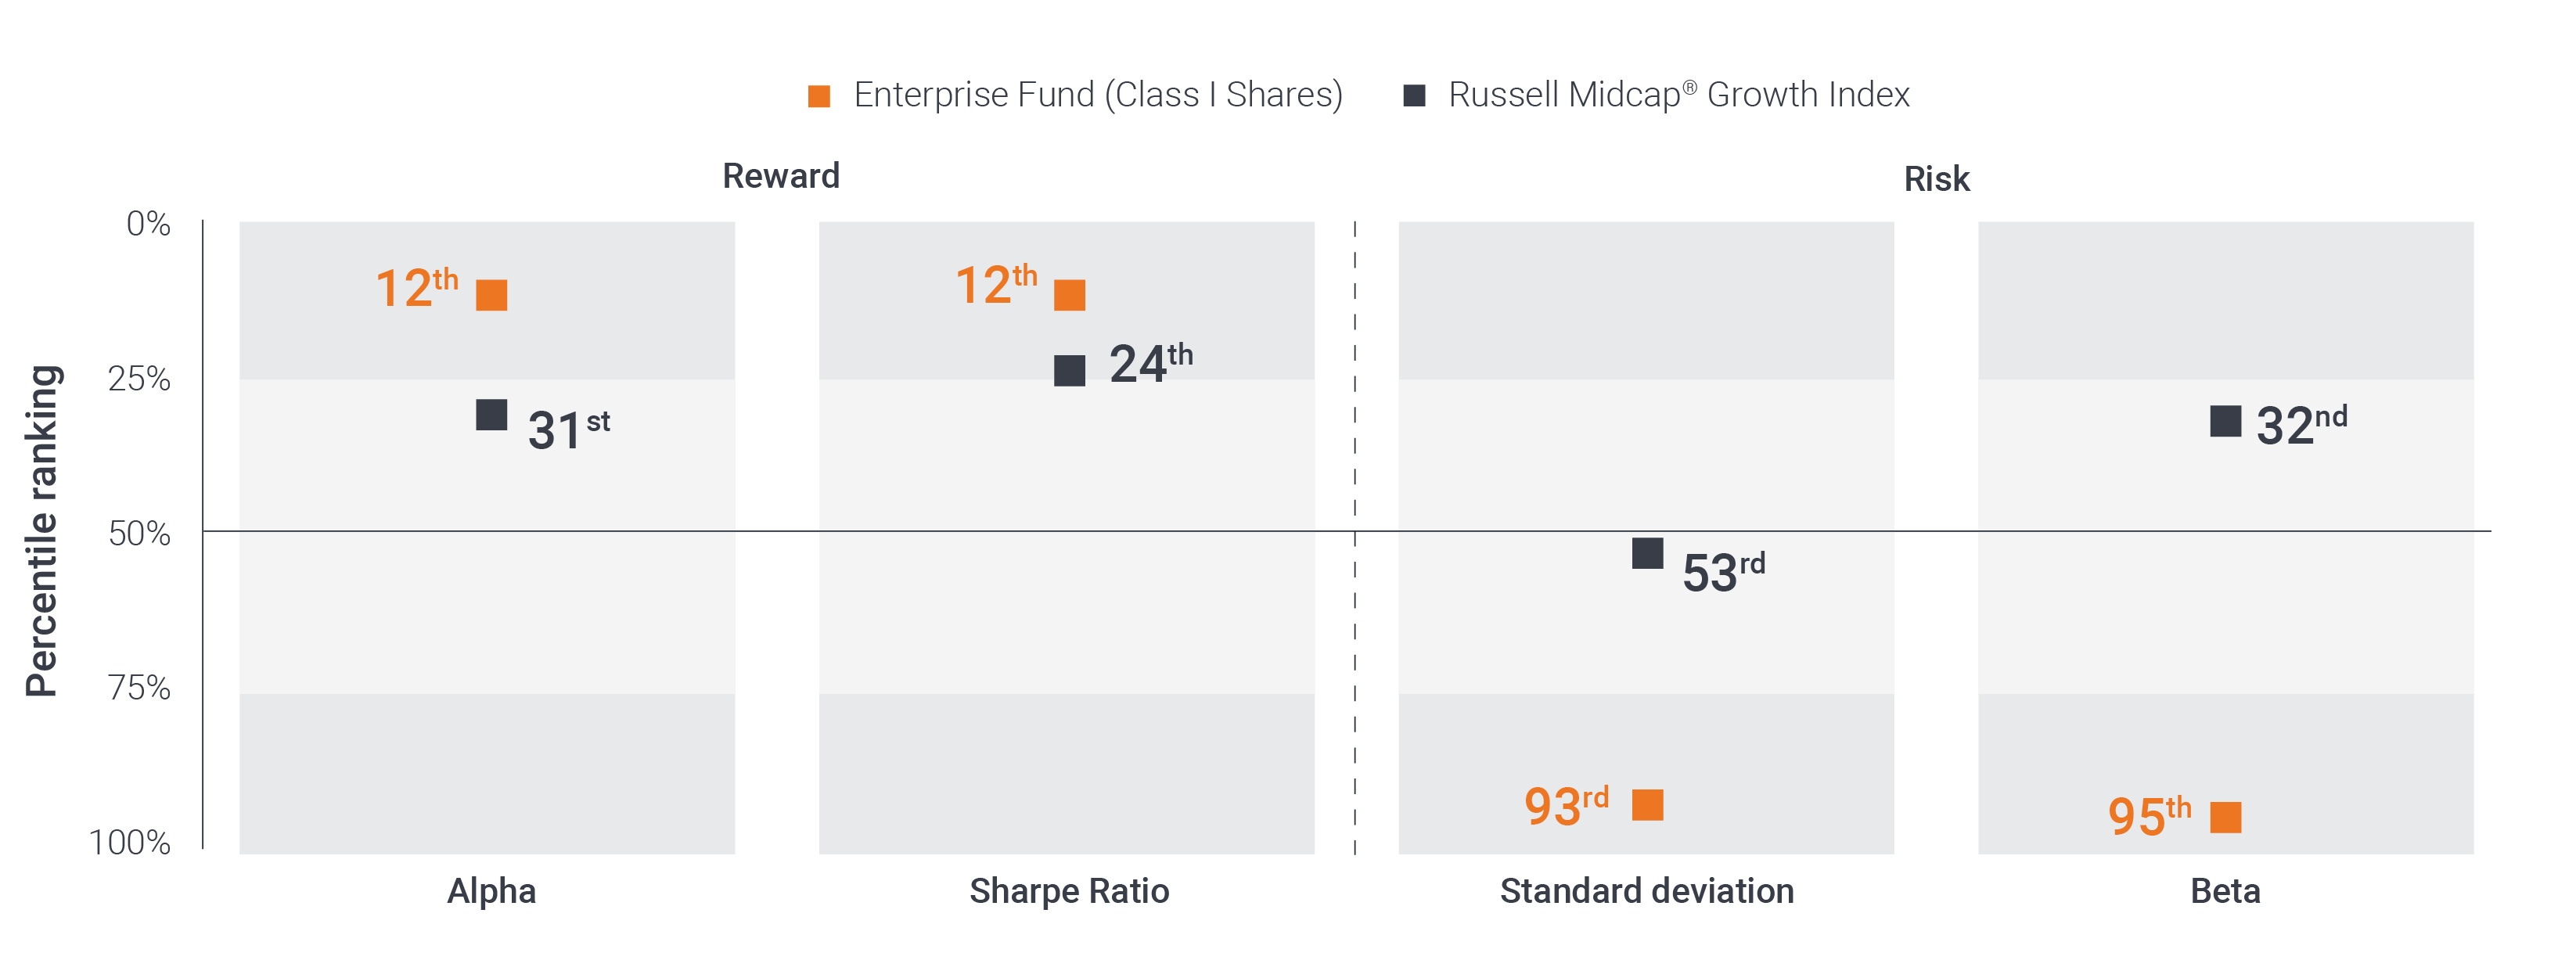
Enterprise Fund 3-Year rankings in Morningstar Mid Cap Growth Category as of 3/31/26: Alpha – 57th percentile ranked 271 of 487 funds, Sharpe Ratio – 60th percentile ranked 292 of 487 funds, Standard Deviation – 98th percentile ranked 477 of 487 funds and Beta – 95th percentile ranked 461 of 487 funds.
Past performance is no guarantee of future results.