For Financial Professionals in the US

JFRNX Forty Fund

We believe our differentiated view from the market identifies growth where growth is scarce, positioning our investments to outperform the index over time

NAV
$46.53
As of 06/06/2023

1-Day Change
$0.18 (0.39%)
As of 06/06/2023

YTD Return
22.54%
As of 06/06/2023

Morningstar Rating

As of 05/31/2023

Overview

ABOUT THIS FUND

Concentrated large-cap growth fund, leveraging our three decades of experience in high-conviction investing. By investing in our best wide-moat ideas, the Fund seeks to add excess returns over the long term. Given its concentrated nature, the Fund may exhibit moderately higher volatility than its benchmark.

WHY INVEST IN THIS FUND

High-Conviction Approach
Fundamental research-driven approach, investing with conviction in 30 to 40 of our best large-cap growth ideas where we believe we have a differentiated view from the market.

Innovative Wide-Moat Companies
Seeks companies with sustainable competitive advantages that capitalize on their competitive moat to grow market share globally over a multi-year period. Emphasizes dominant companies driving innovation and change through disruptive technologies, products or business models.

Stock Selection Drives Return
Stock picker’s fund designed to deliver long-term growth of capital with a high-conviction approach. Seeks to use risk wisely, leveraging our best ideas in a concentrated portfolio to drive potential outperformance of the index over time.

Active approach has delivered solid returns

Forty Fund (Class I Shares) vs. Morningstar Large Growth Peers as of 3/31/23

Forty Fund Proof Point Chart Q1 2023

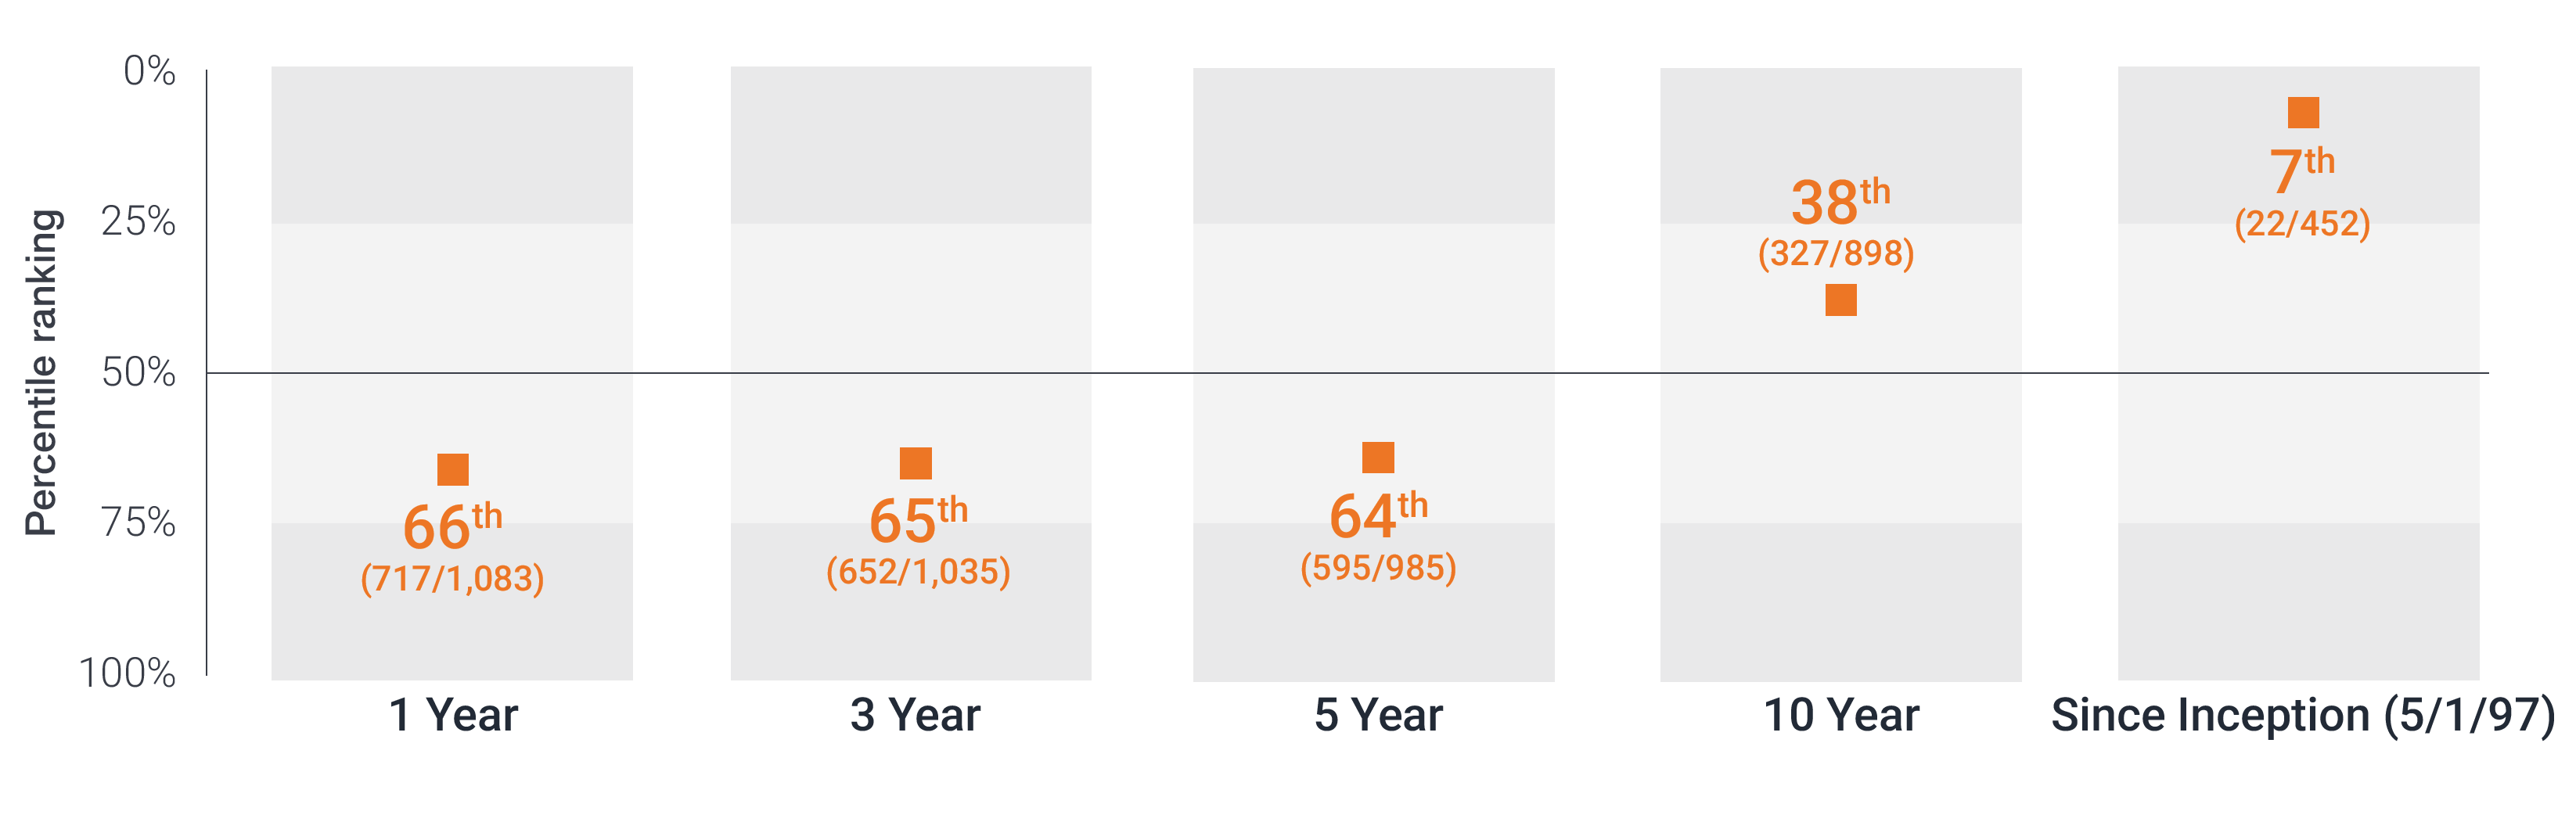
Past performance is no guarantee of future results.

AN UNCOMPROMISING APPROACH

Equity markets may shift.
Our focus never does.

equity-hero-fg_custom_en

PORTFOLIO MANAGEMENT

Doug Rao

Portfolio Manager

Industry since 1998. Joined Firm in 2013.

Nick Schommer, CFA

Portfolio Manager

Industry since 2007. Joined Firm in 2013.

Brian Recht

Portfolio Manager | Research Analyst

Industry since 2011. Joined Firm in 2015.

Performance

RETURNS (%) (As of 03/31/2023)
Forty Fund - Class N Shares Russell 1000® Growth Index S&P 500® Index
 
3M YTD 1YR 3YR 5YR 10YR Since Inception
(05/01/1997)
Forty Fund - Class N Shares 14.12 14.12 -14.29 14.15 11.53 13.97 11.43
Russell 1000® Growth Index 14.37 14.37 -10.90 18.58 13.66 14.59 8.78
S&P 500® Index 7.50 7.50 -7.73 18.60 11.19 12.24 8.52
RETURNS (%) (As of 05/31/2023)
Forty Fund - Class N Shares Russell 1000® Growth Index S&P 500® Index
 
3M YTD 1YR 3YR 5YR 10YR Since Inception
(05/01/1997)
Forty Fund - Class N Shares 11.18 19.41 8.63 8.77 11.62 13.94 11.55
Russell 1000® Growth Index 12.81 20.76 9.55 12.85 13.84 14.76 8.95
S&P 500® Index 5.75 9.65 2.92 12.92 11.01 11.99 8.55
Calendar Year Returns (%)
Forty Fund - Class N Shares Russell 1000® Growth Index
2022 2021 2020 2019 2018 2017 2016 2015 2014 2013
Forty Fund - Class N Shares -33.49 23.08 39.27 36.92 1.59 29.71 2.44 12.22 9.07 32.32
Russell 1000® Growth Index -29.14 27.60 38.49 36.39 -1.51 30.21 7.08 5.67 13.05 33.48

MORNINGSTAR PERCENTILE

(As Of 03/31/2023)
1 YR 3 YR 5 YR 10 YR SINCE INCEPTION
Percentile Ranking 70 63 32 14 3
Large Growth | Rank/Count 857/1255 686/1177 315/1130 130/1038 10/512
(As Of 05/31/2023)
1 YR 3 YR 5 YR 10 YR SINCE INCEPTION
Percentile Ranking 31 58 30 17 4
Large Growth | Rank / Count 360/1227 599/1153 300/1105 160/1016 12/501
GROWTH OF A HYPOTHETICAL INVESTMENT

RETURNS-BASED STATISTICS (As of 04/30/2023 Class I Shares)

RISK / REWARD
VS. Russell 1000® Growth Index
3YR 5YR
Information Ratio -0.99 -0.61
Alpha -3.61 -1.65
Tracking Error 4.35 3.84
Beta 0.99 0.97
R-squared (%) 96.07 96.65
UP/DOWN MARKET CAPTURE (%)
VS. Russell 1000® Growth Index
3YR 5YR
Up Capture Ratio 89.43 91.19
Down Capture Ratio 101.43 97.44
STANDARD DEVIATION 3YR 5YR
Forty Fund 21.90 20.67
Russell 1000® Growth Index 21.69 20.99
SHARPE RATIO 3YR 5YR
Forty Fund 0.38 0.48
Russell 1000® Growth Index 0.58 0.59
ANNUAL FEES & EXPENSES (As of Fiscal Year End, 09/30/2022)
CLASS N SHARES
Management Fees 0.55%
Other Expenses 0.02%
Total Gross Expenses 0.57%
Waivers 0.00%
Total Net Expenses 0.57%

Portfolio

Index represents the Russell 1000® Growth Index.

Top Holdings (As of 04/30/2023)
% of Fund
Microsoft Corp 10.76
Apple Inc 8.80
Amazon.com Inc 6.63
Mastercard Inc 6.54
Workday Inc 4.20
Advanced Micro Devices Inc 3.76
NVIDIA Corp 3.06
AbbVie Inc 3.02
CoStar Group Inc 3.02
Deere & Co 2.99
Total 52.78
View full holdings
Portfolio Characteristics (As of 04/30/2023)
  FUND INDEX
Number of Holdings
Equity Issues
36 509
Market Capitalization
Weighted Average
$728.50B $835.33B
Portfolio Turnover Rate
(1-year trailing)
39.93% -
Price/Earnings Ratio
(1-year forward)
25.22 23.72
Price/Book Ratio
7.27 9.29
Earnings Growth Rate
(1-year forward)
33.46% 26.80%
Sector Allocation % OF FUND % of Index % OF FUND % of Index (As of 04/30/2023)
Regional Allocation % OF FUND % of Index % OF FUND % of Index (As of 04/30/2023)
Market Capitalization Range of Equity Holdings % OF FUND % of Index % OF FUND % of Index (As of 04/30/2023)
Developed vs Emerging Markets % OF FUND % of Index % OF FUND % of Index (As of 04/30/2023)

Documents