About this Fund
A long-only portfolio that seeks a high level of current income and steady capital appreciation. The Fund seeks global, high-quality, income-producing equities with a focus on international companies.
Why Invest in this Fund
Income, Regardless of Environment
With our global approach, we seek to take advantage of various market environments to find the best income-producing equities. We tend to focus on international equities where the income-generating potential may be greater.
Regional Rotation Strategy
We use a specialized rotation strategy intended to capitalize on the global seasonality of dividends.
Differentiated Income Option
The Fund may be an attractive alternative to preferred stock and fixed income. The Fund holds 100% equities with no leverage and a quarterly dividend distribution schedule.
A History of High, Dependable Income
By investing in quality companies and leveraging a specialized regional rotation strategy, the Fund has been able to capitalize on higher dividends paid out overseas to generate an attractive level of income since inception.
A Record of Regular Distribution
Quarterly distribution yield – Class I Shares (9/30/07 – 6/30/26)
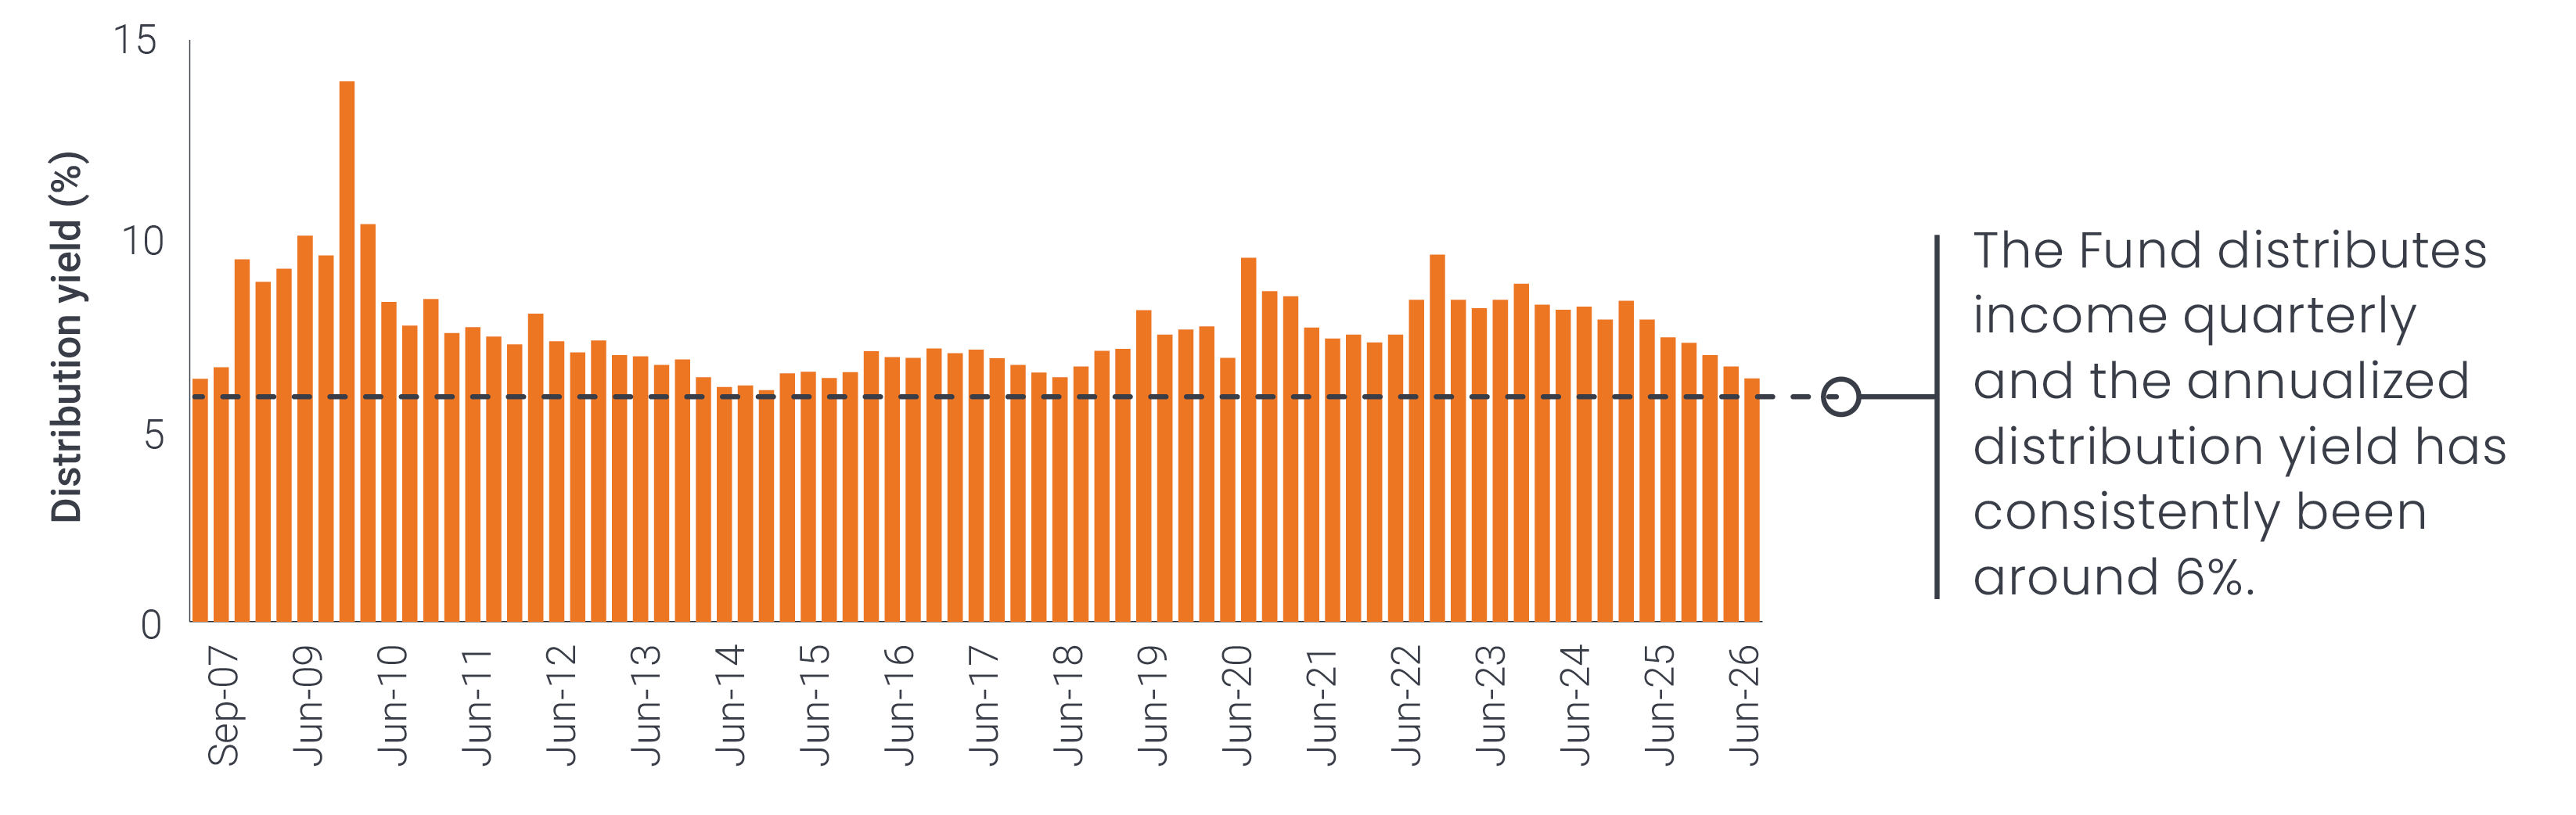
Distribution yields are as of each quarter-end. Data is for Class A Shares from 6/30/07 – 3/31/09 and Class I Shares from 4/30/09 – Present. Class I Shares became available in 2009. Distribution Yield is calculated by taking the trailing 365 days of distributions and dividing by the net asset value on the last business day for the same period.
The yield does not include long- or short-term capital gains distributions.
As of 6/30/26, the 30-Day SEC Yield with/without waivers was 3.01%. 30-Day SEC yield is a standardized yield calculated based on a snapshot of current underlying holdings and doesn’t account for active trading throughout a full calendar year.


