
Kernpunten
- Over een horizon van 20 jaar hebben Europese kwaliteitsaandelen waarde rendementen opgeleverd die hoger liggen dan die van diepe waarde.
- Hoewel deep waarde aandelen in waardering extreme omstandigheden beter hebben gepresteerd, kwam deze outperformance tot stand in een relatief korte periode en werd deze uiteindelijk uitgehold.
- Wij zijn van mening dat Europese kwaliteitsaandelen waarde aantrekkelijker zijn voor langetermijnbeleggers.
Waar liggen de beste en meest consistente rendementen binnen de waarde van de Europese markt?
Dit is een vraag die mij vaak wordt gesteld door klanten en mijn typische antwoord is dat kwaliteit waarde na verloop van tijd de neiging heeft om beter te presteren dan diepe waarde. Ja, diepe waarde heeft zijn momenten in de zon, maar deze zijn meestal van korte duration en worden meestal vervangen door langere perioden van kwaliteit waarde outperformance.
Om dit fenomeen te illustreren, heb ik een studie uitgevoerd in markten die in euro luiden. De resultaten tonen aan dat deep waarde aandelen de neiging hebben om beter te presteren wanneer de waardering spread (het verschil in waardering tussen goedkope en dure aandelen) op de markten hoog of extreem hoog is. Zodra deze spreads beginnen te verkrappen, nemen waarde kwaliteitsaandelen het meestal over als de uitblinkers.
De waarde test
Voor deze exercitie heb ik gebruik gemaakt van historische koers-winstverhoudingen (K/B) om diepe waarde te definiëren, omdat deze maatstaf naar mijn mening het ondernemingsklimaat voor individuele bedrijven via ingehouden winsten/verliezen het beste weergeeft. Kwaliteit waarde werd gedefinieerd als aandelen die verkeerd geprijsd zijn ten opzichte van hun balans structuur, winst/kasstromen, hun retentiebeleid en hun huidige rating ten opzichte van hun veronderstelde duurzame rendementsprofiel, de kern van de screening die we gebruiken om verkeerd geprijsde kwaliteitsaandelen te vinden voor de Euroland-strategie.
Met behulp van FactSet analyseerden we 20 jaar historische bedrijfsgegevens (31/01/2003 – 31/01/2023) en brachten we de rendementen van de goedkoopste aandelen in kaart in twee groepen (deep waarde en quality waarde, zoals hierboven gedefinieerd). Beide groepen hadden ongeveer dezelfde steekproefomvang en er was geen overlevingsbias in het onderzoek; Het is echter belangrijk op te merken dat er een small cap effect is op de totale resultaten, aangezien alle posities over een periode van 20 jaar gelijk werden gewogen. Bovendien worden financiële aandelen apart weergegeven omdat het scherm dat wordt gebruikt om kwaliteits waarde voor niet-financiële aandelen te identificeren, een contanten maatstaf bevat die niet geschikt is voor de financiële sector.
De studie ondersteunt de veronderstelling dat diepe waarde in waardering extremen inderdaad beter presteert dan kwaliteits waarde, maar dat dergelijke outperformance over een relatief korte periode tot stand komt en uiteindelijk wordt uitgehold en overtroffen.
Uit het onderzoek blijkt dat in de onderzochte periode kwaliteit waarde in ongeveer 80%+ van de tijd beter presteert dan deep waarde voor niet-financiële bedrijven en ongeveer 85% van de tijd voor financials. De gemiddelde vergelijkende rendementen voor elk mandje in grafiek 1 hebben betrekking op de aanhoudperiode van 12 maanden vanaf de selectiedatum. Numeriek geldt: hoe lager de waarde voor de mand, hoe lager de waardering de spreiding in de markten en vice versa.
Voor het niet-financiële universum waren de gemiddelde rendementen over 12 maanden over de periode van 20 jaar als volgt: Diepe waarde: 9,4% per jaar, kwaliteit waarde: 13,0% per jaar.
Voor het financiële universum waren de gemiddelde rendementen over 12 maanden over de onderzoeksperiode van 20 jaar als volgt: Deep waarde: 0,5% per jaar, kwaliteit waarde: 4,0% per jaar.
Niet-financiële waarden
Grafiek 1: Kwaliteit waarde rendementen versus rendementen op diep waarde en spreidingsniveaus (niet-financiële waarden)
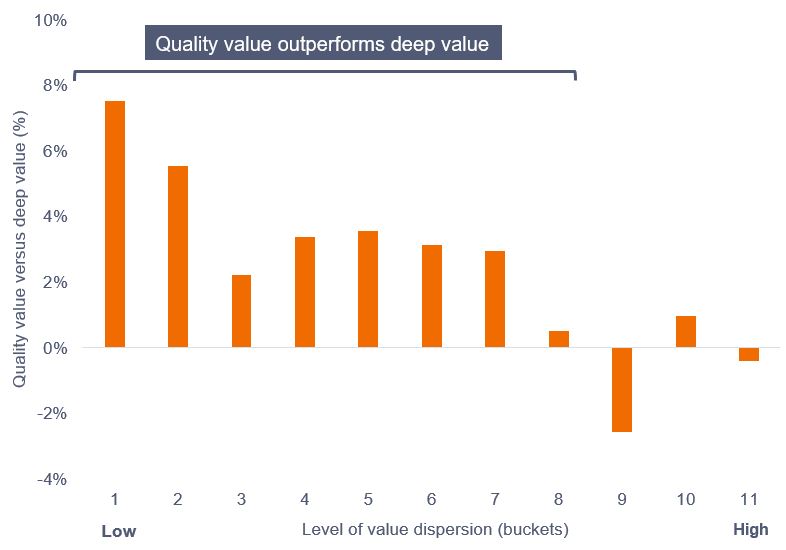
Bron: FactSet/Janus Henderson, Universe = MSCI EMU Index & FTSE World EMU region Index, niet-financiële aandelen samengevoegd. 20 jaar verschil in gemiddeld maandelijks rendement tussen Quality Value en Deep Value van januari 2003 tot januari 2023. De toegekende mandjes zijn gekoppeld aan de mate van waardering spreiding binnen de markten, waardering bepaald door de koers-winstverhouding. In het verleden behaalde resultaten geven geen future rendementen weer.
Grafiek 2: Tijd besteed in het niveau van de spreidingskorf (niet-financiële factoren)
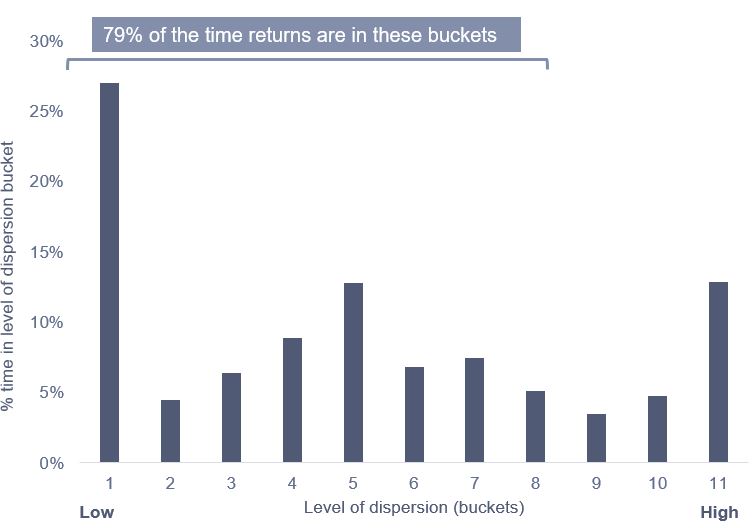
Bron: FactSet/Janus Henderson, Universe = MSCI EMU Index & FTSE World EMU region Index, niet-financiële aandelen samengevoegd, 20 jaar van januari 2003 tot januari 2023. De toegekende mandjes zijn gekoppeld aan de mate van waardering spreiding binnen de markten, waardering bepaald door de koers-winstverhouding. In het verleden behaalde resultaten geven geen future rendementen weer.
Financiële effecten
De studie voor financials was op twee manieren problematischer. Ten eerste is de spreiding van de waarderingen in de sector de afgelopen 20 jaar veel groter geweest. Om deze reden hebben we meer mandjes in onze analyse opgenomen. Ten tweede kunnen de lezers met arendsogen zien dat er geen 'emmer 1' is. Dit komt omdat 1) de spreiding in de financiële sector nooit laag genoeg is geworden om in de parameters te komen die we voor deze korf hebben vastgesteld, en 2) de rendementen volatieler waren op 12-maandsbasis. Als we de aanhoudperiode vervroegen naar een langer tijdsbestek – bijvoorbeeld twee tot drie jaar – komt de vorm van rendement dichter bij die van de rest van de markt. Om financiële en niet-financiële gegevens echter beter te kunnen vergelijken, hanteren we een tijdsbestek van 12 maanden. Net als bij niet-financiële bedrijven laat de financiële sector een langdurige outperformance zien voor hoogwaardige waarde.
Grafiek 3: Kwaliteit waarde rendementen versus rendementen op diep waarde en spreidingsniveaus (financiële waarden)
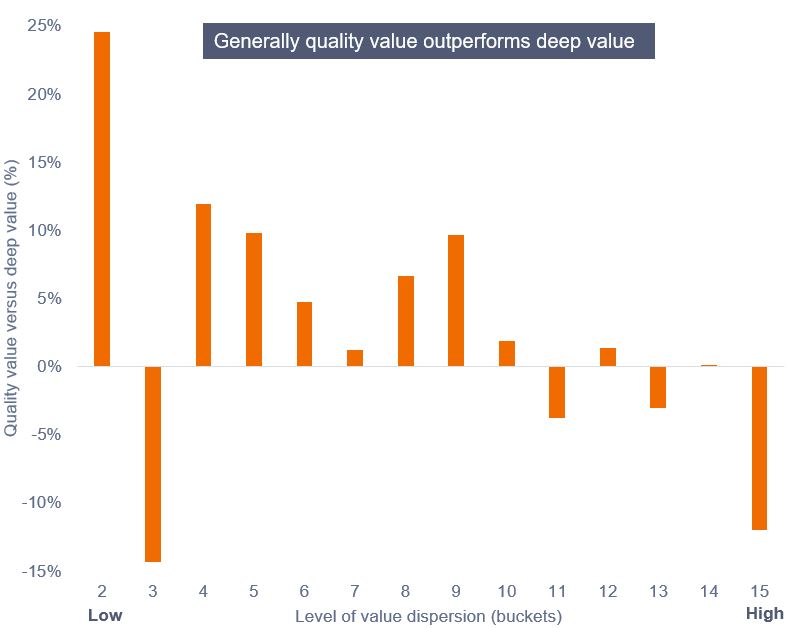
Bron: FactSet/Janus Henderson, Universe = MSCI EMU Index & FTSE World EMU region Index, financiële aandelen samengevoegd. 20 jaar verschil in gemiddeld maandelijks rendement tussen Quality Value en Deep Value van januari 2003 tot januari 2023. De toegekende mandjes zijn gekoppeld aan de mate van waardering spreiding binnen de markten, waardering bepaald door de koers-winstverhouding. In het verleden behaalde resultaten geven geen future rendementen weer.
Grafiek 4: Tijd besteed in het niveau van de spreidingskorf (financiële gegevens)
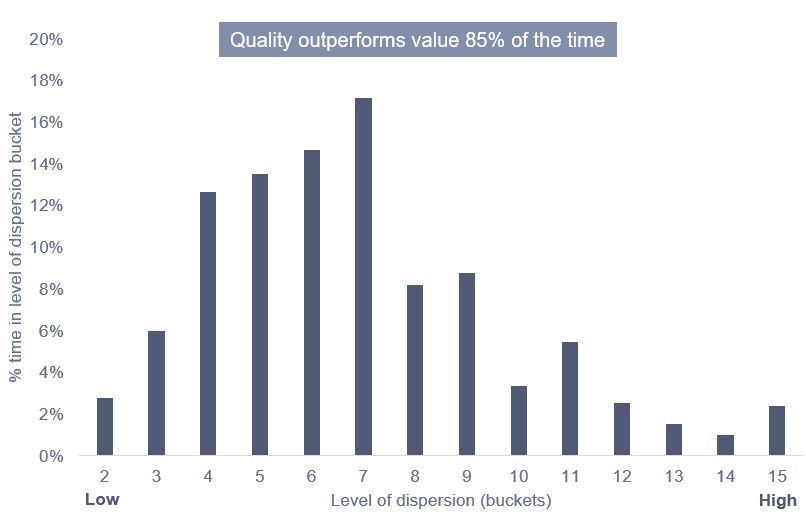
Bron: FactSet/Janus Henderson, Universe = MSCI & FTSE World EMU region financial stocks Index samengevoegd. 20 jaar, van januari 2003 tot januari 2023. De toegekende mandjes zijn gekoppeld aan de mate van waardering spreiding binnen de markten, waardering bepaald door de koers-winstverhouding. In het verleden behaalde resultaten geven geen future rendementen weer.
Conclusie
Onze studie ondersteunt de veronderstelling dat in waardering extreme gevallen diepe waarde beter presteert dan kwaliteits waarde maar dat dergelijke outperformance over een relatief korte periode tot stand komt en uiteindelijk wordt uitgehold. Op de langere termijn suggereert het onderzoek (20 jaar maandelijkse gegevens) dat kwaliteit waarde ongeveer 80%+ van de tijd beter presteert dan diepe waarde voor niet-financiële bedrijven en ongeveer 85% van de tijd voor financiële instellingen.
Op het huidige niveau in Europa presteert kwaliteit relatief minder dan de niveaus die we voor het laatst in 1999/2000 meemaakten (grafiek 5).
Grafiek 5: Relatieve prestaties voor Europese kwaliteitsaandelen
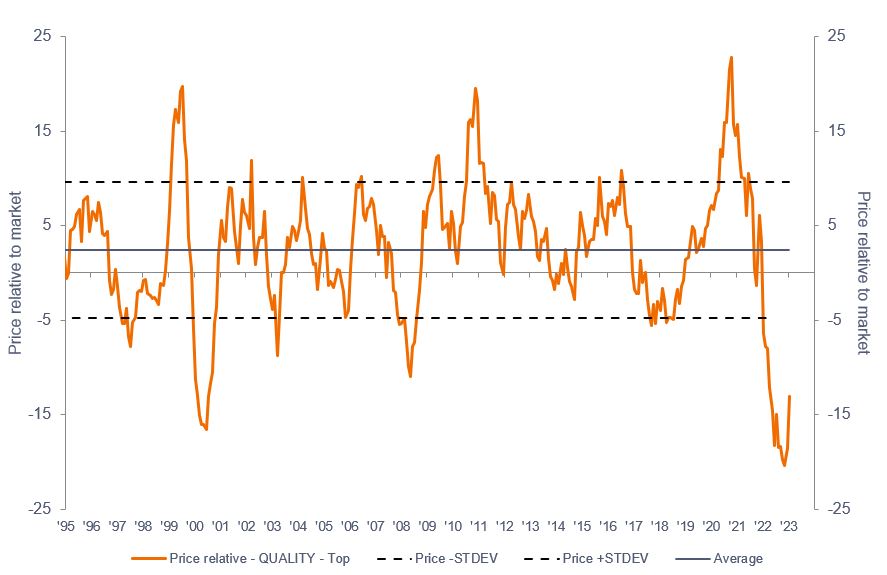
Bron: JP Morgan. Gegevens van december 1994 tot januari 2023. In het verleden behaalde resultaten geven geen future rendementen weer.
Hoewel timing altijd moeilijk te voorspellen zal zijn, pleit het voor het beantwoorden van de vraag waarom beleggers kwaliteits waarde zouden moeten aanhouden in plaats van diepe waarde, voor het aanhouden van kwaliteits waarde boven iets anders dan de korte termijn.
Dit zijn de standpunten van de auteur op het moment van publicatie en kunnen verschillen van de standpunten van andere personen/teams bij Janus Henderson Investors. Verwijzingen naar individuele effecten vormen geen aanbeveling om effecten, beleggingsstrategieën of marktsectoren te kopen, verkopen of aan te houden en mogen niet als winstgevend worden beschouwd. Janus Henderson Investors, zijn gelieerde adviseur of zijn medewerkers kunnen een positie hebben in de genoemde effecten.
Resultaten uit het verleden geven geen indicatie over toekomstige rendementen. Alle performancegegevens omvatten inkomsten- en kapitaalwinsten of verliezen maar geen doorlopende kosten en andere fondsuitgaven.
De informatie in dit artikel mag niet worden beschouwd als een beleggingsadvies.
Er is geen garantie dat tendensen uit het verleden zich zullen doorzetten of dat prognoses worden gehaald.
Reclame.
Belangrijke informatie
Lees de volgende belangrijke informatie over fondsen die vermeld worden in dit artikel.
- Aandelen/Deelnemingsrechten kunnen snel in waarde dalen en gaan doorgaans gepaard met hogere risico's dan obligaties of geldmarktinstrumenten. Als gevolg daarvan kan de waarde van uw belegging dalen.
- Als een Fonds een hoge blootstelling heeft aan een bepaald land of een bepaalde geografische regio, loopt het een hoger risico dan een Fonds dat meer gediversifieerd is.
- Het Fonds kan gebruikmaken van derivaten om het risico te verminderen of om de portefeuille efficiënter te beheren. Dit gaat echter gepaard met andere risico's, waaronder met name het risico dat een tegenpartij bij derivaten niet in staat is om haar contractuele verplichtingen na te komen.
- Als het Fonds activa houdt in andere valuta's dan de basisvaluta van het Fonds of als u belegt in een aandelenklasse/klasse van deelnemingsrechten in een andere valuta dan die van het Fonds (tenzij afgedekt of 'hedged'), kan de waarde van uw belegging worden beïnvloed door veranderingen in de wisselkoersen.
- Wanneer het Fonds, of een afgedekte aandelenklasse/klasse van deelnemingsrechten, tracht de wisselkoersschommelingen van een valuta ten opzichte van de basisvaluta te beperken, kan de afdekkingsstrategie zelf een positieve of negatieve impact hebben op de waarde van het Fonds vanwege verschillen in de kortetermijnrentevoeten van de valuta's.
- Effecten in het Fonds kunnen moeilijk te waarderen of te verkopen zijn op het gewenste moment of tegen de gewenste prijs, vooral in extreme marktomstandigheden waarin de prijzen van activa kunnen dalen, wat het risico op beleggingsverliezen verhoogt.
- Het Fonds kan geld verliezen als een tegenpartij met wie het Fonds handelt niet bereid of in staat is om aan zijn verplichtingen te voldoen, of als gevolg van een fout in of vertraging van operationele processen of verzuim van een derde partij.
- Het Fonds volgt een waardebeleggingsstijl die leidt tot een voorkeur voor bepaalde soorten bedrijven. Dit kan ertoe leiden dat het Fonds aanzienlijk minder goed of beter presteert dan de bredere markt.