European loans in a sweet spot for higher income
For higher income seeking investors, European secured loans have much to offer at this juncture. According to Tim Elliot, portfolio manager, and David Huang, associate portfolio manager, major positives for this asset class include high cash yields, attractive spreads relative to history, modest default expectations and pricing that has already discounted some economic weakening.


7 minute read
Key takeaways:
- Yields on European loans, currently north of 8%, offer a reassuring cushion against an uncertain economic outlook and the prospect of a further uptick in default rates from low levels.
- Valuations relative to other risk assets in fixed income, like high yield, look attractive on an historical basis and the default outlook for loans appears manageable.
- While cash rates appear close to peaking, easing concerns about a hard landing for the global economy, uncertainty around inflation levels and the possibility of higher-for-longer rates suggest income from this asset class could remain elevated for some time.
With 2023 more than half over, it seems an appropriate time to take stock and look at the secured loan market performance year-to-date and expectations for the remainder of the year.1
The mood around loans heading into 2023 was somewhat pessimistic given expectations for a material slowdown in economic activity. This was expected to impact lower rated companies more severely, combined with concerns that rising interest rates would materially impacted loan borrowers’ ability to service their floating rate debt.
Our view was cautious but not negative, as highlighted in the piece we wrote in January 2023 entitled: ”Loans look-through: a year for income?”. We felt the key driver of return for loans would be the high coupons resulting from the increase in underlying cash rates.
This has indeed been the case and with investors across credit markets becoming less concerned about a hard landing for the global economy, we have seen some modest spread tightening since the start of the year (figure 1).
Figure 1: Floating rate instruments have held up well amid broader volatility
Year-to-date total and excess returns across broad fixed income markets
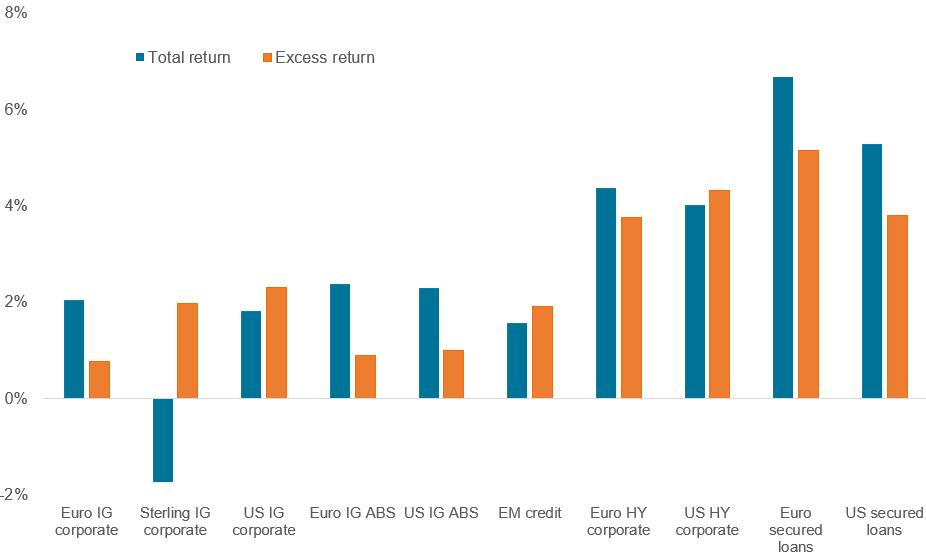
Source: Janus Henderson, ICE BofA, Credit Suisse, Barclays, as at 31 August 2023. Note: Returns in euros. For illustrative purposes and not indicative of any actual investment. Past performance does not predict future returns.
Whilst investor concerns have abated somewhat, inflation has continued to prove quite sticky and, as a result, central banks have been forced to continue to tighten monetary policy and push up short-term rates (figure 2). Loans as a floating rate asset class have continued to benefit from this.
Figure 2: Surging short-term rates have benefited floating rate assets
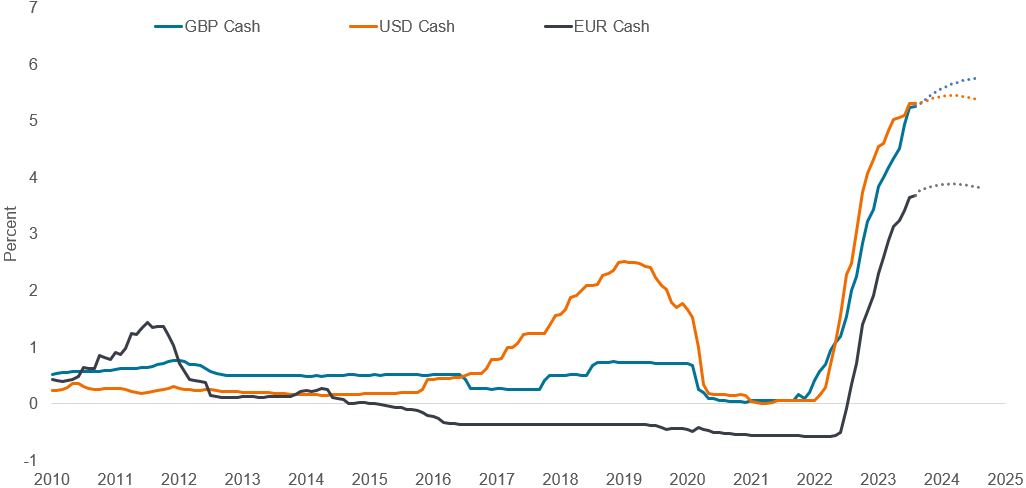
Source: Janus Henderson, Bloomberg and ICE, as at 31 August 2023. Note: Data is based on 1-month LIBOR up to 31 December 2020, then SONIA, ESTR and SOFR 1-month rates. Forward rates are based on OIS curves as at 31 August 2023. There is no guarantee that past trends will continue, or forecasts will be realised.
Attractive yields offer buffer against economic uncertainty
The current yield on the Credit Suisse Western European Leveraged Loan Index (WELLI) rose above 8% at the end of June (figure 3) and, as at 31 August 2023 now sits at 8.4%, a 15-year high.2 This yield offers a considerable buffer should the economic outlook decline. It could be argued that with an average loan price of 95.90, the European market is already pricing in some weakness. Excluding the periods covering Covid and the opening of the war in the Ukraine, loans are trading at levels not seen since 2016.
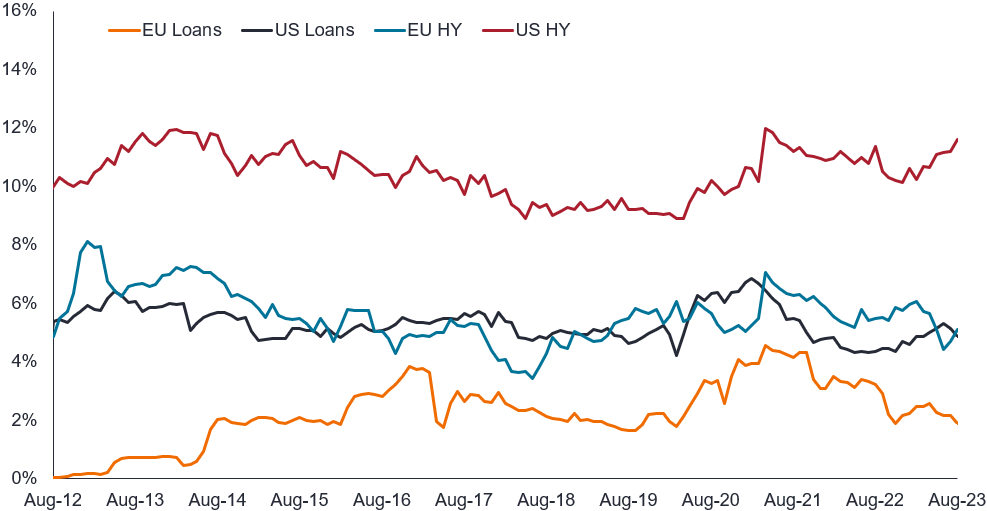
Figure 3: Cash interest receipts rising in European secured loans
High yield versus loans (average coupon)
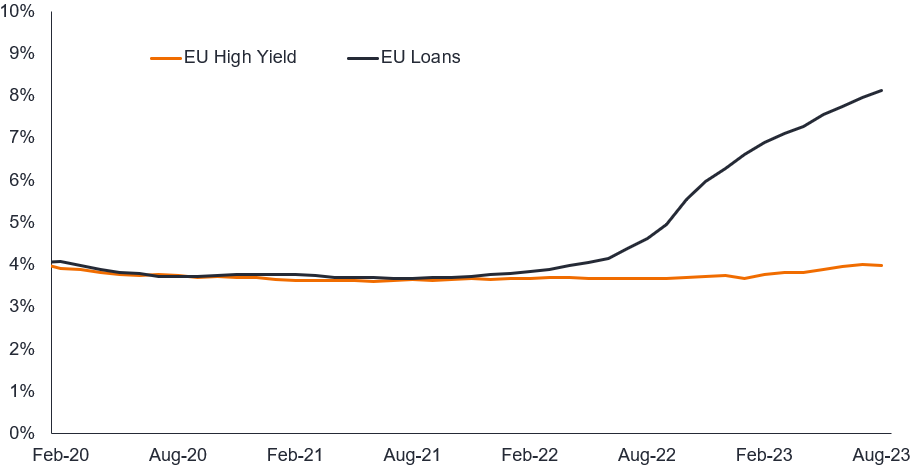
Source: Bloomberg, ICE BAML, Credit Suisse, as at 31 August 2023. Past performance does not predict future performance.
Figure 4: Valuations attractive relative to history and other fixed income asset classes
Spread ranges – percentile rank (current versus 20-year history)
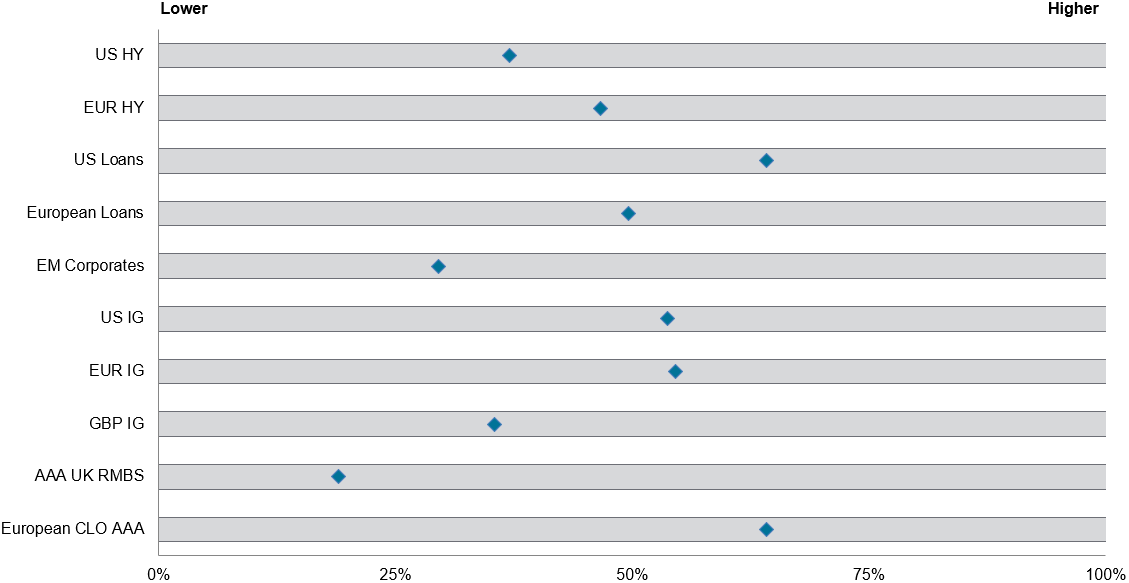
Source: Janus Henderson Investors, Bloomberg, Credit Suisse, JP Morgan, Citi as at 31 August 2023. Note: Data points represent percentile spread rankings as at 31 August 2023, relative to history. Data for CLOs and UK RMBS from 2006 to date (31 August 2023). All other data is over a 20-year time period (31 August 2003 to 31 August 2023). Indices used as asset class proxies: Credit Suisse Western European Leveraged Loan Index, Credit Suisse Leveraged Loan Index, JP Morgan UK RMBS AAA 5y GBP, ICE BofAML US High Yield Index, ICE BofAML European Currency Non-Financial High Yield 2% Constrained, ICE BofAML US Emerging Markets Liquid Corporate Plus Index, ICE BofAML Sterling Corporate Index, ICE BofAML US Corporate Index, ICE BofAML Euro Corporate Index. CLOs based on Citi Velocity European 1.0 AAA CLOs up to March 2013 then European 2.0 AAA CLOs thereafter. Index data is for illustrative purposes and not indicative of any actual investment.
Defaults have risen but are not currently a cause for concern
One of the concerns expressed at the start of the year was that loans were not as well placed to withstand a recessionary period and would experience increasing defaults given the average loan borrower tends to be lower rated. This was a fair observation, and loan defaults have ticked up, albeit from a very low level (figure 5).
Figure 5: Defaults among European loan issuers are at manageable levels
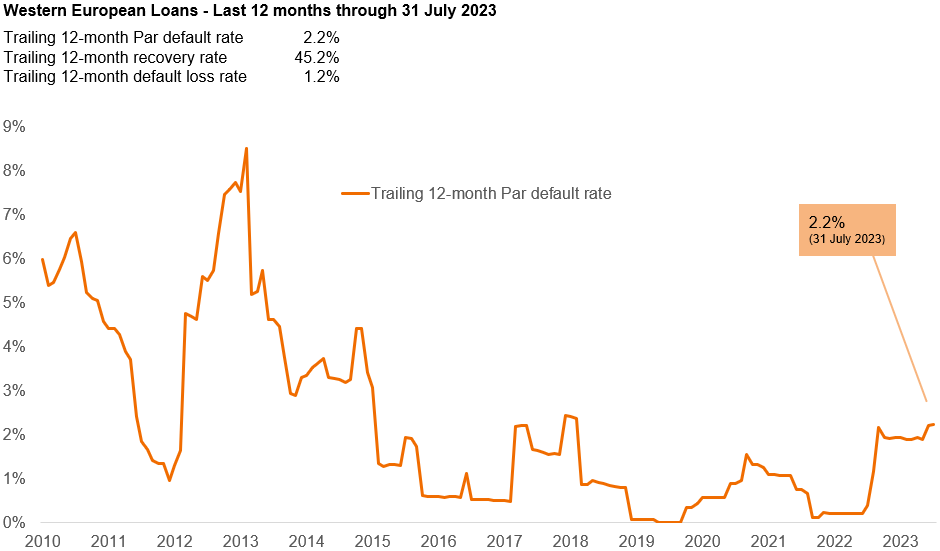
Source: Credit Suisse, as at 31 July 2023.
We do not see this as an immediate cause for concern and would highlight the fact that two of the main defaults over the last 12 months were cinema chains Cineworld and Vue, businesses that had struggled to recover post Covid. There are a couple of reasons why we feel loan defaults will prove manageable:
- Most issuers in the European loan market are owned by private equity firms. Private equity is sat on a record US$2.5 trillion of dry powder and we would expect them to continue to offer support/liquidity to their portfolio businesses should the need arise.3 We have seen a number of recent examples of this type of behaviour, with EQT recently injecting new equity of €800m into its portfolio company IVC (a veterinary services business) to fund continued growth.
- Something we have highlighted before is that European loans have a lower proportion of CCC-rated issuers than other leverage finance markets. It is here – in this rating band – that we would expect the bulk of defaults to originate from. These are the weaker companies, which are more vulnerable to an economic slowdown.
Figure 6: Risk in European loans is relatively measured
CCC ratings across leveraged finance
Source: Janus Henderson Investors, Credit Suisse, as at 31 August 2023. ICE BofA Euro High Yield; ICE BofA US High Yield Index; Credit Suisse Western European Leveraged Loan Index (CS WELLI); Credit Suisse US Leveraged Loan Index. HY = high yield. Note: Index data is for illustrative purposes only and not indicative of any actual investment. Please see Appendix for index descriptions. Past performance does not predict future returns.
An attractive asset class for investors seeking higher income
To summarise, we continue to see secured loans as an attractive asset class for those investors looking for higher income. Key reasons for this are as follows:
- The cash yield from the asset class sits at a 15-year high. Whilst cash rates appear close to peaking, there is no suggestion that this hiking cycle will be quickly reversed, suggesting income from this asset class could remain elevated for some time;
- Spreads remain wide versus history and compared to many other fixed income asset classes;
- Loan prices still look slightly depressed versus recent history, offering some capital upside; and
- Default expectations seem manageable at this point.
Footnotes
1 Year-to-date is as at 31 August 2023.
2 The Credit Suisse Western European Leveraged Loan Index (WELLI) is designed to mirror the investable universe of the Western European leveraged loan market. Loans denominated in US$ or Western European currencies are eligible for inclusion in the index, which is rebalanced monthly on the last business day of the month.
3 Source: S&P Global Market Intelligence, 20 July 2023. The global dry powder total as of early July 2023 represented a greater than 11% increase over the December 2022 total of $2.24 trillion, according to S&P Global Market Intelligence and Preqin data.
SONIA: The Sterling Overnight Index Average (SONIA) is an important interest rate benchmark administered by the Bank of England. SONIA is based on actual transactions and reflects the average of the interest rates that banks pay to borrow sterling overnight from other financial institutions and other institutional investors.
ESTR: The euro short-term rate (€STR) reflects the wholesale euro unsecured overnight borrowing costs of banks located in the euro area. The European Central Bank published the €STR for the first time on 2 October 2019.
SOFR: The Secured Overnight Financing Rate (SOFR) is a broad measure of the cost of borrowing cash overnight, collateralised by US Treasury securities.
Loan discount margin: A discount margin (DM) is a type of yield spread calculation designed to estimate the average expected return of a floating-rate security that’s earned in addition to the index underlying, or reference rate of, the security. The size of the discount margin depends on the price of the floating- or variable-rate security.
Recovery rate: The extent to which principal and accrued interest on defaulted debt can be recovered, expressed as a percentage of face value.
Credit rating: A score usually given by a credit rating agency such as Standard & Poors, Moody’s and Fitch on their creditworthiness of a borrower. Standardised scores such as ‘AAA’ (a high credit rating) or ‘B’ (a low credit rating) are used however can vary depending on the credit rating agency. Moody’s, another well-known credit rating agency, uses a slightly different format with Aaa (a high credit rating) and B3 (a low credit rating).
Maturity: The date when the issuer of a bond must repay the principal amount and any final interest to the holder of the bond. The maturity date is set when the bond is first issued, but the bondholder can typically sell at any time before this date. Bonds can be short-term, medium-term or long-term, referring to the length of maturity.
Duration: How far a fixed income security or portfolio is sensitive to a change in interest rates, measured in terms of the weighted average of all the security/portfolio’s remaining cash flows (both coupons and principal). It is expressed as a number of years. The larger the figure, the more sensitive it is to a movement in interest rates. ‘Going short duration’ refers to reducing the average duration of a portfolio. Alternatively, ‘going long duration’ refers to extending a portfolio’s average duration.
Floating Rate: An interest rate that moves up and down. Also known as a variable rate or adjustable rate, it can refer to any debt instrument such as a bond, loan or mortgage, that does not have a fixed rate of interest.
Asset-Backed Securities/Securitised Debt: A financial security which is backed by a pool of underlying assets such as loans, credit card debts or leases. Securitisation is the process in which certain types of assets are pooled and repackaged into interest-bearing securities. Often, there can be different tranches of securities created by a securitisation that have different risk profiles, reflecting the priority order in which interest and principal payments from the underlying assets are passed through to the holders of the securities.
Yield: The level of income on a security, typically expressed as a percentage rate. For equities, a common measure is the dividend yield, which divides recent dividend payments for each share by the share price. For a bond, this is calculated as the coupon payment divided by the current bond price.
Yield to Maturity: The yield to maturity is the expected annualised rate of return earned by an investor who buys a bond at the market price and holds it until maturity. Mathematically, it is the discount rate at which the sum of all future cash flows (from coupons and principal repayment) equals the price of the bond.
Fixed income securities are subject to interest rate, inflation, credit and default risk. The bond market is volatile. As interest rates rise, bond prices usually fall, and vice versa. The return of principal is not guaranteed, and prices may decline if an issuer fails to make timely payments or its credit strength weakens.
High-yield or “junk” bonds involve a greater risk of default and price volatility and can experience sudden and sharp price swings.
Credit Spread is the difference in yield between securities with similar maturity but different credit quality. Widening spreads generally indicate deteriorating creditworthiness of corporate borrowers, and narrowing indicate improving.
Volatility measures risk using the dispersion of returns for a given investment.
These are the views of the author at the time of publication and may differ from the views of other individuals/teams at Janus Henderson Investors. References made to individual securities do not constitute a recommendation to buy, sell or hold any security, investment strategy or market sector, and should not be assumed to be profitable. Janus Henderson Investors, its affiliated advisor, or its employees, may have a position in the securities mentioned.
Past performance does not predict future returns. The value of an investment and the income from it can fall as well as rise and you may not get back the amount originally invested.
The information in this article does not qualify as an investment recommendation.
Marketing Communication.
7 minute read
Key takeaways:
- Yields on European loans, currently north of 8%, offer a reassuring cushion against an uncertain economic outlook and the prospect of a further uptick in default rates from low levels.
- Valuations relative to other risk assets in fixed income, like high yield, look attractive on an historical basis and the default outlook for loans appears manageable.
- While cash rates appear close to peaking, easing concerns about a hard landing for the global economy, uncertainty around inflation levels and the possibility of higher-for-longer rates suggest income from this asset class could remain elevated for some time.