
Key takeaways:
- Modest economic growth and supportive central bank policy should, in our view, sustain positive high yield bond performance in 2026, with income as the primary return driver.
- Refinancing pressures should ease as coupons decline but investors still need to be selective and avoid bonds from over-leveraged issuers.
- Credit spreads are tight on average, reflective of generally favourable corporate conditions, but careful analysis can help identify areas of value.
After another year of positive total returns in 2025 from high yield bonds1 – which broadly reflects their yields – we believe the outlook in 2026 could prove similar. We see income being the primary source of returns and a resilient economy enabling defaults to be contained. We recognise that we are later in the credit cycle and valuations are trading at richer levels. This argues for a more selective approach, but we think investors can take advantage of value emerging in some areas.
A supportive economy
One of the useful things about being bond investors is we do not need the economy to be firing on all cylinders. Moderate growth will often do just fine. Projections of modest economic growth in 2026 should support cashflows, helping to meet repayment obligations to bondholders, without igniting major concerns around inflation.
Figure 1: Modest economic growth akin to recent years
Real gross domestic product growth (%)
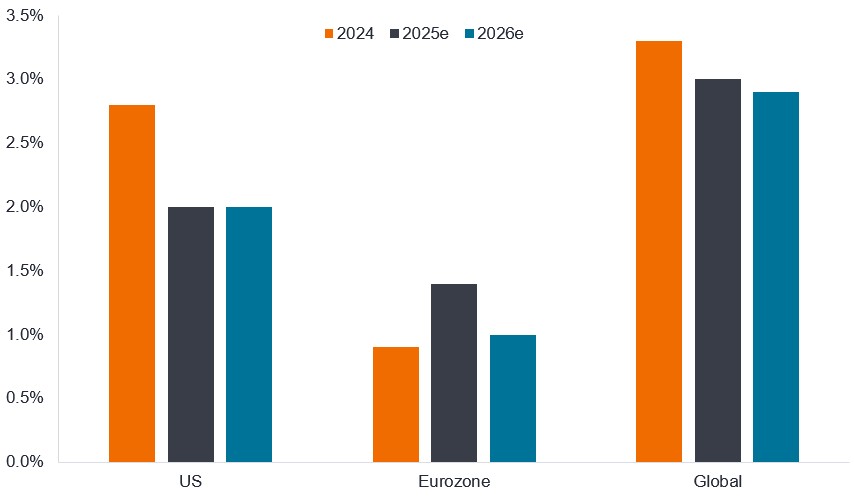
Source: Bloomberg, consensus economic growth forecasts, at 5 December 2025. 2025 and 2026 are estimates. Real gross domestic product (real GDP) is a measure of the value of economic output adjusted for price changes. There is no guarantee that past trends will continue, or forecasts will be realised.
Tax cuts in the US should provide a boost to capex and help consumers. In Europe, we expect the uplift in German government spending to help support the regional economy. Earnings growth is expected to remain positive in 2026, but we think merger and acquisition activity could rise as companies seek to acquire market share and governments/regulators follow the US in being more amenable to corporate mergers. This could create opportunities among high yield bonds if they are taken over by companies with a better credit rating.
Refinance shock is dissipating
The global rise in interest rates that took place in 2022 gave way to monetary easing in 2024-5 but we are still seeing the lagged effects of the earlier rate rises. Figure 2 shows that the average coupon (interest rate paid on bonds) in the US crept up during 2025 as low coupon bonds (with rates of 5-6%) from 2020-21 were refinanced at higher rates.
Figure 2: Lower yield environment should see coupon rates level off
Yield and average coupon on US high yield bonds
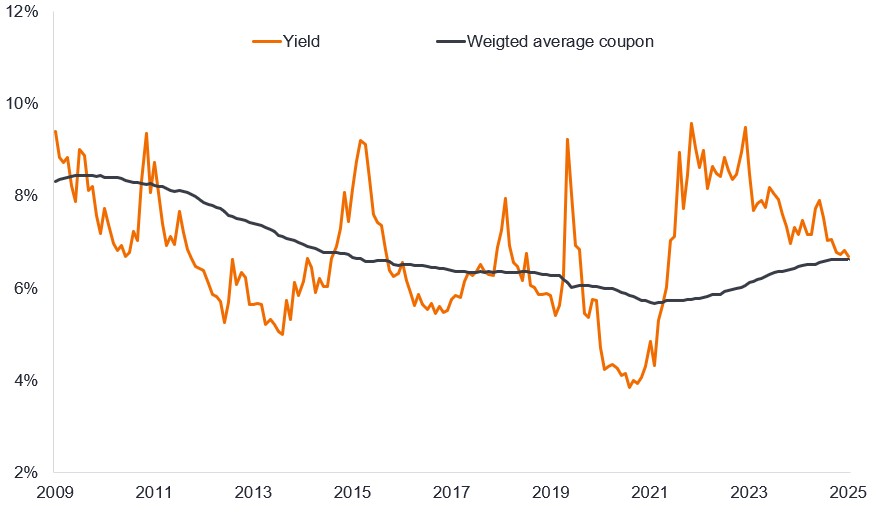
Source: Bloomberg, ICE BofA US High Yield Index, 30 November 2009 to 30 November 2025. Average coupon is the average of the constituent coupons in the index weighted by market value. Coupon is the regular interest payment that is paid on a bond described as a percentage of the face value of an investment. For example, if a bond has a face value of $100 and a 5% annual coupon, the bond will pay $5 a year in interest. The yield shown is yield to worst, which is the lowest yield a bond with a special feature (such as a call option) can achieve provided the issuer does not default. Past performance does not predict future returns. Yields may vary over time and are not guaranteed.
The good news for corporates is that coupons on newly issued bonds are coming down. The average coupon on newly issued US dollar high yield bonds has fallen from 8-9% in 2023 to closer to 7.2% in late 2025.2 This is not far above the 6.6% weighted average coupon of existing bonds, so companies are facing less of a refinancing shock. In fact, for some BB and B rated corporates, yields are beginning to move below their existing coupons, which could encourage borrowers to refinance early to take advantage of lower financing costs.
For investors facing the possibility of further interest rate cuts from the US Federal Reserve and a European Central Bank likely to be on hold, we believe that the income on high yield bonds offers attractions to investors. At the end of November 2025, yields on high yield bonds averaged 6.7% in the US and 5.1% in Europe.3
Credit spreads: Why it is important to look beyond averages
There has been much discussion about credit spreads (the difference in yield between a corporate bond and the yield on a government bond of similar maturity). The spread can be thought of as compensation that investors demand for taking on the risk of investing in corporate bonds.
We recognise that average spreads across corporate bonds, whether investment grade or high yield, are low (tight). This is not a bad thing. It signals that the market is reasonably confident that most bonds will meet their repayments (a reflection of the benign economic conditions alluded to earlier). But neither is the market ignoring some of the stresses, which is why spreads for lower quality bonds (those rated CCC or lower) widened during 2025 and are not far off their average for the last 20 years.
Figure 3: Bifurcation in market between higher and lower quality bonds
Spreads on BBB, BB, B, and CCC or lower rated corporate bonds (basis points)
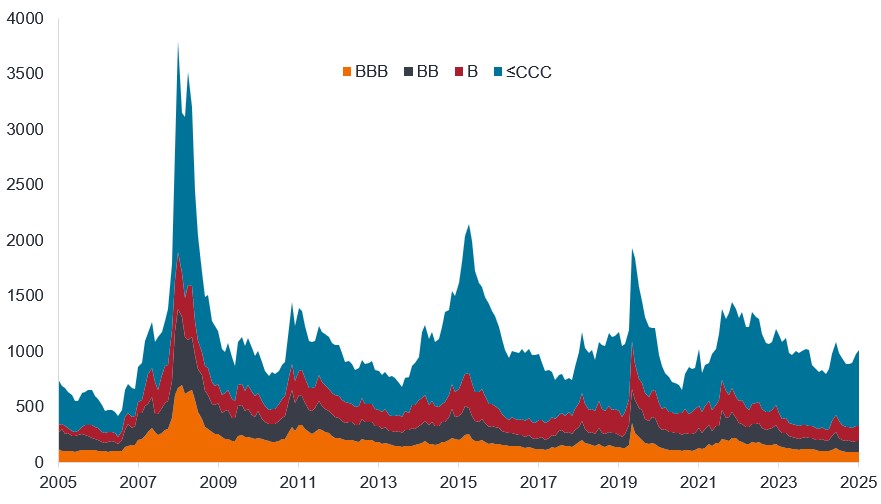
Source: Bloomberg, Govt OAS (option-adjusted spread over government bonds), ICE BofA BBB Global Corporate Index, ICE BofA BB Global High Yield, ICE BofA Single-B Global High Yield Index, ICE BofA CCC & Lower Global High Yield Index, 30 November 2005 ro 30 November 2025. Basis point (bp) equals 1/100 of a percentage point, 1bp = 0.01%. The spread has been presented as an overlapping area chart so that you can see how spreads widen and shrink in relation to the other rating tiers. BBB represents the lowest tier of investment grade (and is included for reference), BB is the highest quality tier of high yield, B is the middle tier of high yield and CCC or lower is the lowest quality tier of high yield. Past performance does not predict future returns.
What we are seeing is a bifurcation in the market. Bond prices of higher quality names have risen as investors look for yield but in a defensive way. This has caused credit spreads to tighten on BB rated bonds, whereas spreads have widened among lower quality names rated CCC or lower. We think uncertainty around tariffs, mixed (and missing) economic data in the US, and some high-profile insolvencies, led to some uneasiness, but we would not be surprised to see spreads compress in the first half of 2026.
Investors will still need to be selective. Some companies are simply over-leveraged (i.e. took on too much debt) so operationally remain vulnerable to any weakness in revenues or anything that raises their finance costs. A deterioration in the economy, a re-opening of trade volatility, or fresh fears about inflation are just some of the factors that could unsettle markets and put upward pressure on yields and/or spreads. Absent a major shock, however, we think defaults should remain at low levels. The par weighted global default rate on high yield bonds was 1.7% at the end of November 2025, below the 20-year average of 3.6%.4
Sector differences in high yield
There was some disquiet in credit markets in late 2025 around the level of potential bond issuance required over coming years to help pay for the build-out of artificial intelligence (AI). We see this affecting investment grade corporate bond markets more, given much of the expected issuance looks set to come from investment grade companies. US dollar-denominated high yield issuance from the technology sector was $21 billion in the first 11 months of 2025; to put this in context, it is still below the full year levels of high yield issuance from tech companies in 2015, 2016, 2020 and 2021, so far from atypical. Furthermore, technology is only the fifth biggest issuing sector in high yield so far in 2025, well behind financials or energy.5 Nevertheless, opportunities are expanding for high yield investors to access the AI narrative from data centre operators to utilities to other supply chain providers.
There are also notable differences in spread levels between sectors in high yield. For example, globally, the more cyclical chemicals sector trades on average with spreads of around 500 basis points, more than double the average spread of around 200 basis points for utilities.6 There are valid arguments for this given the more defensive cash flows of utilities – and the potential for utilities to play a role in meeting the needs of AI infrastructure – but we also think that chemicals may offer an opportunity. The sector has been beaten up from competition from China, but with national security growing in importance, we think that European governments may look to be more protective towards the sector in 2026. It is the variation among companies in different sectors, different regions or even in the same sector that offers opportunities to be exploited.
Summary
Given our expectations of a benign global economy in 2026 we have a constructive view on high yield bonds in 2026. Over the past year, appetite for high yield bonds has been strong, comfortably absorbing what has been a relatively high supply year. We think that global demand will persist through 2026 as investors seek yield. In our view, spreads are likely to remain rangebound at low levels, which together with low default levels and careful selectivity, can allow investors to harvest the yield from high yield bonds.
1Source: Bloomberg, ICE BofA Global High Yield Index, USD hedged, total return in USD, 12 months to 31 December 2024 (9.3% return) and 11 months to 30 November 2025 (7.8% return). Past performance does not predict future returns.
2Source: BofA Global Research, average coupon, at 30 November 2025.
3Source: Bloomberg, ICE BofA US High Yield Index, ICE BofA Euro High Yield Index, yield to worst, at 30 November 2025.Yields may vary over time and are not guaranteed.
4Source: BofA Global Research, trailing 12-month par-weighted default rates, at 30 November 2025.
5Source: BofA Global Research, US dollar-denominated high yield issuance, at 30 November 2025.
6Source: Bloomberg, ICE BofA Global High Yield Index, weighted average spread of chemicals sector, weighted average spread of utilities sector, US dollar-denominated high yield issuance, at 30 November 2025. Spreads may vary over time.
Fixed income securities are subject to interest rate, inflation, credit and default risk. The bond market is volatile. As interest rates rise, bond prices usually fall, and vice versa. The return of principal is not guaranteed, and prices may decline if an issuer fails to make timely payments or its credit strength weakens.
High-yield or “junk” bonds involve a greater risk of default and price volatility and can experience sudden and sharp price swings.
ICE BofA US High Yield Index tracks US dollar denominated below investment grade corporate debt publicly issued in the US domestic market.
ICE BofA Euro High Yield Index tracks EUR denominated below investment grade corporate debt publicly issued in the euro domestic or Eurobond markets
ICE BofA Global High Yield Index tracks USD, CAD, GBP, and EUR denominated below investment grade corporate debt publicly issued in the major domestic or Eurobond markets.
ICE BofA Global Corporate Index tracks investment grade corporate debt publicly issued in the major domestic and Eurobond markets.
ICE BofA BBB Global Corporate Index is a subset of ICE BofA Global Corporate Index including all securities rated BBB1 through BBB3 inclusive.
ICE BofA BB Global High Yield Index is a subset of ICE BofA Global High Yield Index including all securities rated BB1 through BB3 inclusive.
ICE BofA Single-B Global High Yield Index is a subset of ICE BofA Global High Yield Index including all securities rated B1 through B3 inclusive.
ICE BofA CCC & Lower Global High Yield Index is a subset of ICE BofA Global High Yield Index including all securities rated CCC1 or lower.
Coupon: A regular interest payment that is paid on a bond described as a percentage of the face value of an investment. For example, if a bond has a face value of $100 and a 5% annual coupon, the bond will pay $5 a year in interest.
Basis point: One basis point (bp) equals 1/100 of a percentage point, 1bp = 0.01%.
Corporate bond: A bond issued by a company. Bonds offer a return to investors in the form of periodic payments and the eventual return of the original money invested at issue on the maturity date.
Credit rating: An independent assessment of the creditworthiness of a borrower by a recognised agency such as S&P Global Ratings, Moody’s or Fitch. Standardised scores such as ‘AAA’ (a high credit rating) or ‘B’ (a low credit rating) are used, although other agencies may present their ratings in different formats. BB is a high yield rating.
Credit spread: The difference in yield between securities with similar maturity but different credit quality. Widening spreads generally indicate deteriorating creditworthiness of corporate borrowers, and narrowing indicate improving.
Default: The failure of a debtor (such as a bond issuer) to pay interest or to return an original amount loaned when due.
High yield bond: Also known as a sub-investment grade bond, or ‘junk’ bond. These bonds usually carry a higher risk of the issuer defaulting on their payments, so they are typically issued with a higher interest rate (coupon) to compensate for the additional risk.
Inflation: The rate at which prices of goods and services are rising in the economy.
Investment grade bond: A bond typically issued by governments or companies perceived to have a relatively low risk of defaulting on their payments, reflected in the higher rating given to them by credit ratings agencies.
Issuance: The act of making bonds available to investors by the borrowing (issuing) company, typically through a sale of bonds to the public or financial institutions.
Maturity: The maturity date of a bond is the date when the principal investment (and any final coupon) is paid to investors. Shorter-dated bonds generally mature within 5 years, medium-term bonds within 5 to 10 years, and longer-dated bonds after 10+ years.
Refinancing: The process of revising and replacing the terms of an existing borrowing agreement, including replacing debt with new borrowing before or at the time of the debt maturity.
Tariff: A duty or tax imposed on goods entering a country.
Total return: The combined return of income and any capital gain/loss from an investment.
Yield: The level of income on a security over a set period, typically expressed as a percentage rate. For a bond, at its most simple, this is calculated as the coupon payment divided by the current bond price.
Yield to worst: The lowest yield a bond with a special feature (such as a call option) can achieve provided the issuer does not default. When used to describe a portfolio, this statistic represents the weighted average across all the underlying bonds held.
Volatility: A measures of risk using the dispersion of returns for a given investment. The rate and extent at which the price of a portfolio, security or index moves up and down.
These are the views of the author at the time of publication and may differ from the views of other individuals/teams at Janus Henderson Investors. References made to individual securities do not constitute a recommendation to buy, sell or hold any security, investment strategy or market sector, and should not be assumed to be profitable. Janus Henderson Investors, its affiliated advisor, or its employees, may have a position in the securities mentioned.
Past performance does not predict future returns. The value of an investment and the income from it can fall as well as rise and you may not get back the amount originally invested.
The information in this article does not qualify as an investment recommendation.
There is no guarantee that past trends will continue, or forecasts will be realised.
Marketing Communication.