Key takeaways:
- Amid tariff concerns and economic uncertainty, investors have gravitated to defensive sectors in 2025, driving outperformance over cyclical stocks.
- However, cyclical stocks still project stronger earnings growth through 2027, with estimates holding steady relative to defensive sectors so far this year.
- The recent market rotation has created opportunities in growth-oriented sectors where companies benefitting from strong secular trends now trade at more attractive valuations.
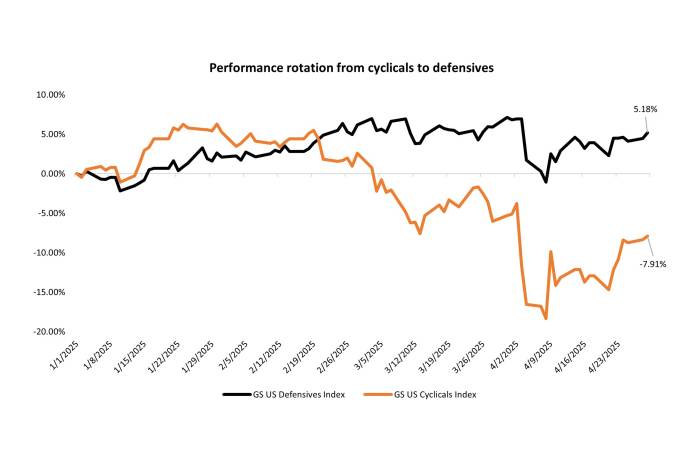
Source: Bloomberg, as of 29 April 2025. Cumulative total return from 1 January 2025 to 29 April 2025.
There is no guarantee that past trends will continue, or forecasts will be realized.
Defensive stocks (up 5.2%) have sharply outperformed cyclical stocks (down 7.9%) year to date in 2025 as investors seek shelter from economic uncertainty surrounding tariff policy and the resulting market volatility. Yet, earnings expectations tell a different story: Cyclicals are projected to outpace defensives through 2027.
| 2025 | 2026 | 2027 | ||||
| EPS | YoY EPS Growth | EPS | YoY EPS Growth | EPS | YoY EPS Growth | |
| GS US Cyclicals Index | $7.71 | 6.71% | $8.76 | 13.63% | $9.69 | 10.59% |
| GS US Defensives Index | $6.25 | 5.79% | $6.70 | 7.29% | $7.25 | 8.21% |
Source: Bloomberg, estimate headline earnings per share (EPS), as of 29 April 2025. YoY = year over year. There is no guarantee that past trends will continue, or forecasts will be realized.
With the earnings season underway, investors are watching for guidance updates and revisions, particularly as most S&P 500® Index estimates still exclude tariff impacts. First-quarter earnings trends showed resilience in cyclical sectors like technology (including semiconductors) and communication services, while estimates in defensive areas of the market like utilities and food producers saw flat to lower forecasts.
The severe rotation into defensives has created compelling opportunities in secular growth companies. Over the long term, we believe secular trends are far more powerful in driving stock returns than short-term macro fluctuations. We’re finding opportunities in secular growth companies that now trade at prices we haven’t seen in years, some of which we believe are positioned to extend their competitive advantages during a potentially challenging operating environment.
Beta measures the volatility of a security or portfolio relative to an index. Less than one means lower volatility than the index; more than one means greater volatility.
GS US Defensives Index consists of S&P 500 equities with a beta to US Gross Domestic Product (GDP) growth (via the GS US MAP score of economic data surprises) lower than the S&P 500’s beta excluding commodity input cost and other equities impacted by macro environment.
GS US Cyclicals Index consists of S&P 500 equities with a beta to US GDP growth (via the GS US MAP score of economic data surprises) higher than the S&P 500’s beta excluding energy and materials.
S&P 500® Index reflects U.S. large-cap equity performance and represents broad U.S. equity market performance.
Volatility measures risk using the dispersion of returns for a given investment.