
Key takeaways:
- The U.S. Aggregate Bond Index (U.S. Agg) has become highly concentrated in Treasuries, increasing exposure to duration risk while reducing access to spread-based return opportunities.
- Passive Agg-like portfolios leave investors exposed to shifting benchmark risks, including changes in duration and credit quality that may not align with their investment objectives.
- A more flexible, multi-sector approach can help investors build fixed income portfolios around desired duration, credit risk, diversification, and return potential.
For decades the U.S. Agg has served as the proxy for investing in U.S. fixed income, with convention dictating that the benchmark should be the basis for one’s “core” bond allocation.
But the U.S. Agg is broken. And yes, the U.S. government broke it (to a certain extent).
Below, we list the three key reasons why we believe the U.S. Agg is a poor proxy for investing in U.S. fixed income and a suboptimal choice for a core bond allocation.
1. How the U.S. government broke the Agg
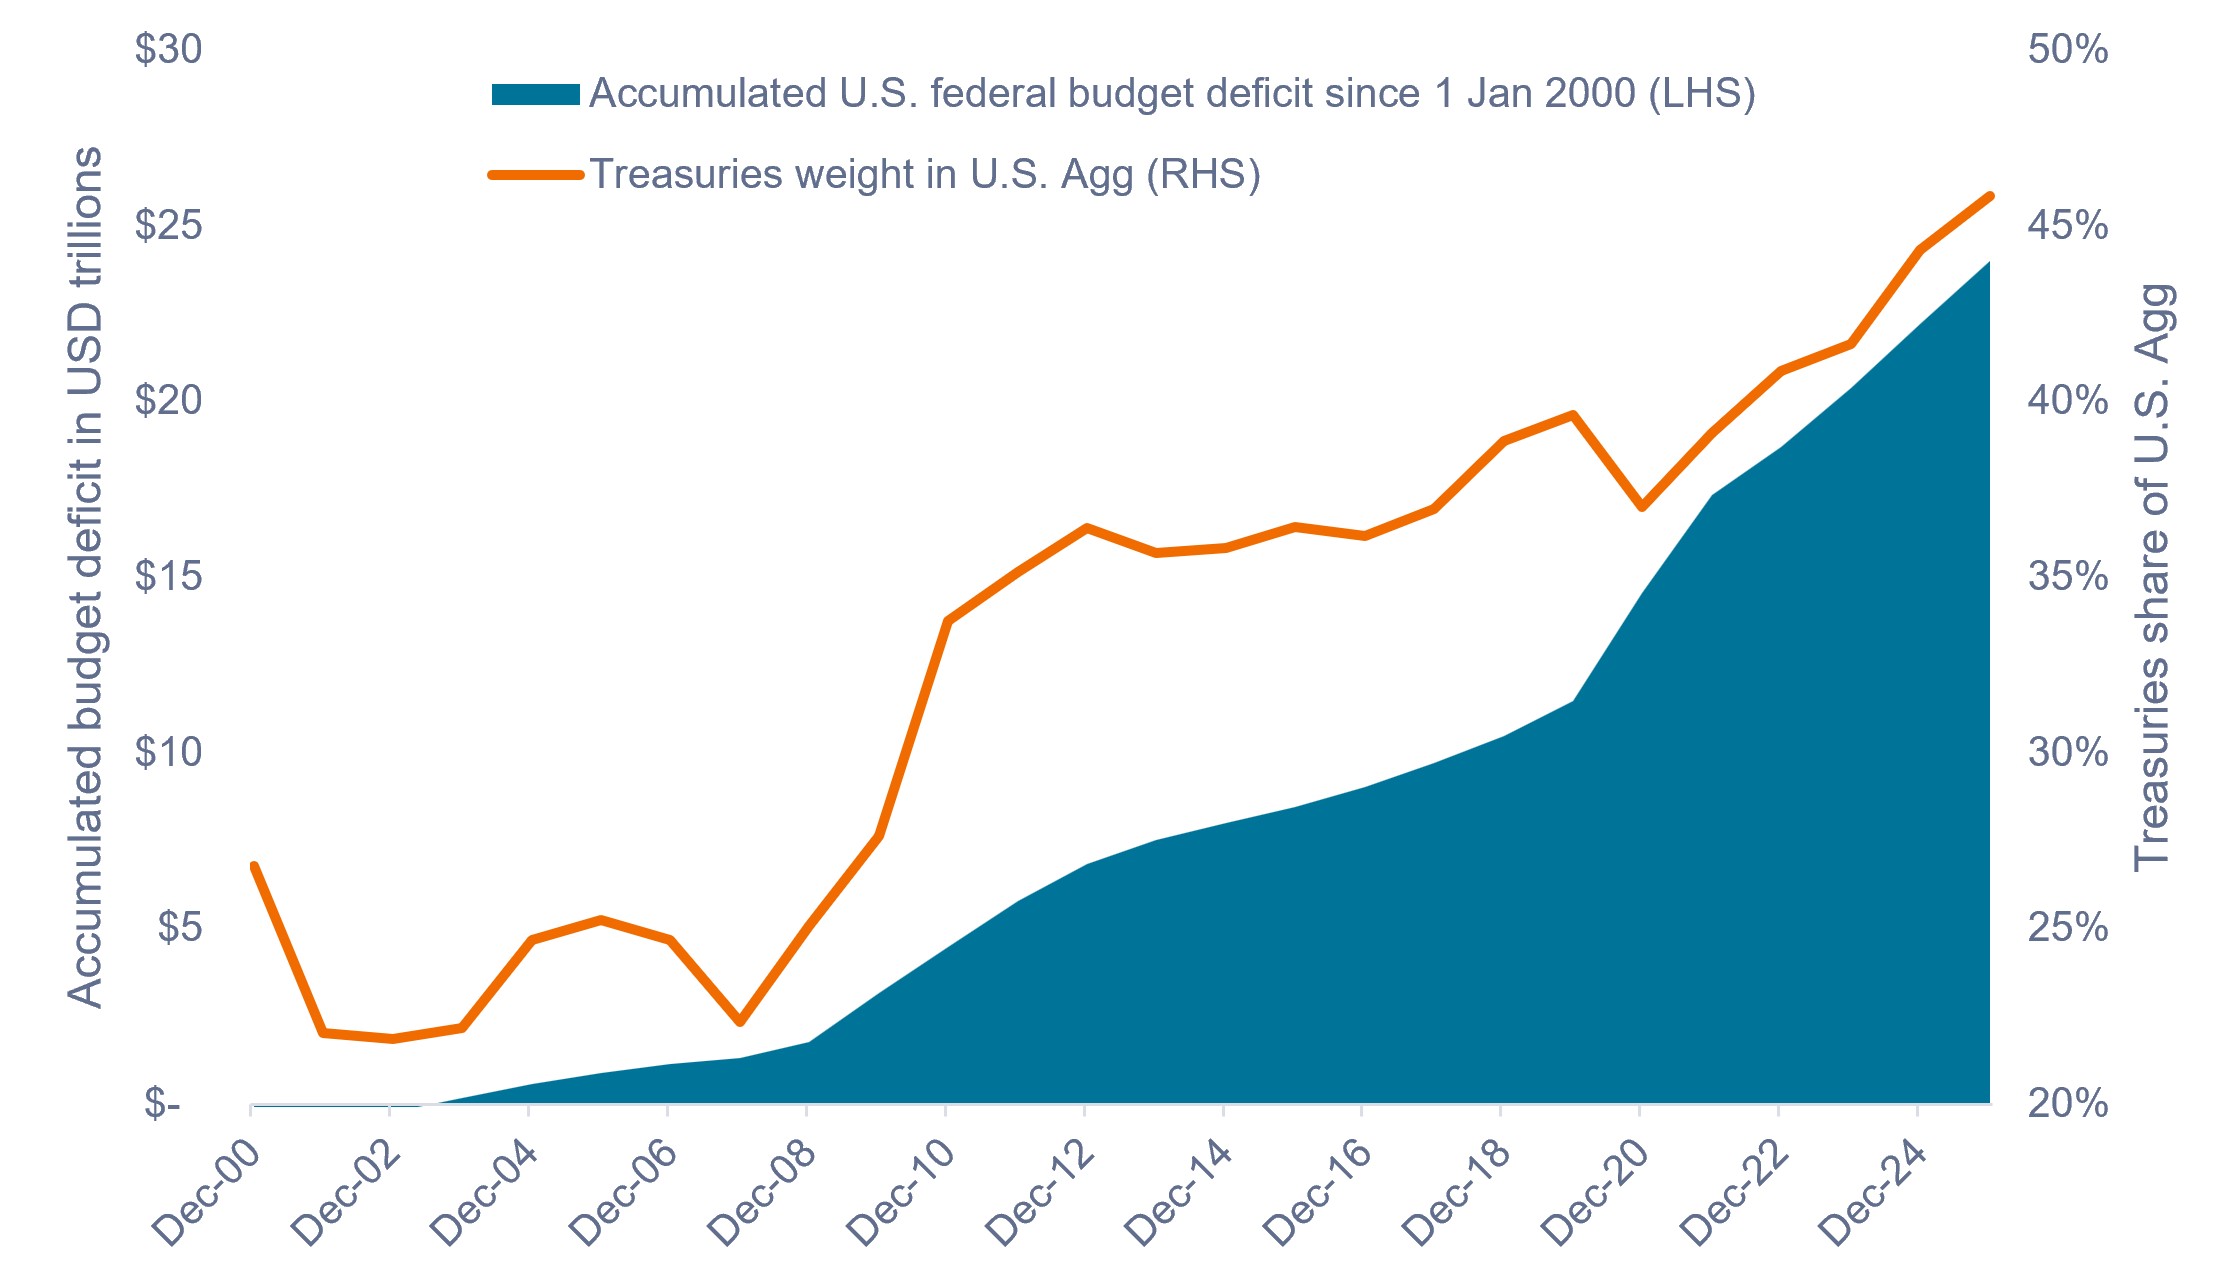
Did you know that for every dollar invested in the U.S. Agg, 46 cents go into U.S. Treasuries? That’s a staggering number, considering from 2001 to 2008, Treasury securities occupied just 22%-25% of the benchmark index.
Why has the Treasury weighting roughly doubled over the past two decades?
Issuance of government debt has far outpaced all other fixed income sectors combined to finance $25 trillion in federal budget deficits since January 2000. This generational level of Treasury bond issuance has crowded out other areas of the market, which, notwithstanding their absolute size, cannot compete with this level of growth.
Exhibit 1: Accumulated U.S. federal budget deficit vs. Treasuries weight in the U.S. Agg (2000 – 2025)
Persistent fiscal deficits have led to a surge in U.S. Treasury issuance and a ballooning weight in the index.
Source: Bloomberg, as of 31 December 2025 (most recent calendar year end).
What’s the problem with 46% in U.S. Treasuries?
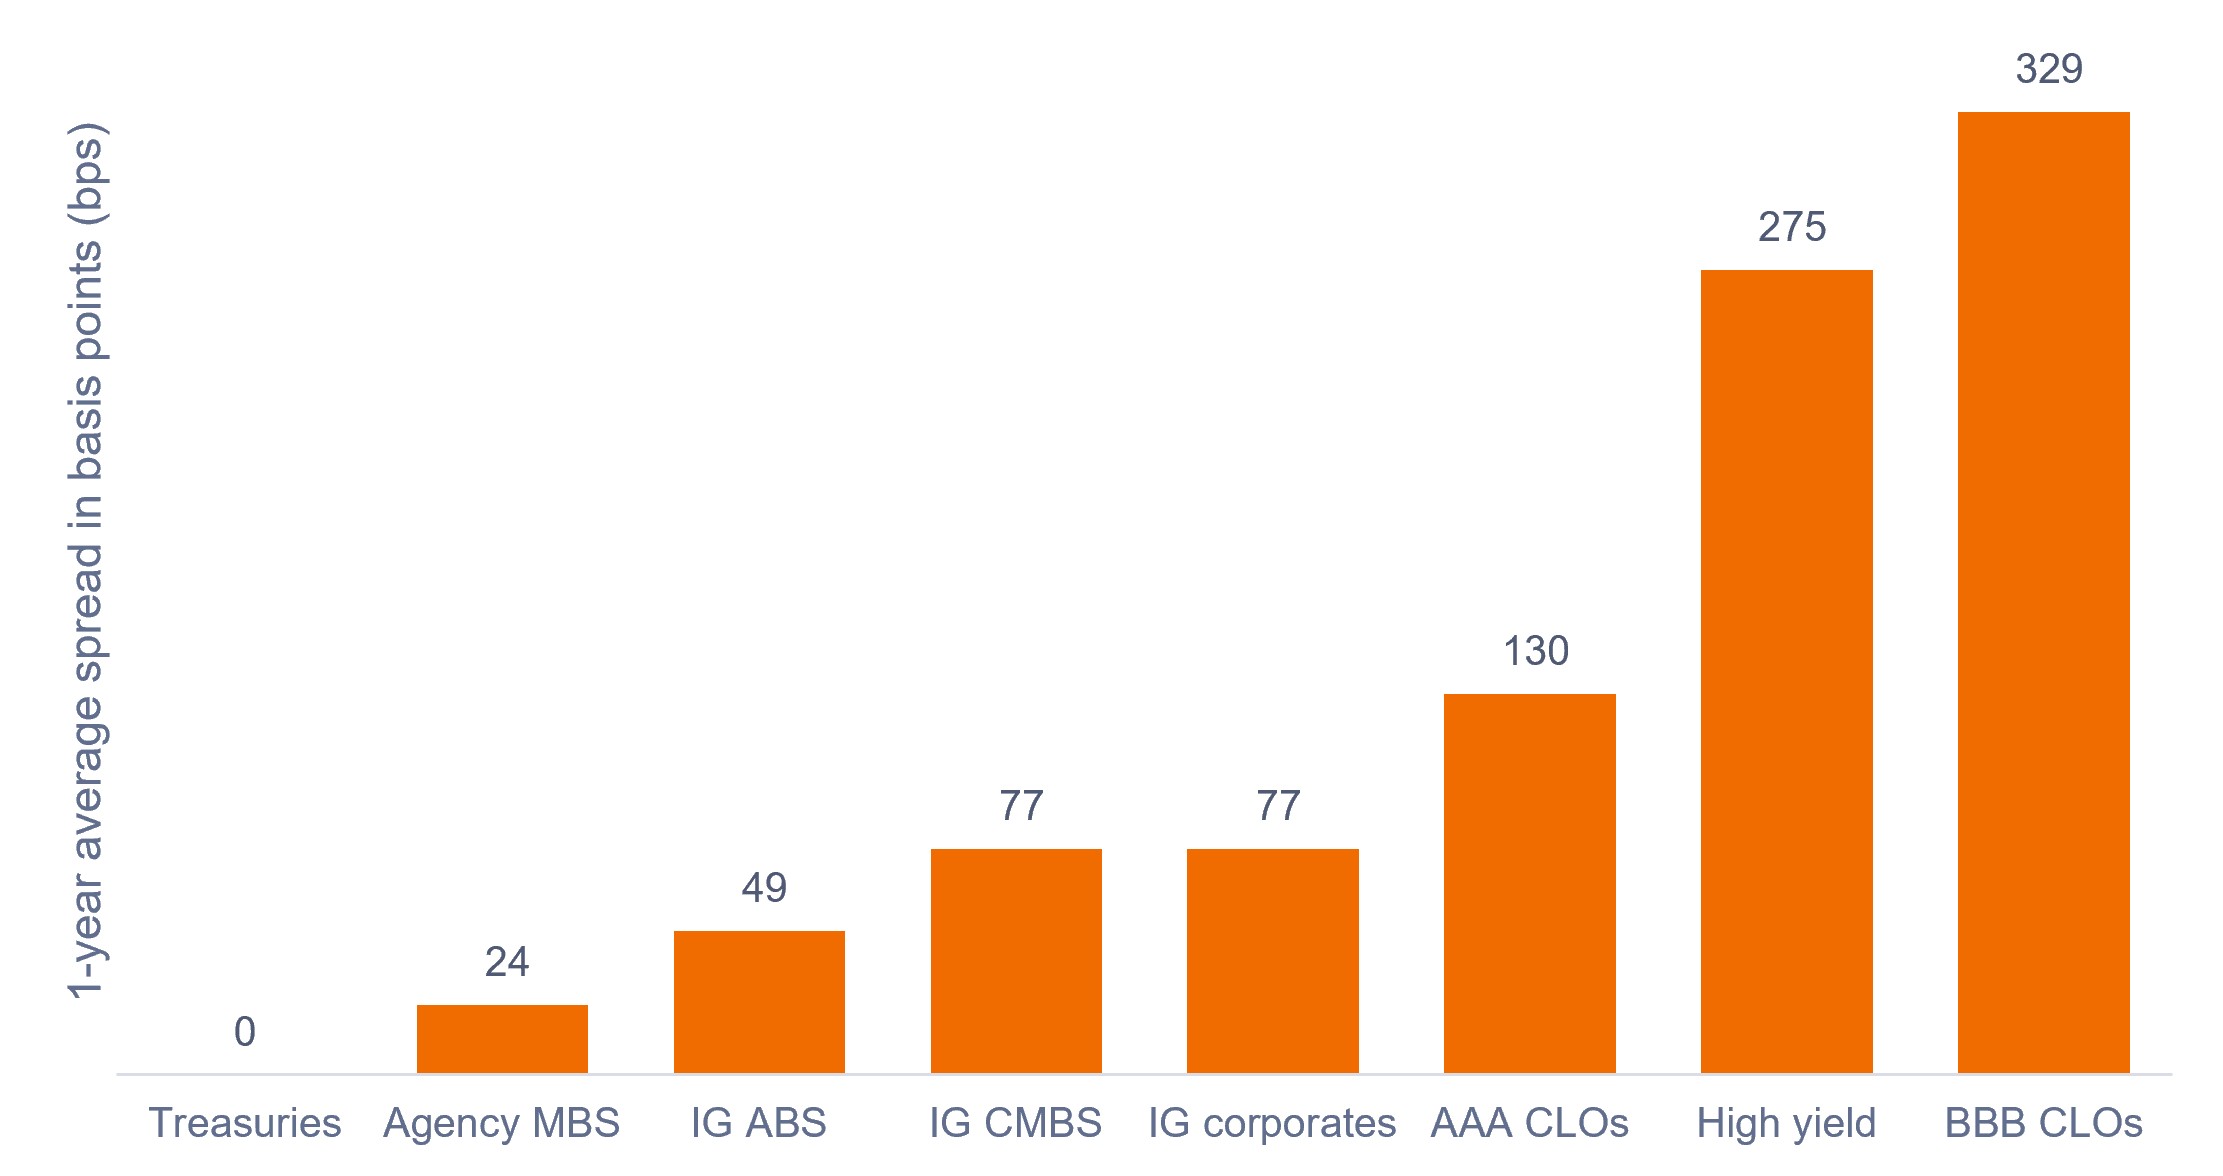
First and foremost, Treasury bonds are entirely a duration / interest-rate risk investment. Unlike corporate and consumer bonds, Treasury securities do not pay a spread – or additional coupon income – to compensate for their higher credit risk. Credit spread has been a significant contributor to excess returns over time.
Therefore, there is an opportunity cost associated with investing in Treasuries equal to the credit spread offered by other fixed income sectors.
Exhibit 2: Average spread paid by select U.S. fixed income sectors (Aug 2025 – Aug 2026)
Corporate and consumer bonds pay additional income above the yield on similar-duration Treasury securities.
Source: Bloomberg, as of 31 August 2026. Indices used to represent asset classes as per footnote.1 Past performance does not predict future results.
Forget the debt burden, worry about the interest
Another reason why we don’t like 46% in Treasuries centers around our concerns with the interest burden on the U.S. government’s accumulated debt. Despite the U.S. Treasury carrying a AA+ credit rating (just one rung below the highest-rated AAA securities), the rating belies its fiscal dilemma.
While many investors are justifiably tired of the ongoing fuss around the ever-increasing national debt, it is important to note that between 2008 and 2021, the adverse effects of rising fiscal debt were kept at bay by unusually low interest rates.
Since 2022, however, the chickens of the heavy debt burden have been coming home to roost as rates and yields have risen. The Department of the Treasury is having to issue new bonds and refinance maturing bonds at much higher rates today than at any point since the Global Financial Crisis.
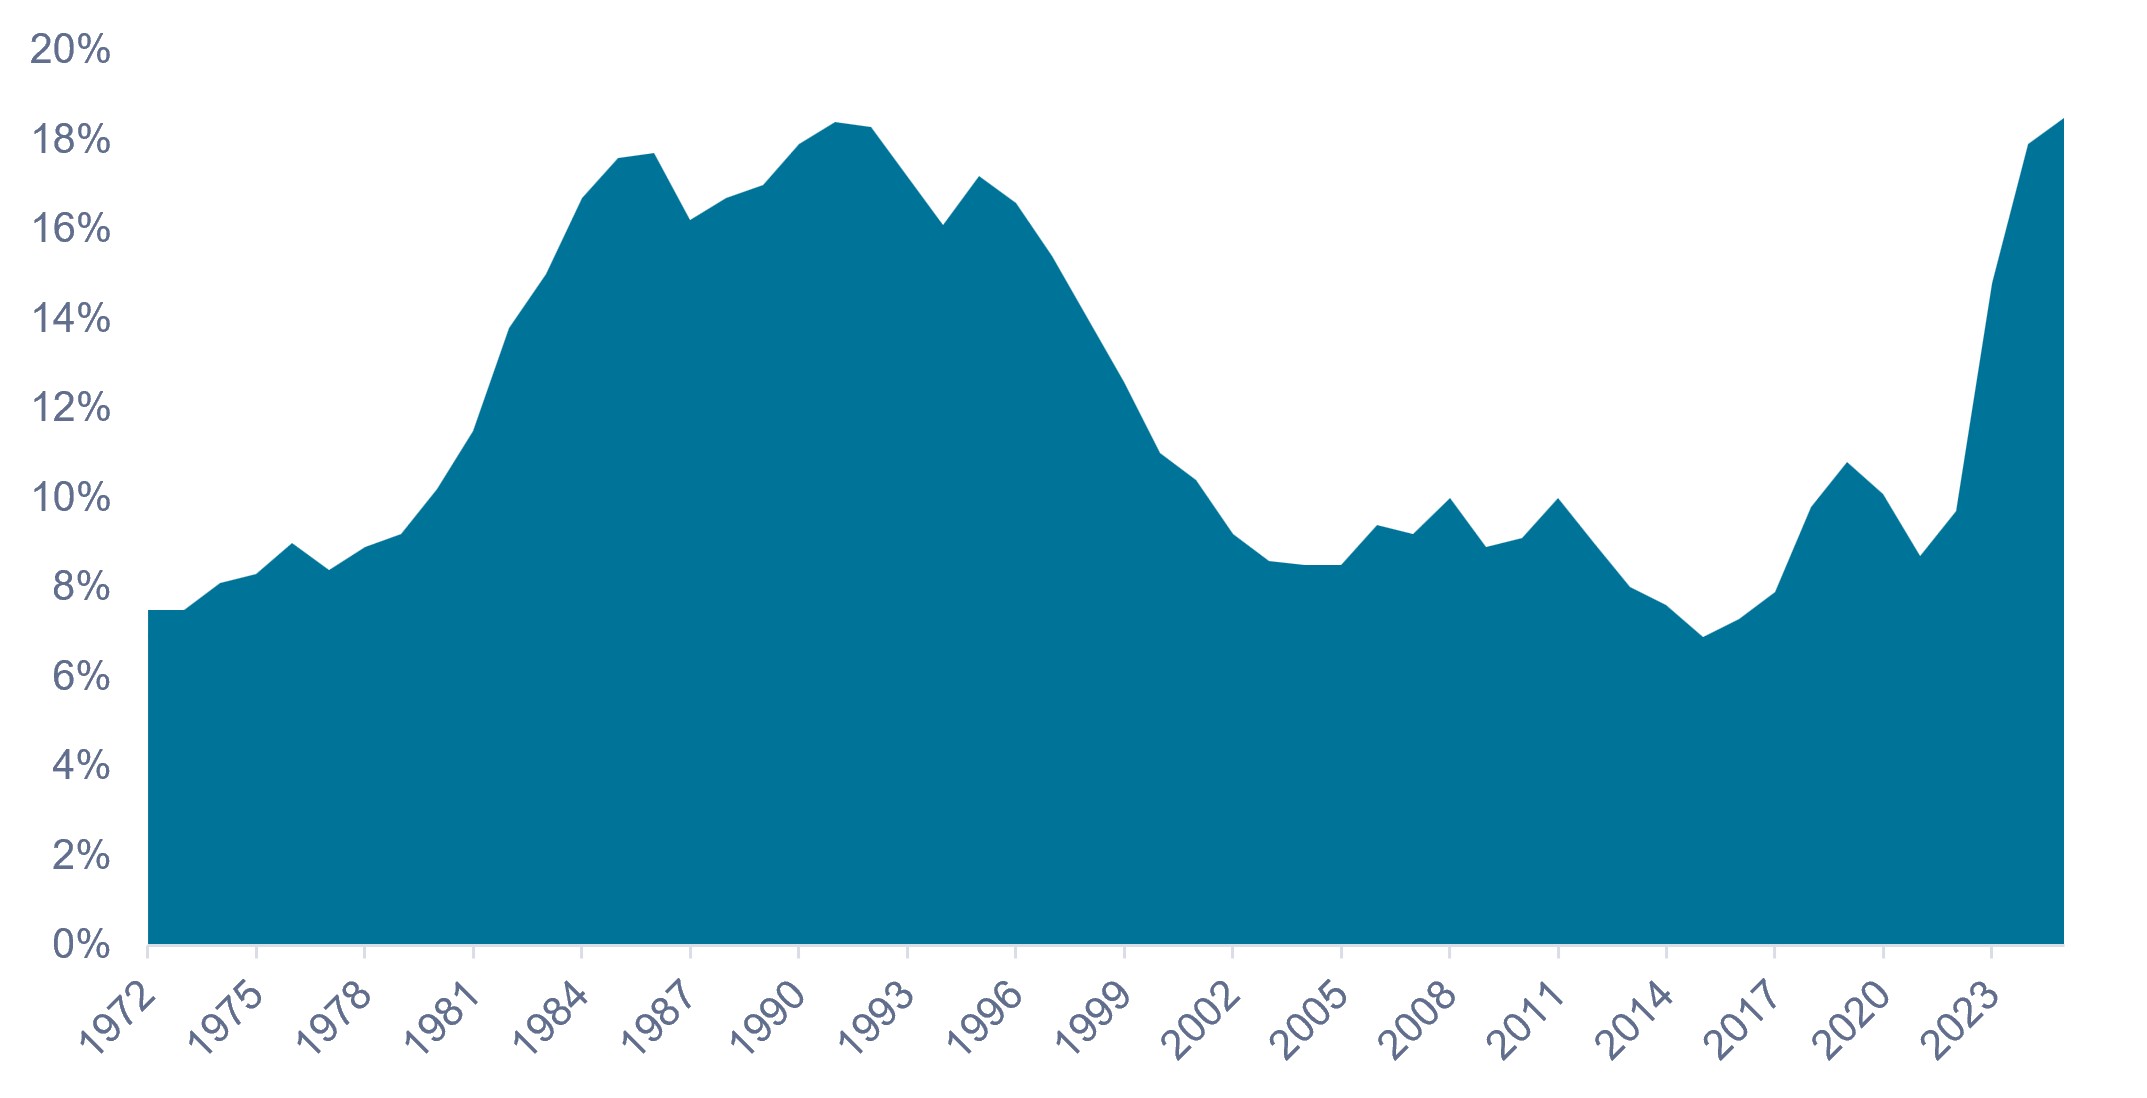
The net effect is that interest expense as a percentage of total federal revenues has now surpassed the 18.4% record set in 1990 and is expected to continue to climb to around 26% by 2036, according to the Peter G. Peterson Foundation.
High debt service costs will eventually crowd out other fiscal spending. This has implications for the broader economy and, if left unchecked, could threaten the creditworthiness of the U.S. Treasury.
Exhibit 3: Net interest expense as a percentage of federal revenues (1972 – 2025)
The double whammy of record-high debt and rising rates has translated into an extreme interest burden for the U.S. government.
Source: Peter G. Peterson Foundation, Congressional Budget Office and Office of Management and Budget, as of 30 September 2025 (most recent fiscal year end).
Can’t debt be a good thing?
While high debt loads might look alarming on paper, most investors understand that, in the real world, debt can be a good thing if it finances growth. The U.S. economy has certainly been a beneficiary of this principle, as gross domestic product (GDP) grew ~23% between 2015 and 2025.
But it’s not all good news: The challenge for the U.S. is that it has not fully converted GDP growth into federal revenues, which rose just 18.3% over the same period, in part due to tax cuts. At the same time, however, government outlays (expenses) rose by nearly 40%.
Exhibit 4: U.S. GDP growth vs. growth in federal revenues and outlays (2015 – 2025)
Federal revenue growth has lagged GDP growth, while both measures have been dwarfed by growth in expenses.
| Cumulative nominal U.S. GDP growth | Cumulative U.S. federal revenue growth | Cumulative U.S. federal outlays (expenses) growth | |
| 2015 – 2025 | +22.7% | +18.3% | +39.6% |
Source: The Department of the Treasury and the Bureau of the Fiscal Service, as of 30 September 2025 (most recent fiscal year end).
With expense growth outstripping GDP and revenue growth, the U.S. government is in the predicament of having to address the interest problem with some combination of revenue growth (through higher taxes and/or significant economic growth) and spending cuts.
But there seems to be very little (read: zero) bipartisan agreement on finding a workable solution in Congress, and until we get some clear path to success, it’s tough to get excited about Treasury securities.
Let us be clear
Considering the upward trajectory of the interest burden, the U.S. could theoretically be rated a sub-investment grade bond were it a corporate issuer. That said, presently we are not so much concerned about rating downgrades or the ability of the government to service its debts, because the U.S. Dollar remains the world’s reserve currency and the Treasury market the largest and most liquid bond market on the globe.
But we are concerned that, outside of a full-blown recession, there seems to be little impetus for a rally in Treasury yields. Rather, yields appear more likely to stay high (and potentially rise from here) in the medium term due to ongoing multi-trillion-dollar fiscal deficits, robust economic growth on the back of the artificial intelligence (AI) infrastructure buildout, and high inflation.
What about Treasuries for portfolio defense?
Investors have historically held Treasuries for portfolio defense. Government bonds have served as a good diversifier during bouts of volatility, as investors often sell equities and pile into “safe” assets during such periods.
On this point, investors should keep a couple of things in mind.
First, remember that there is an opportunity cost associated with holding Treasuries for portfolio defense, so investors should ask (i.e., quantify) what it costs to hold Treasuries over other fixed income sectors and whether the cost is justified.
Second, investors should ask how effective Treasuries are as a defensive asset relative to other fixed income sectors, because in that respect, the U.S. Treasury is not the only game in town.
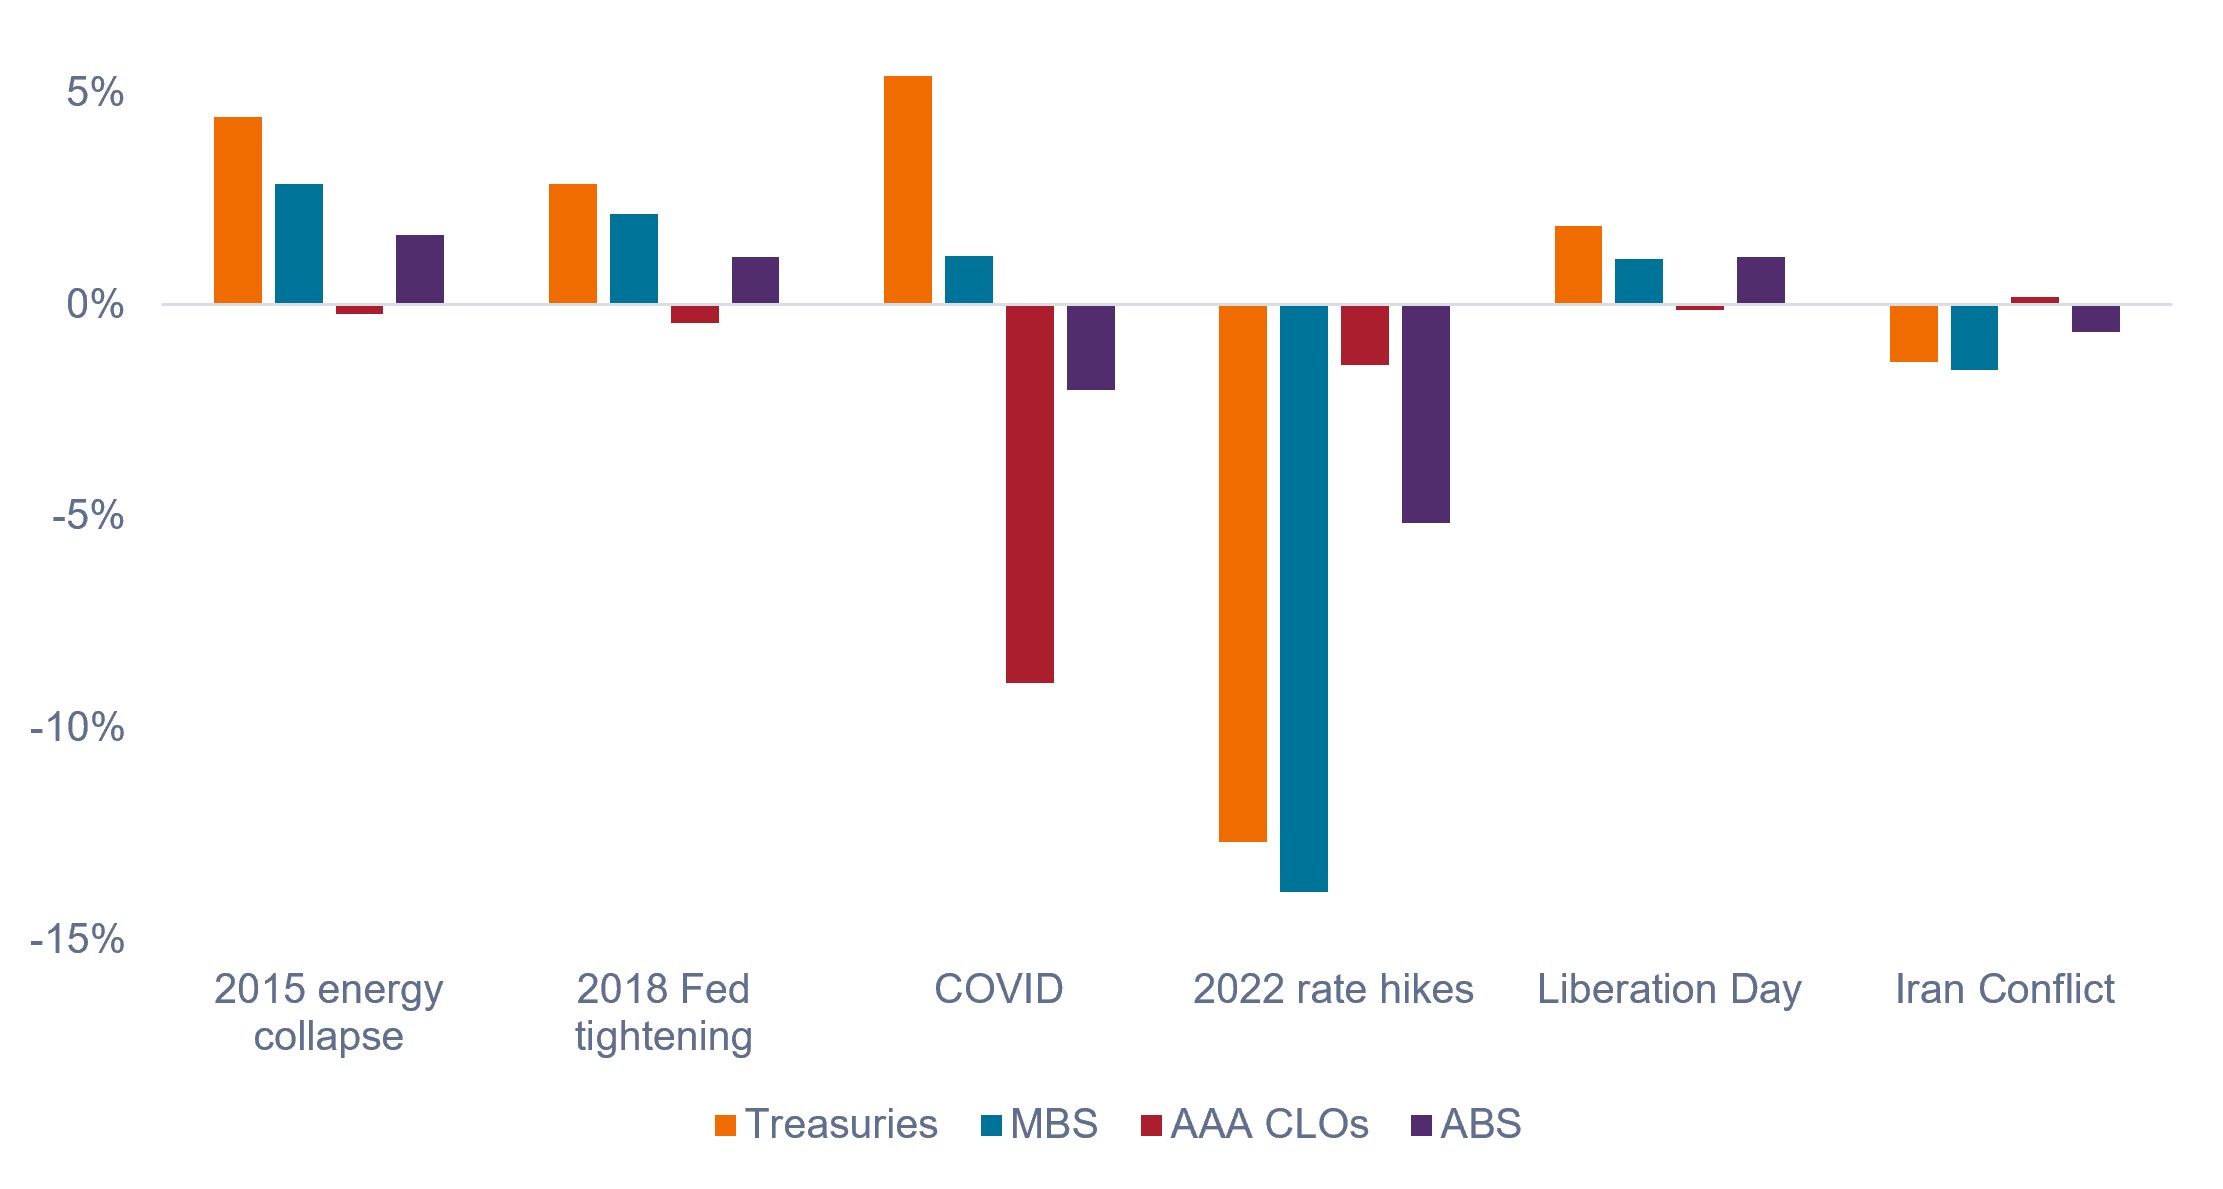
Looking at the six most recent market pullbacks, Treasuries were a standout diversifier (their values increased when equity markets pulled back) until COVID. Low inflation, more accommodative policy rates, and lower deficit spending underpinned rallies in Treasury bonds during earlier periods.
Since COVID, however, inflation and higher rates have made a comeback, and the defensive capabilities of Treasuries have been hamstrung by structural and fiscal challenges. There is now less of a defensive incentive to own Treasuries and investors can look for (and find) safety elsewhere in the market.
Additionally, the Federal Reserve (Fed) set a new precedent for the “Fed Put” during COVID, whereby it showed it was prepared to purchase Treasuries, agency MBS, and corporate bonds during a severe market dislocation.
In our view, this action likely underpinned a future floor on credit spreads (because if credit markets freeze up, the Fed is likely to intervene) and further highlighted that Treasury bonds do not possess a monopoly on “flight to safety”. AAA CLOs, IG ABS, and agency MBS, for example, have all shown similarly impressive defensive strength in recent history.
Exhibit 5: Fixed income sector returns during equity market peak-to-trough drawdowns
Since COVID, Treasuries have been less of a defensive standout, arguing for a more diversified approach to portfolio defense.
Source: Bloomberg, Janus Henderson Investors, as of 31 August 2026. Indices used to represent asset classes as per footnote.1 Past performance does not predict future results.
2. Passive investors must take what they get and not pitch a fit
Our hang-up with “just buying the Agg” is that the benchmark’s risk profile is always changing, often to the detriment of the investor. We’ve already discussed the 46% weighting to Treasuries as an example of this, but these challenges also extend to duration and credit quality.
Duration
As a rule, issuers of debt try to capitalize on low rates. When rates fall, they tend to refinance higher-coupon bonds and issue longer-dated debt to lock in cheaper rates, just the way a homeowner might refinance their mortgage when rates fall.
Investors in passive benchmarks are taking the opposite side of that duration trade, and are locking in lower rates for longer, which theoretically may not be the best course of action at that time.
We prefer an approach where investors get to exercise their right to select their desired level of duration risk and have their portfolio managed to a duration target. This is a strategy one cannot execute with the U.S. Agg because the benchmark is not managed to a duration target.
Exhibit 6: Option-adjusted duration of the U.S. Agg (2000 – 2026)
Bond issuers have consistently taken advantage of a drop in rates by issuing longer-duration bonds, counter to the interests of investors.
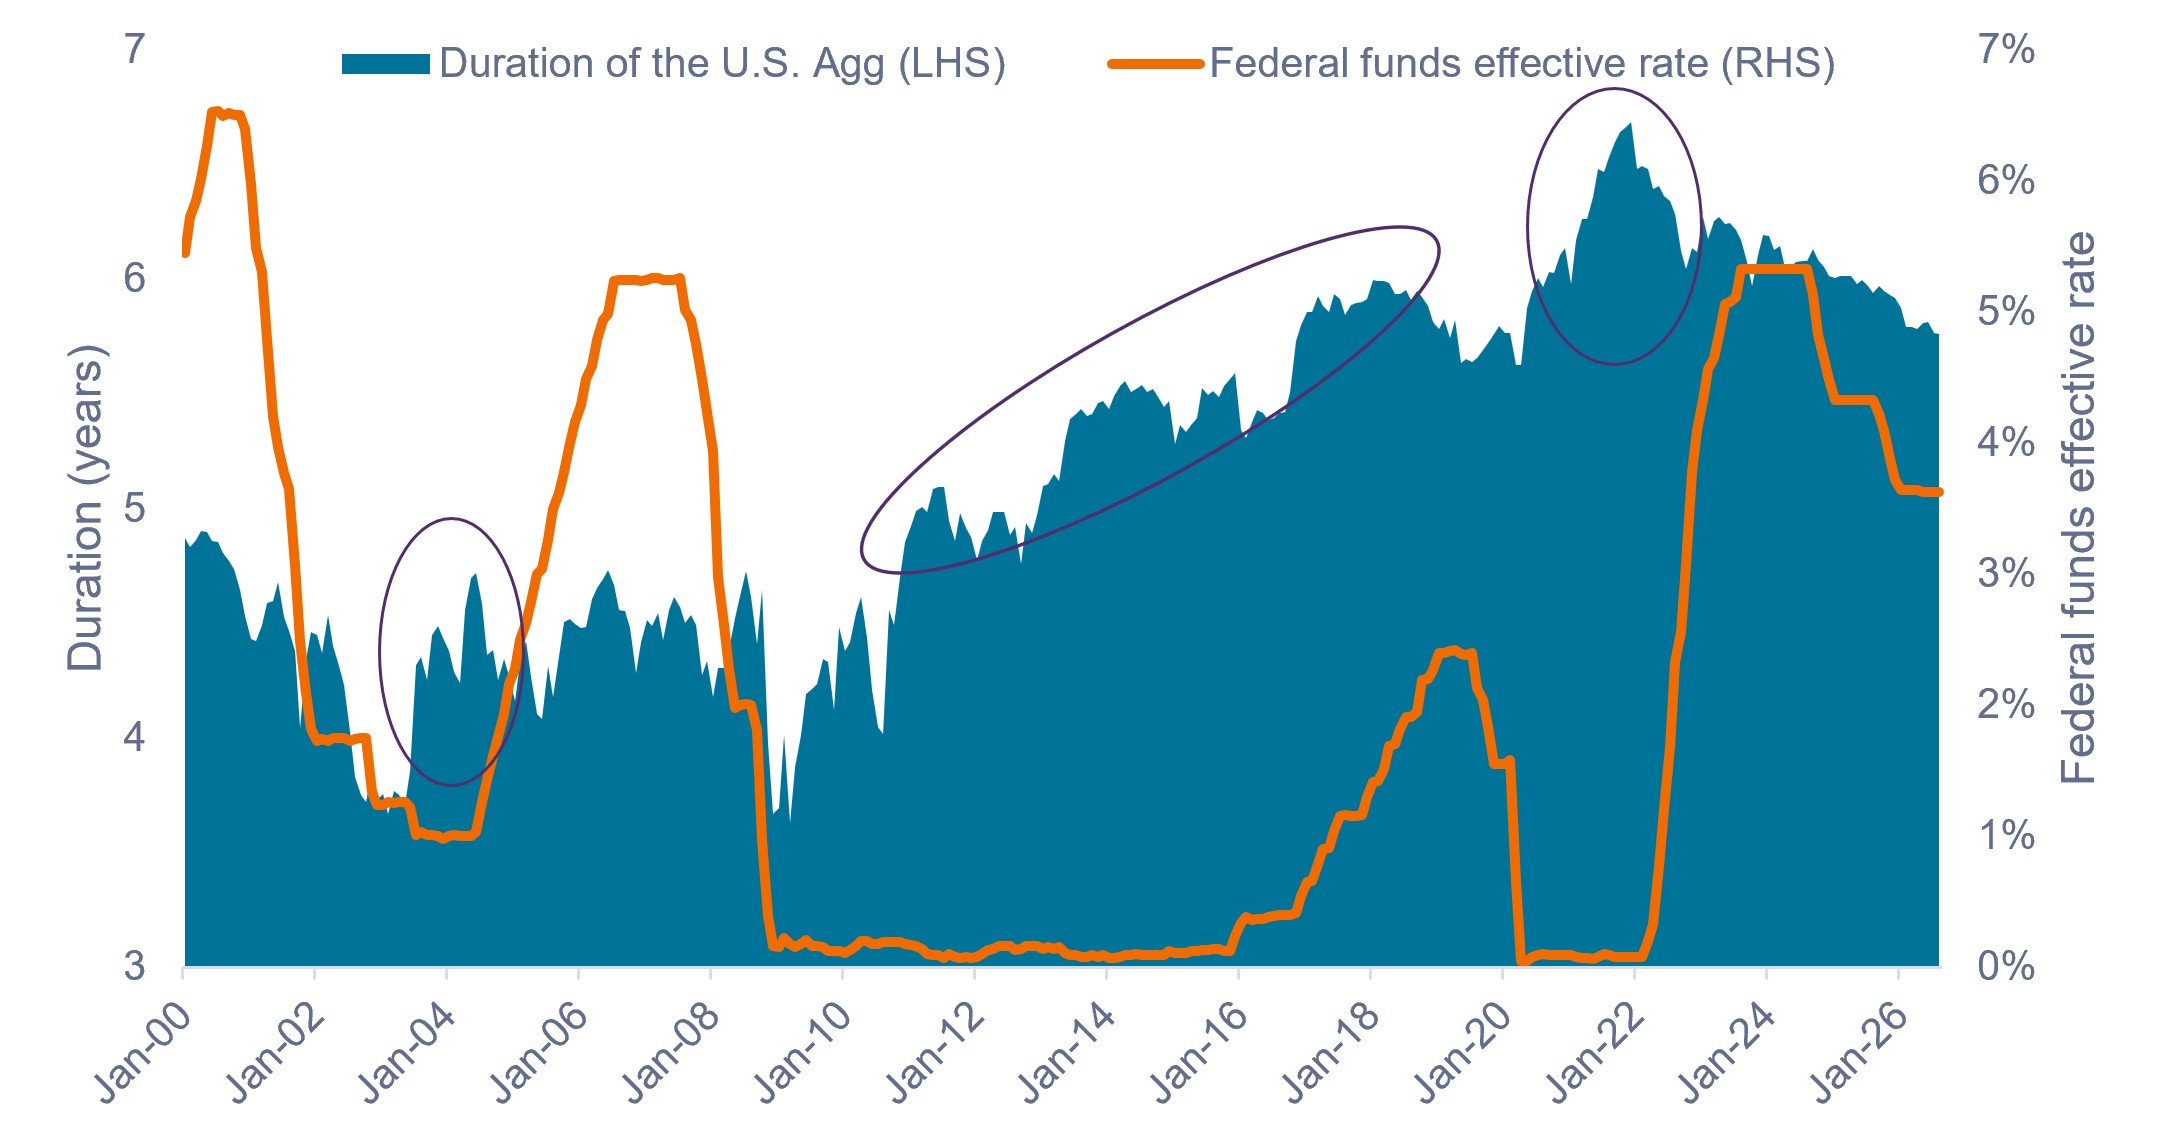
Source: Bloomberg, as of 31 August 2026. Circled areas highlight periods during which issuers extended duration amid low rates.
Credit quality
Like the duration argument, passive investors in the benchmark cannot manage the overall quality of their corporate exposure.
As shown below, the credit quality of the U.S. Agg’s corporate sleeve has fluctuated meaningfully over time. Once again, we would advocate that investors exercise their freedom to choose their desired level of credit risk and have their portfolio optimized within the constraints of a defined risk budget.
Exhibit 7: BBB weighting in U.S. IG corporates (2000 – 2025)
Not McDonald’s: Just because you bought the U.S. Agg, that doesn’t mean the quality has been consistent.
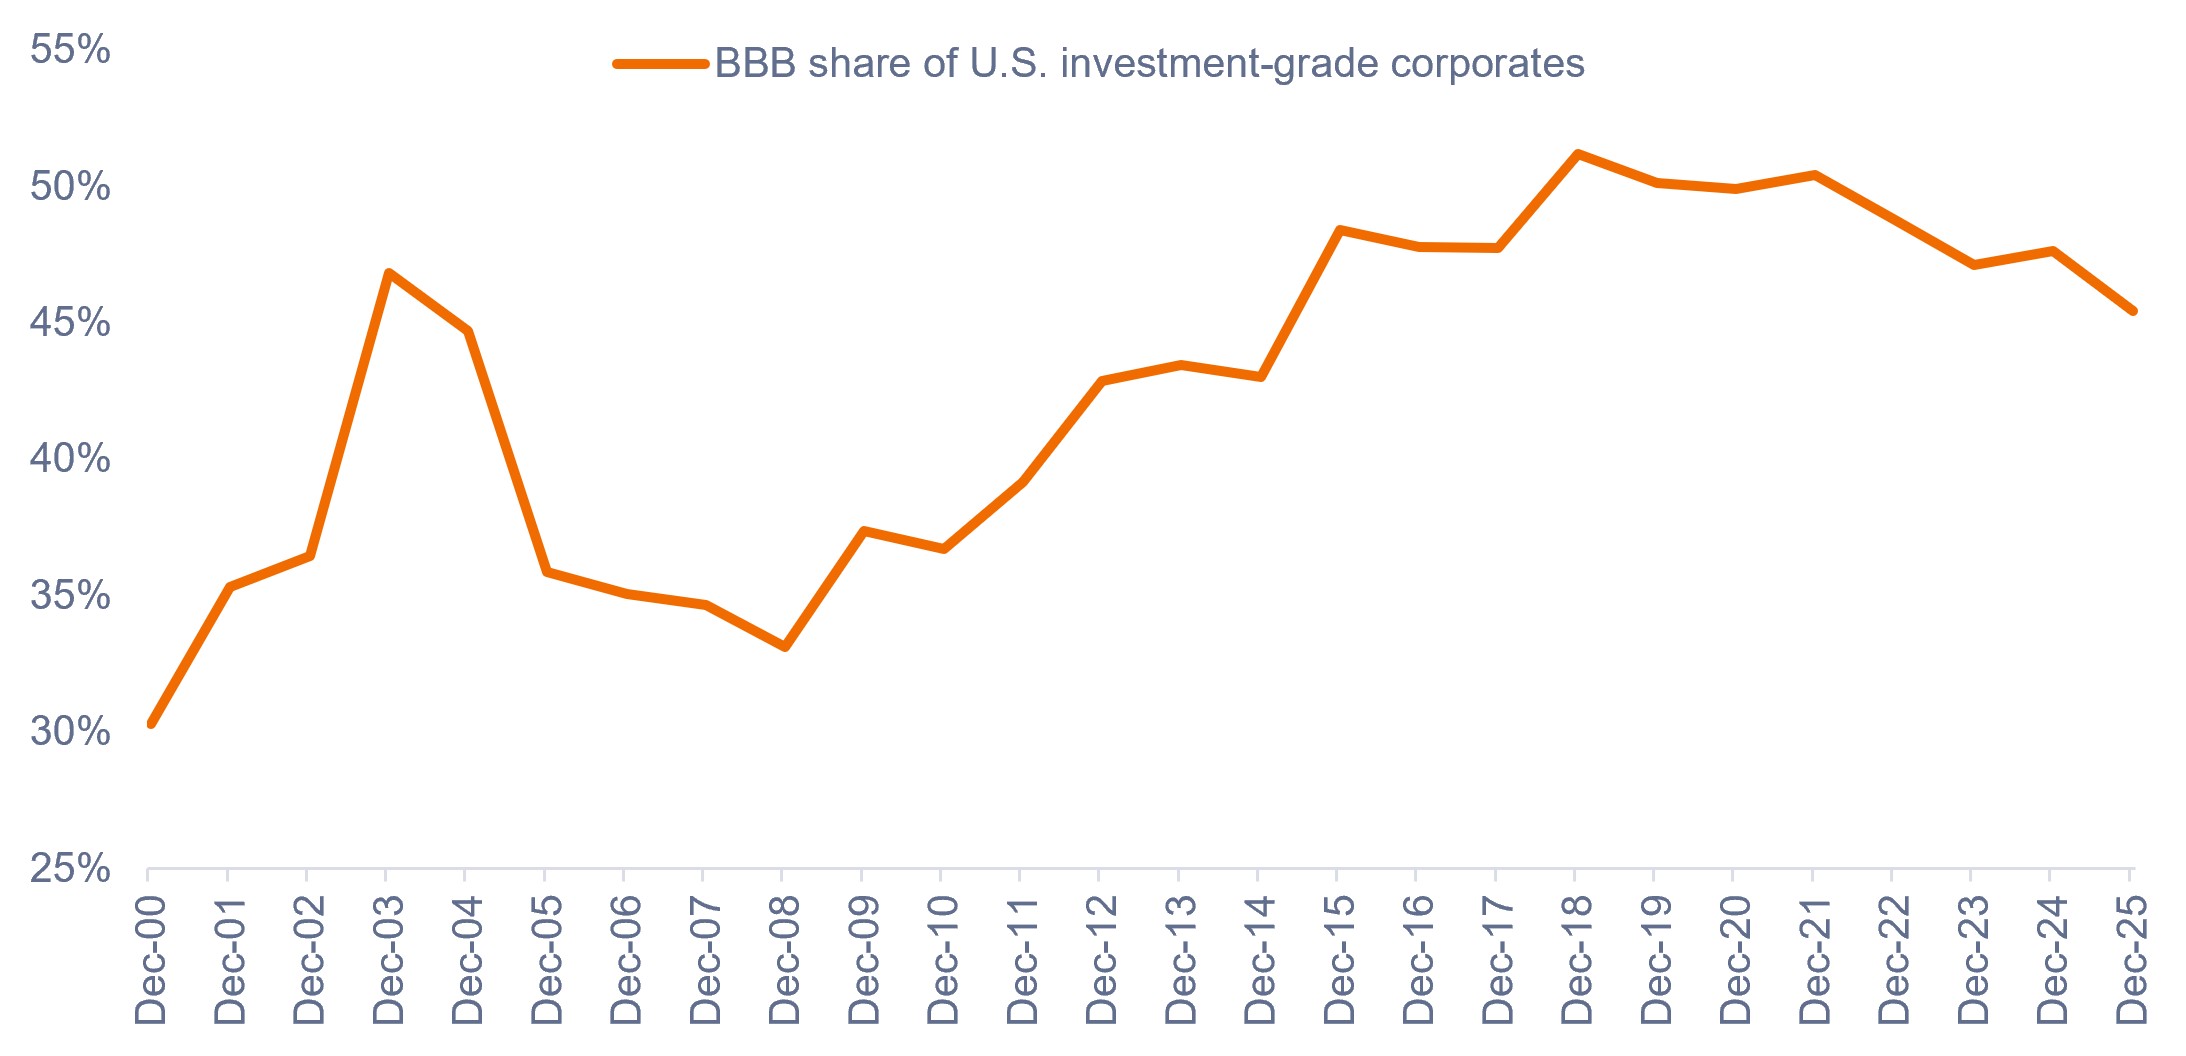
Source: Bloomberg, as of 31 December 2025.
3. Challenges with the construction of the Agg
In our view, there are some longstanding issues with how the U.S. Agg is constructed. Quite simply, we believe it is not representative of the U.S. fixed income investment opportunity set.
Some of the parameters that limit its ability to be reflective of the U.S. fixed income market include:
- The index only includes fixed-rate bonds (no floating-rate exposure).
- Issue size minimums must be met for inclusion.
- A rating by S&P, Moody’s, or Fitch is required for inclusion.
- The addition of agency MBS in 1986 was the last major improvement to the index (the Agg has no selection committee and has seen no evolution in its construction methodology).
The result is an index that is very limited in its scope and excludes large parts of the fixed income universe.
Exhibit 8: U.S. fixed income market vs. composition of the U.S. Agg.
Several trillion-dollar bond markets have a zero or de minimis weighting in the U.S. Agg – a major missed opportunity for investors.
| Fixed income sector |
Market size |
Weight in U.S. Agg |
| U.S. Treasuries |
$31 T |
~46% |
| Agency MBS |
$9.3 T |
~23% |
| Investment-grade corporates |
$7.5 T |
~26% |
| Government-related |
$1.3 T |
~2% |
| IG CMBS |
$1.9 T |
~2% |
| IG ABS |
$0.9 T |
<1% |
| Leveraged loans |
$1.5 T |
0% |
| CLOs |
$1.2 T |
0% |
| High-yield corporates |
$1.5 T |
0% |
| Non-agency RMBS |
$2.0 T |
0% |
| EM Debt (hard currency) |
$2.3 T |
0% |
Source: Bloomberg, Bank of America, as of 31 December 2025 (most recent calendar year end). Market size quoted in USD.
Has the U.S. Agg worked?
Many investors have expressed dissatisfaction with “the performance of their bonds”. But in most cases, we find that their dissatisfaction is more specific to the underperformance of their U.S. Agg-like portfolios.
In contrast, several sectors have delivered strong performance over the past decade, but most fixed income investors would not get exposure to those sectors without deviating from benchmark-hugging portfolios.
Exhibit 9: Risk-return scatterplot of select U.S. fixed income sectors (2015-2025)
The Agg lag: Owing to its 70% weighting in just two sectors, the U.S. Agg has underperformed, behaving more like a government bond proxy.
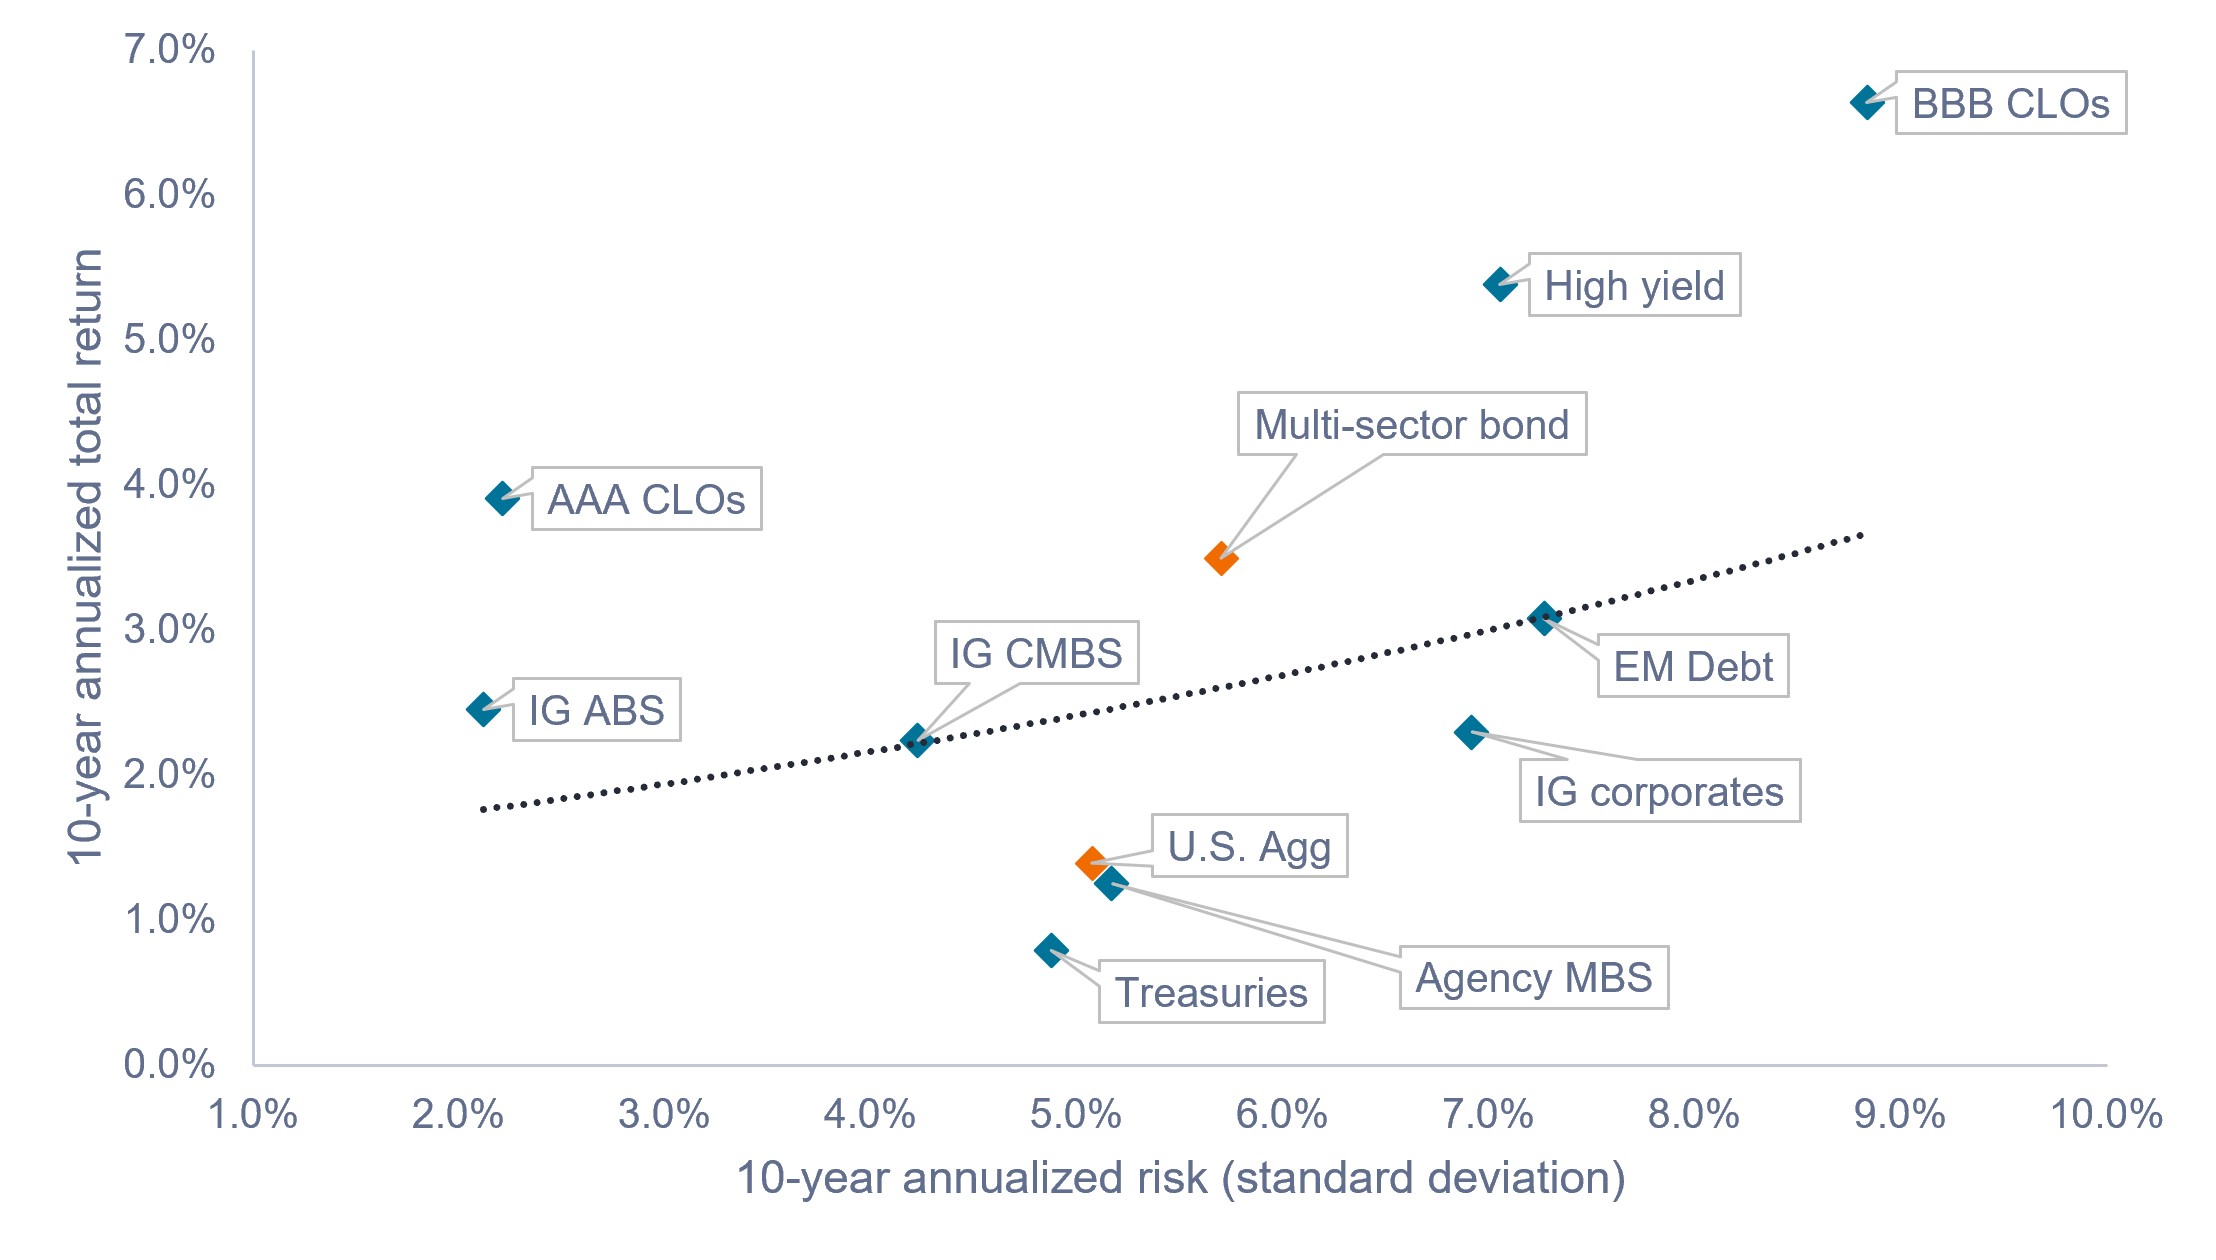
Source: Bloomberg, J.P Morgan, Morningstar, as of 31 August 2026. Indices used to represent asset classes as per footnote.1 Past performance does not predict future results.
Architects of fixed income solutions
We believe that all investors should a) exercise their freedom to intentionally choose their investment exposure, and b) adopt an institutional mindset to investing in fixed income by considering their credit risk budget and desired level of duration risk and optimizing their portfolio for those constraints.
In our view there are two ways to improve diversification and return potential: Either by building a portfolio through a diversified mix of single-sector ETFs, or by investing in a multi-sector fund or ETF with a flexible mandate that can bypass the myriad issues with the benchmark U.S. Agg.
As architects of fixed income solutions, Janus Henderson has the deep research and investment expertise required to help build and manage fixed income solutions to meet the needs of investors.
1 Indices used to represent asset classes: Treasuries = Bloomberg U.S. Treasuries Index, Agency MBS = Bloomberg U.S. Mortgage-Backed Securities Index, IG ABS = Bloomberg U.S. Aggregate Asset-Backed Securities Index, IG CMBS = Bloomberg U.S. Commercial Mortgage-Backed Securities Investment Grade Index, IG corporates = Bloomberg U.S. Corporate Bond Index, AAA/BBB CLOs = JP Morgan AAA/BBB Collateralized Loan Obligations (CLO) Index, High yield = Bloomberg U.S. High Yield Corporate Index, EM Debt = Bloomberg Emerging Markets Debt Hard Currency Index, Multi-sector Bond = Morningstar Multi-Sector Bond Category Average.
Basis point (bp) equals 1/100 of a percentage point. 1 bp = 0.01%, 100 bps = 1%.
The Bloomberg U.S. Aggregate Bond Index is a broad-based measure of the investment grade, US dollar-denominated, fixed-rate taxable bond market.
Bond coupon is the predetermined interest payment a bondholder receives from the bond issuer, typically expressed as a percentage of the bond’s face value.
Credit quality ratings are measured on a scale that generally ranges from AAA (highest) to D (lowest).
Credit Spread is the difference in yield between securities with similar maturity but different credit quality. Widening spreads generally indicate deteriorating creditworthiness of corporate borrowers, and narrowing indicate improving.
Credit spread risk is the potential for a financial loss on a debt security due to a widening of the spread (difference in yield) between that security and a risk-free benchmark, such as a U.S. Treasury bond. It represents changes in market value caused by increased market perception of credit risk, distinct from the actual risk of borrower default.
Duration measures a bond price’s sensitivity to changes in interest rates. The longer a bond’s duration, the higher its sensitivity to changes in interest rates and vice versa.
A leveraged loan is a type of commercial loan extended to companies or individuals that already have a significant amount of debt or a low credit rating.
Option-adjusted duration (OAD), or effective duration, takes into account expected cash flow fluctuations for bonds with embedded options, based on interest rate changes.
Refinancing risk is the danger that a borrower cannot replace an expiring loan with a new loan under reasonable terms.
Standard Deviation measures historical volatility. Higher standard deviation implies greater volatility.
U.S. Treasury securities are direct debt obligations issued by the U.S. Government. With government bonds, the investor is a creditor of the government. Treasury Bills and U.S. Government Bonds are guaranteed by the full faith and credit of the United States government, are generally considered to be free of credit risk and typically carry lower yields than other securities.
Volatility measures risk using the dispersion of returns for a given investment.
IMPORTANT INFORMATION
Index performance does not reflect the expenses of managing a portfolio as an index is unmanaged and not available for direct investment.
Actively managed portfolios may fail to produce the intended results. No investment strategy can ensure a profit or eliminate the risk of loss.
Collateralized Loan Obligations (CLOs) are debt securities issued in different tranches, with varying degrees of risk, and backed by an underlying portfolio consisting primarily of below investment grade corporate loans. The return of principal is not guaranteed, and prices may decline if payments are not made timely or credit strength weakens. CLOs are subject to liquidity risk, interest rate risk, credit risk, call risk and the risk of default of the underlying assets.
Concentrated investments in a single sector, industry or region will be more susceptible to factors affecting that group and may be more volatile than less concentrated investments or the market as a whole.
Diversification neither assures a profit nor eliminates the risk of experiencing investment losses.
Fixed income securities are subject to interest rate, inflation, credit and default risk. The bond market is volatile. As interest rates rise, bond prices usually fall, and vice versa. The return of principal is not guaranteed, and prices may decline if an issuer fails to make timely payments or its credit strength weakens.
High-yield bonds, sub-investment grade, or “junk” bonds, involve a greater risk of default and price volatility.
Securitized products, such as mortgage-backed securities and asset-backed securities, are more sensitive to interest rate changes, have extension and prepayment risk, and are subject to more credit, valuation and liquidity risk than other fixed-income securities.