
Key takeaways:
- Implied correlations among U.S. equities are near historic lows, indicating that idiosyncratic risk1 dominates while systemic risk2 is currently considered an afterthought by the market as a whole.
- While low correlations offer the potential for robust diversification, any mean reversion in systemic risk could lead to investors demanding additional compensation for being exposed to non-diversifiable risk.
- With much of 2025’s rally driven by multiple expansion3, the demand for a higher equity risk premium could lead to an equities drawdown as valuations compress.
Despite the aggregate market being greatly influenced by the handful of mega-cap companies most associated with artificial intelligence (AI), correlations among individual stocks, perhaps counterintuitively, are at historically low levels.
The upshot is that the S&P 500® Index is behaving like a market of stocks rather than a stock market. While the ebbs and flows of companies whose fates are most dependent on the AI theme exhibit a stronger relationship among themselves, the other roughly 490 stocks in the index are largely charting their own paths.
On the surface, this may sound like a good thing. After all, weak correlations between stocks should increase diversification. But the current level of correlation is so low – the theoretical lower bound for correlations converges to zero – that any uptick could represent a potentially underappreciated catalyst for a market selloff.
Exhibit 1: Implied correlations of stocks within the S&P 500 Index
Given that it is widely accepted that correlations among individual stocks can only fall to 0, the current level of 0.15 is notable, as it resides well below its 5-year average of 0.30.
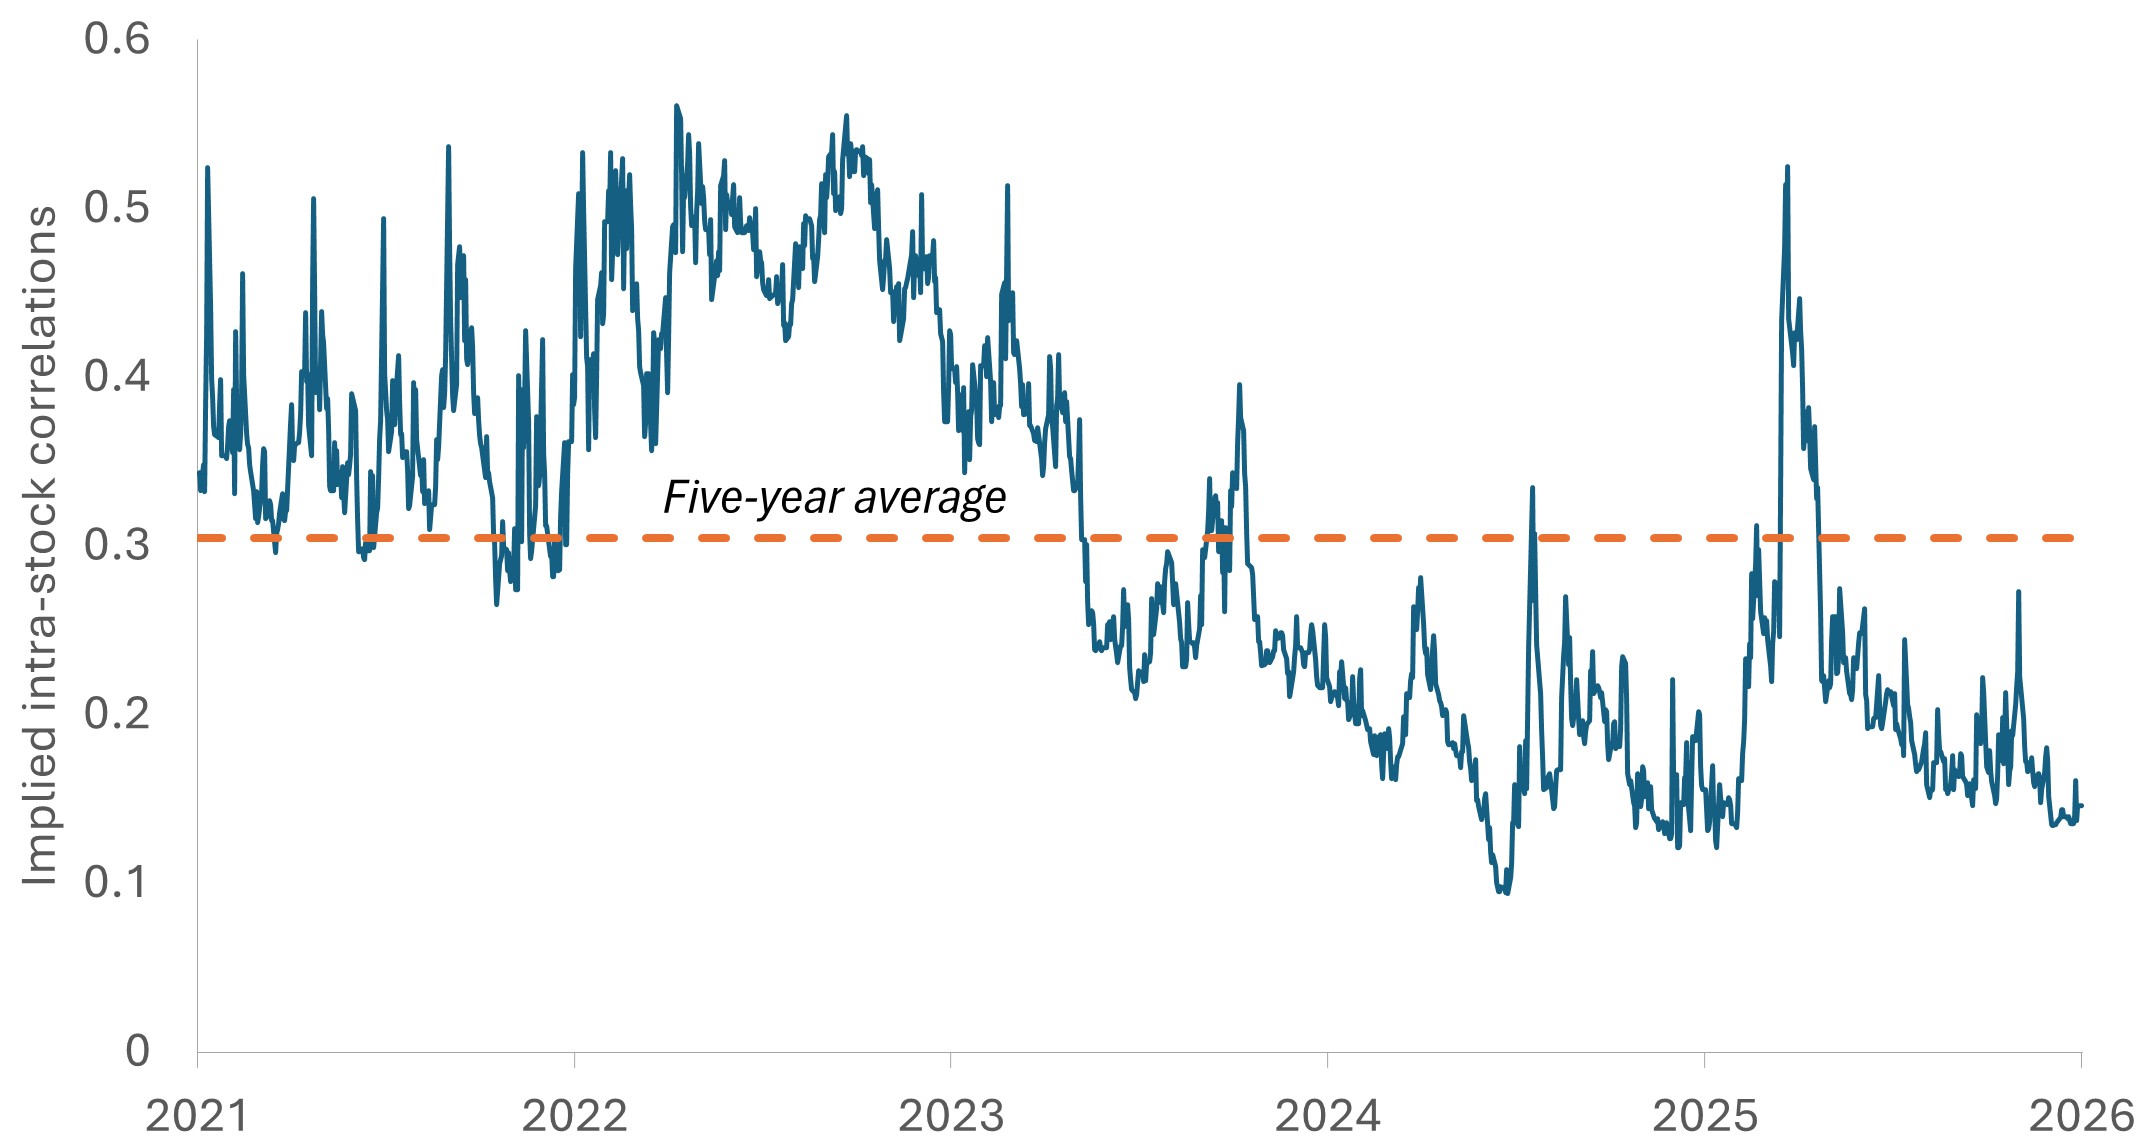
Source: Bloomberg, Janus Henderson Investors, as of 20 January 2026.
Why low correlations?
We view the lack of systemic risk priced into the market as the culprit for current low correlations. Two sources of risk exist in equites markets: company-specific (diversifiable) risk and systemic (non-diversifiable) risk. The former category is dictated by idiosyncratic forces such as earnings growth, market position, and management acumen. The latter represents risk that could impact the market as a whole. Sources here include recession, geopolitics, or inflation.
Implicit in today’s low correlations is a low level of near- to mid-term systemic risk. This is not for a lack of potential sources. The U.S. labor market remains soft, the trajectory of monetary policy is uncertain, and as evidenced by myriad headlines, geopolitical risks are pervasive. Still, the market seems largely impervious to these evolving flashpoints. An episode of mean reversion – let alone the ignition of a potential crisis – would be sufficient for equity prices to again reflect systemic risk.
The power of mean reversion
In a market of stocks, investors can putatively enjoy the fruits of diversification. Absent any systemic risk, a diversified portfolio appears fortified against a single development impacting returns. Consequently, investors demand a smaller risk premium to hold equities, and as a result, valuation multiples rise.
But diversification can be fickle: It’s there when you don’t need it but tends to go missing when you do. An unanticipated shock impacting the broader market would invariably lead to a spike in non-diversifiable, systemic risk.
Exhibit 2: Dispersion of fourth-quarter S&P 500 Index returns
Understanding that correlation measures direction and not magnitude, the wide dispersion of fourth-quarter returns illustrates that the S&P 500 has been acting like a “market of stocks.”
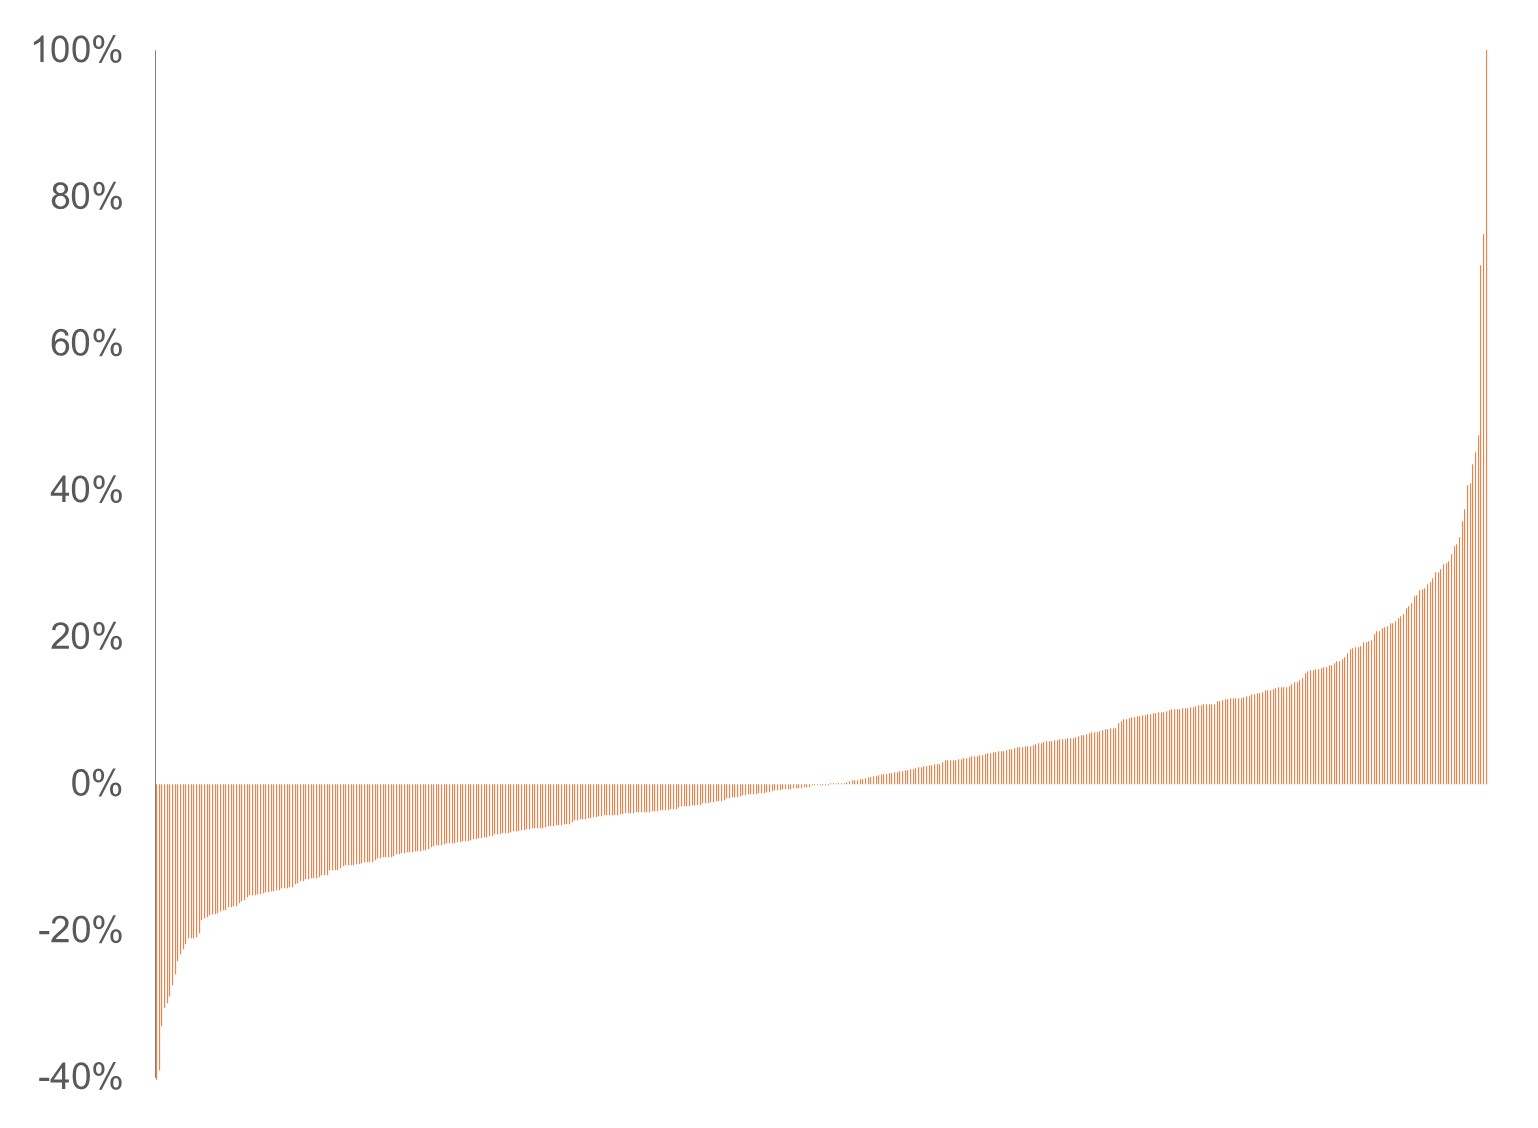
Source: Bloomberg, Janus Henderson Investors, as of 31 December 2025.
Aware that rising systemic risk could impact many, if not most, positions within a portfolio, and that it cannot be diversified away by holding more stocks, investors would demand additional compensation in the form of a higher risk premium. In practical terms, this would likely be expressed through compressed price-earnings (P/E) ratios, leading to a market drawdown. The current rally, in our view, is particularly vulnerable to such a development given that much of the S&P 500’s 17.9% gain in 2025 was attributable to expanding valuations – partly due to low levels of systemic risk.
Exhibit 3: Changes in U.S. equity 2025 earnings estimates and P/E ratios
Even among broader stocks not associated with AI, much of 2025’s gains were a consequence of multiple expansion, meaning they could be ripe for compression should systemic risk revert to normal levels.
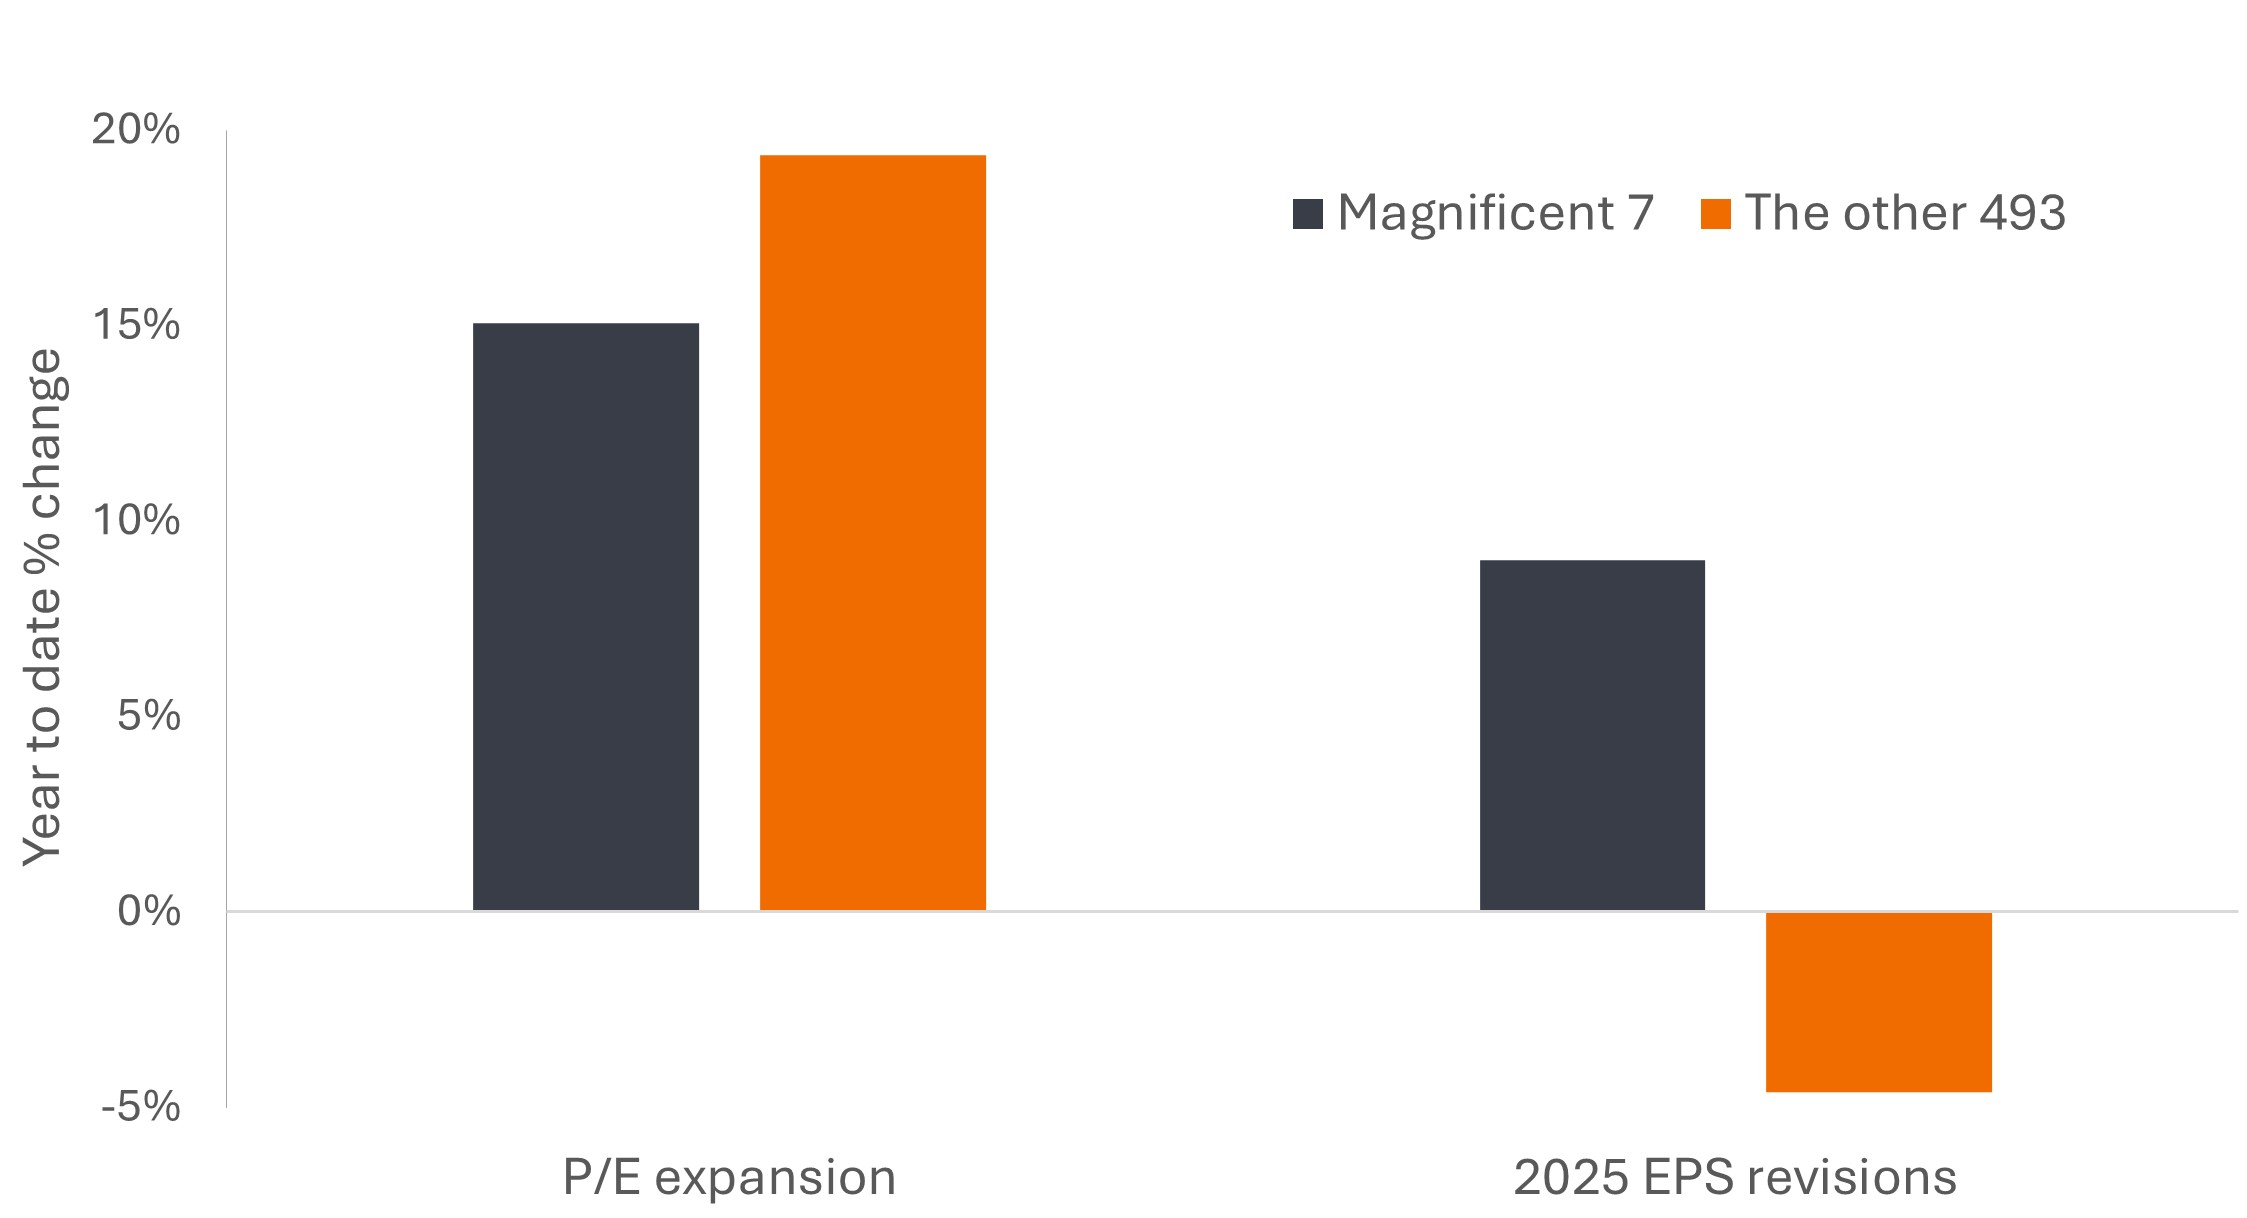
Source: Bloomberg, Janus Henderson Investors, as of 31 December 2026.
Even the best stocks don’t operate in a vacuum, meaning their prices, too, can – and probably should – reflect the non-diversifiable, macro risks that every market participant assumes.
Staying vigilant
Understanding the nature of both idiosyncratic and systemic risk can be an effective tool for successful investing. Given its current level, investors should acknowledge the possibility that the amount of systemic risk priced into the market could rise, resulting in a drawdown driven by a higher expected risk premium.
While monitoring macro developments is one way to determine whether non-diversifiable risk could increase, another method would be to observe implied equity correlations. A lurch toward their historical average would signal that forward-looking options markets anticipate the possibility of stock prices moving with greater uniformity. Should such signals emerge, investors could consider prioritizing capital preservation rather than capital growth.
Rising systemic risk is one of many factors that could influence stocks in 2026. Others paint a relatively benign picture. Signals derived from options don’t indicate a high probability of drawdown risk or recession. Furthermore, aggregate earnings multiples4 don’t appear stretched and thus ripe for a collapse. Importantly, there are few hints of a second wave of inflation.
Equities follow earnings and the demand for risk premiums. Changes in these variables – in this case, the market reflecting higher levels of systemic risk – can impact near- to mid-term investment performance. Identifying incongruencies in market dynamics may help enable investors allocate accordingly, thus allowing them to stay invested while potentially reducing the risk of extreme drawdowns that tend to have a disproportionate impact on compounding returns over long horizons. Once systemic risk is accurately reflected, investors can step back into markets to potentially take advantage of more favorable risk premiums.
1Idiosyncratic risk is a source of price volatility that is specific to an individual security meaning that much of this risk can be diversified away by holding a large number of securities that tend not to be correlated with each other.
2Systemic risk is a source of price volatility in financial markets that cannot be diversified away by holding a larger number of securities.
3Multiple expansion describes the valuation metric – e.g. the P/E ratio – of an equity increasing, meaning that an investor is willing to pay a higher amount to purchase a security.
4Earnings Multiples are a category of valuations attached to security that indicate how much a buyer is willing to pay per a unit of earnings. For example a P/E ratio of 14 means the market assigns a value of $14 dollars $1 of earnings.
S&P 500® Index reflects U.S. large-cap equity performance and represents broad U.S. equity market performance.