For Financial Professionals in the US

JBALX Balanced Fund

For 30 years, this dynamic allocation strategy has delivered our equity and fixed income expertise in a one-stop core solution.

NAV
$40.03
As of 06/02/2023

1-Day Change
$0.27 (0.68%)
As of 06/02/2023

YTD Return
7.27%
As of 06/02/2023

Morningstar Rating

As of 04/30/2023

Overview

30 YEAR HISTORY OF

Providing S&P 500®-Like Returns with Significantly Less Volatility

Fund Highlights

  • High-conviction large-cap growth equities paired with an active intermediate-term bond strategy
  • Dynamic asset allocation approach that migrates between 35%-65% equity depending on market conditions
  • Integrated research allows our equity and fixed income analysts to work side by side covering the same global sectors
Balance Scale

Equity Allocation Adapting to Market Changes

Balanced Fund equity allocation in relation to market volatility (12/31/97 – 3/31/23)

Balanced Proof Point Chart Q1 23

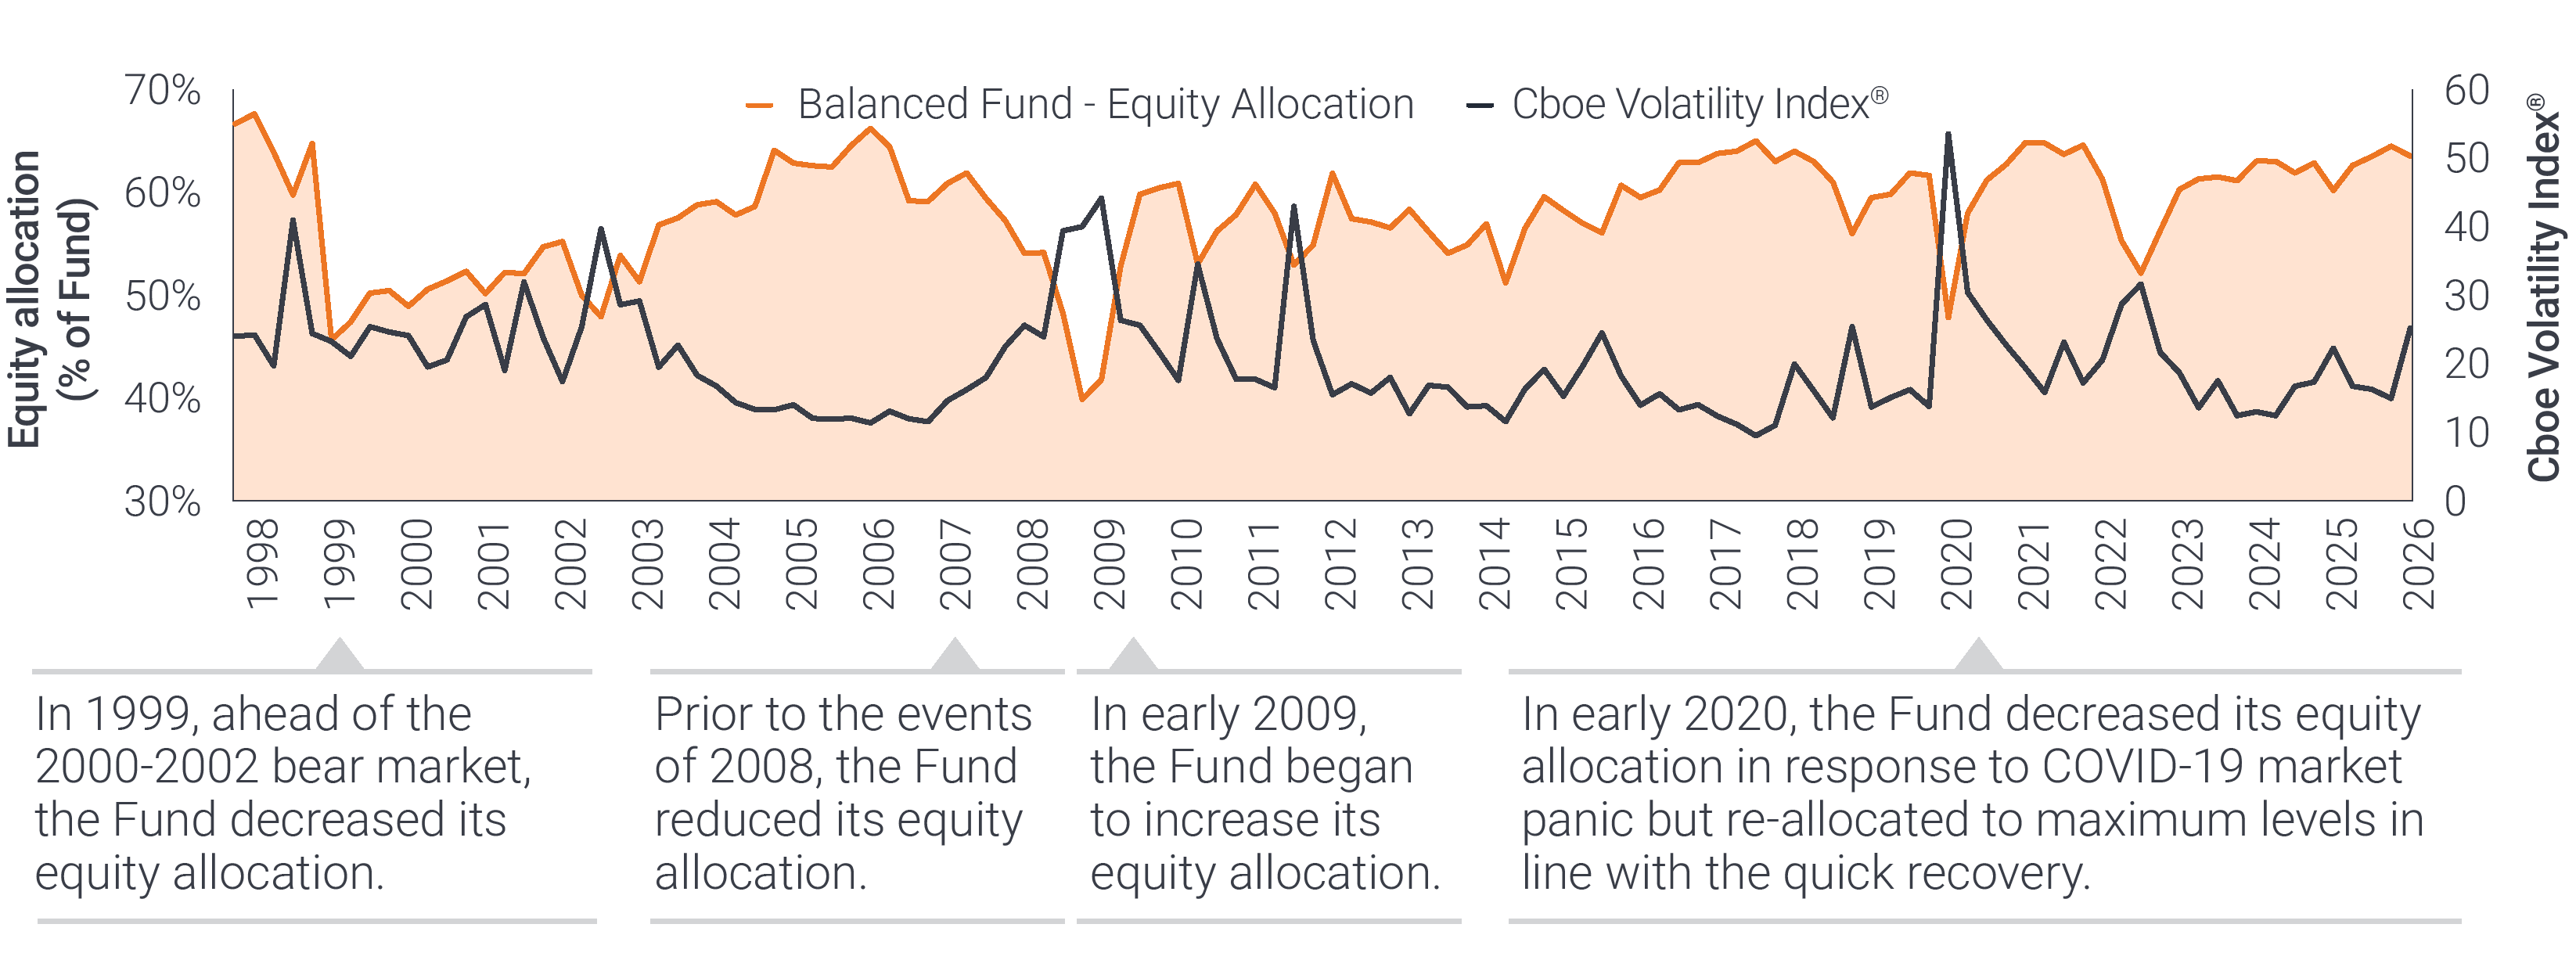
Cboe Volatility Index® or VIX® Index® shows the market’s expectation of 30-day volatility. It is constructed using the implied volatilities of a wide range of S&P 500® index options and is a widely used measure of market risk. The VIX Index volatility methodology is the property of Chicago Board of Options Exchange, which is not affiliated with Janus Henderson.

As of 3/31/23, Balanced Fund Class I Shares Morningstar Ratings™ in the Allocation - 50% to 70% Equity category: 3 stars out of 678 funds, 5 stars out of 651 funds and 5 stars out of 480 funds, for the 3-, 5-, and 10-year periods, respectively.

RATINGS AND AWARDS

2023 Lipper Awards Winner United States

AN UNCOMPROMISING APPROACH

Equity markets may shift.
Our focus never does.

equity-hero-fg_custom_en

PORTFOLIO MANAGEMENT

Jeremiah Buckley, CFA

Portfolio Manager

Industry since 1998. Joined Firm in 1998.

Greg Wilensky, CFA

Head of U.S. Fixed Income | Portfolio Manager

Industry since 1993. Joined Firm in 2020.

Michael Keough

Portfolio Manager

Industry since 2006. Joined Firm in 2007.

Performance

RETURNS (%) (As of 03/31/2023)
Balanced Fund - Class I Shares S&P 500® Index Bloomberg U.S. Aggregate Bond Index Balanced Index
 
3M YTD 1YR 3YR 5YR 10YR Since Inception
(09/01/1992)
Balanced Fund - Class I Shares 5.26 5.26 -6.27 10.01 7.65 8.29 9.42
S&P 500® Index 7.50 7.50 -7.73 18.60 11.19 12.24 9.91
Bloomberg U.S. Aggregate Bond Index 2.96 2.96 -4.78 -2.77 0.91 1.36 4.60
Balanced Index 5.45 5.45 -6.10 8.82 6.83 7.49 7.80
RETURNS (%) (As of 05/31/2023)
Balanced Fund - Class I Shares S&P 500® Index Bloomberg U.S. Aggregate Bond Index Balanced Index
 
3M YTD 1YR 3YR 5YR 10YR Since Inception
(09/01/1992)
Balanced Fund - Class I Shares 3.67 6.01 1.60 6.64 7.27 8.10 9.39
S&P 500® Index 5.75 9.65 2.92 12.92 11.01 11.99 9.93
Bloomberg U.S. Aggregate Bond Index 2.04 2.46 -2.14 -3.65 0.81 1.39 4.56
Balanced Index 4.07 6.37 0.92 5.44 6.70 7.37 7.79
Calendar Year Returns (%)
Balanced Fund - Class I Shares S&P 500® Index
2022 2021 2020 2019 2018 2017 2016 2015 2014 2013
Balanced Fund - Class I Shares -16.55 17.24 14.39 22.59 0.70 18.58 4.61 0.64 8.53 19.86
S&P 500® Index -18.11 28.71 18.40 31.49 -4.38 21.83 11.96 1.38 13.69 32.39

MORNINGSTAR PERCENTILE

(As Of 03/31/2023)
1 YR 3 YR 5 YR 10 YR SINCE INCEPTION
Percentile Ranking 46 43 7 6 8
Moderate Allocation | Rank/Count 339/746 271/702 34/691 27/602 13/185
(As Of 05/31/2023)
1 YR 3 YR 5 YR 10 YR SINCE INCEPTION
Percentile Ranking 11 29 10 6 5
Moderate Allocation | Rank / Count 62/745 162/699 51/689 26/598 11/187
GROWTH OF A HYPOTHETICAL INVESTMENT

RETURNS-BASED STATISTICS (As of 04/30/2023 Class I Shares)

RISK / REWARD
VS. Balanced Index
3YR 5YR
Information Ratio -0.75 -0.21
Alpha -0.78 1.55
Tracking Error 6.13 7.20
Beta 0.69 0.64
R-squared (%) 95.87 95.23
UP/DOWN MARKET CAPTURE (%)
VS. Balanced Index
3YR 5YR
Up Capture Ratio 65.68 65.17
Down Capture Ratio 73.66 64.46
STANDARD DEVIATION 3YR 5YR
Balanced Fund 12.71 12.24
Balanced Index 11.87 11.46
SHARPE RATIO 3YR 5YR
Balanced Fund 0.56 0.54
Balanced Index 0.46 0.49
ANNUAL FEES & EXPENSES (As of Fiscal Year End, 09/30/2022)
CLASS I SHARES
Management Fees 0.55%
Other Expenses 0.11%
Total Gross Expenses 0.66%
Waivers 0.00%
Total Net Expenses 0.66%

Portfolio

Index represents the S&P 500® Index.

Top Holdings (As of 04/30/2023)
% of Fund
Microsoft Corp 5.40
Apple Inc 3.41
Alphabet Inc 2.30
Mastercard Inc 2.25
UnitedHealth Group Inc 2.00
United States Treasury Note/Bond, 3.50%, 02/15/33 1.65
Progressive Corp 1.48
United States Treasury Note/Bond, 4.00%, 11/15/52 1.44
United Parcel Service Inc 1.41
United States Treasury Note/Bond, 3.88%, 02/15/43 1.41
Total 22.75
View full holdings
Portfolio Characteristics (As of 04/30/2023)
 
Number of Holdings
Equity Issues
67
Number of Holdings
Debt Issues
593
Market Capitalization
Weighted Average
$552.97B
Portfolio Turnover Rate
(1-year trailing)
89.44%
Price/Earnings Ratio
(1-year forward)
19.74
Price/Book Ratio
5.21
Earnings Growth Rate
(1-year forward)
11.11%
Weighted Average Maturity
(years)
6.47
Effective Duration
(years)
6.26
Yield to Worst
4.77%

Yield to Worst calculation excludes cash.

Asset Allocation:
Equity Fixed Income Cash & Equivalents
Sector Allocation % OF FUND % OF FUND (As of 04/30/2023)
Regional Allocation % OF FUND % OF FUND (As of 04/30/2023)
Market Capitalization Range of Equity Holdings % OF FUND % OF FUND (As of 04/30/2023)
Developed vs Emerging Markets % OF FUND % OF FUND (As of 04/30/2023)
Maturity Breakdown of Fixed Income Holdings % OF FUND % OF FUND (As of 04/30/2023)
Credit Quality of Fixed Income Holdings % OF FUND % OF FUND (As of 04/30/2023)

Documents