About this Fund
Using our broad global research capabilities, we strive to exploit fixed income market inefficiencies by building a Strategic Asset Allocation (SAA) that we believe serves as a better starting point than traditional benchmarks. We aim to generate outperformance through sector rotation and security selection and by seeking to take the right amount of risk at each point in the cycle.
Why Invest in this Fund
Our team: culture of collaboration, global integration and respectful challenge with a research-first mentality
Disciplined risk budgeting: disciplined investment process targets repeatable performance utilizing our Strategic Asset Allocation (SAA) as a better starting point
High conviction: bottom-up idea generation across a diverse set of return sources, incorporating dynamic allocation through market cycles
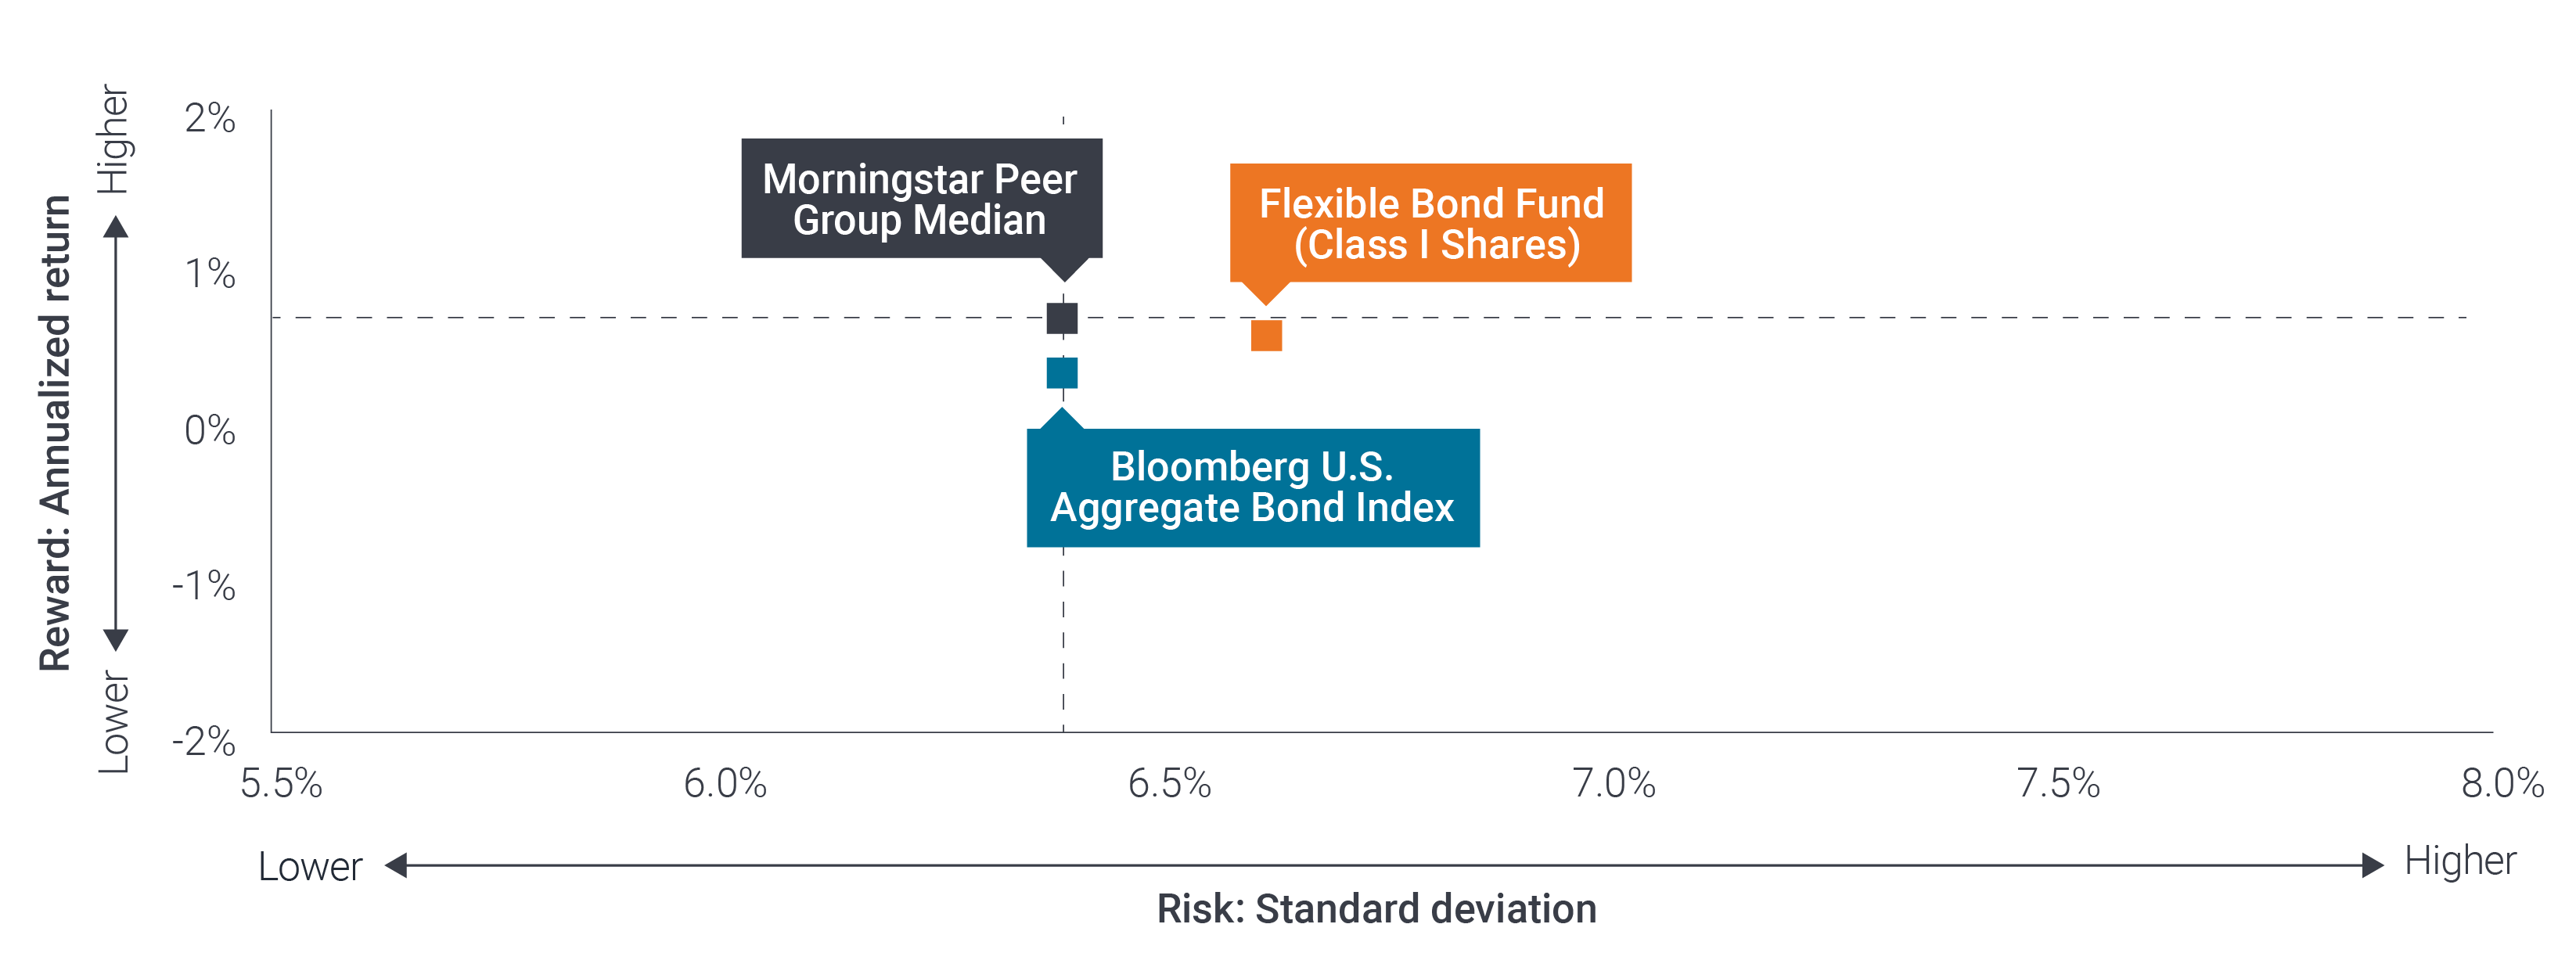
Competitive Risk-Adjusted Returns
5-Year Risk/Reward – Fund vs. Index and Peers as of 3/31/26