For Financial Professionals in the US

HFQAX Global Equity Income Fund

A high-conviction strategy that targets high, dependable income from high-yielding, high-quality global equities

NAV
$6.15
As of 06/08/2023

1-Day Change
$0.04 (0.65%)
As of 06/08/2023

YTD Return at NAV
4.26%
As of 06/08/2023

Morningstar Rating

As of 05/31/2023

Overview

ABOUT THIS FUND

A long-only portfolio that seeks a high level of current income and steady capital appreciation. The Fund seeks global, high-quality, income-producing equities with a focus on international companies.

WHY INVEST IN THIS FUND

Income, Regardless of Environment

With our global approach, we seek to take advantage of various market environments to find the best income-producing equities. We tend to focus on international equities where the income-generating potential may be greater.

Regional Rotation Strategy

We use a specialized rotation strategy intended to capitalize on the global seasonality of dividends.

Differentiated Income Option

The Fund may be an attractive alternative to preferred stock and fixed income. The Fund holds 100% equities with no leverage and a quarterly dividend distribution schedule.

A History of High, Dependable Income

By investing in quality companies and leveraging a specialized regional rotation strategy, the Fund has been able to capitalize on higher dividends paid out overseas to generate an attractive level of income since inception.
A Record of Regular Distribution
Quarterly distribution yield – Class I Shares (9/30/07 – 3/31/23)

Global Income Equity Proof Point Q1 2023

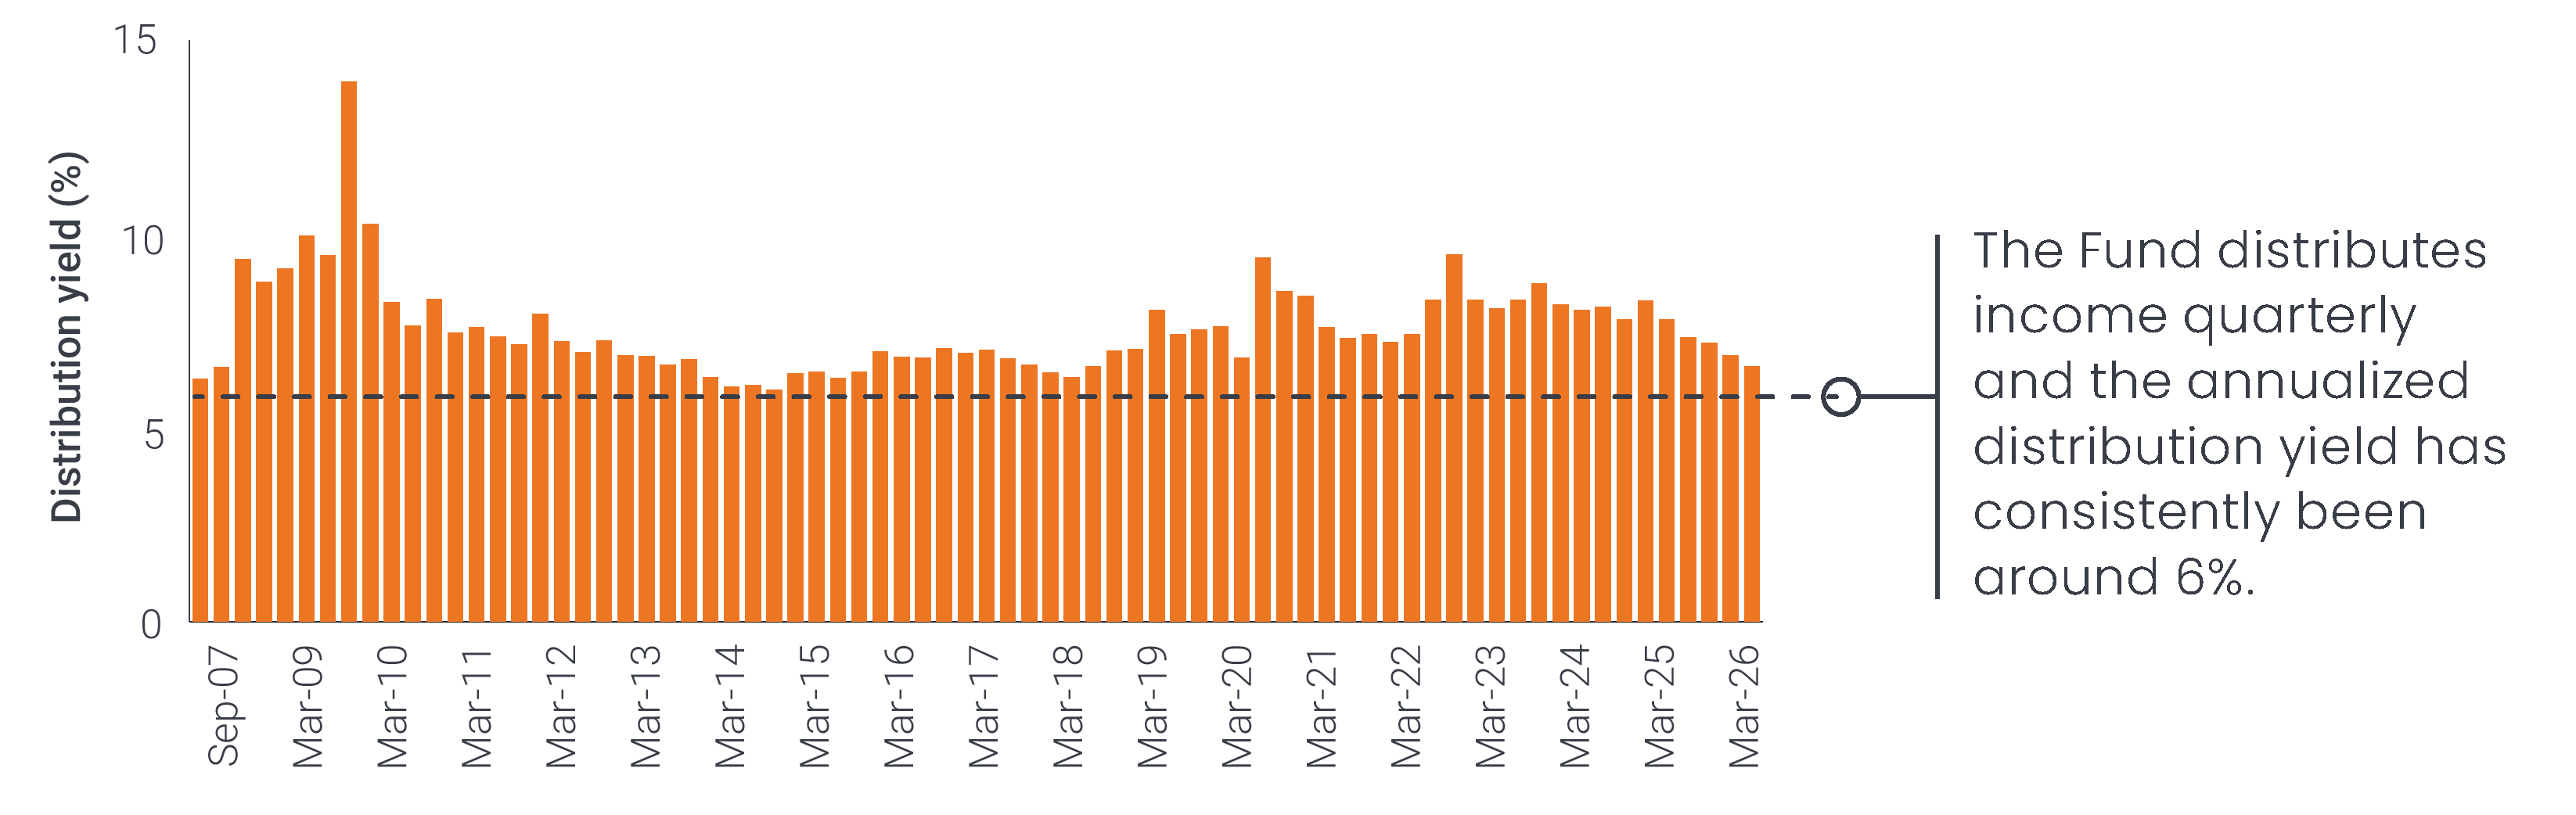
Distribution yields are as of each quarter-end. Data is for Class A Shares from 6/30/07 – 3/31/09 and Class I Shares from 4/30/09 – Present. Class I Shares became available in 2009. Distribution Yield is calculated by taking the trailing 365 days of distributions and dividing by the net asset value on the last business day for the same period. The yield does not include long- or short-term capital gains distributions.

As of 3/31/23, the 30-Day SEC Yield with/without waivers was 3.70%/3.70%. 30-Day SEC yield is a standardized yield calculated based on a snapshot of current underlying holdings and doesn’t account for active trading throughout a full calendar year.
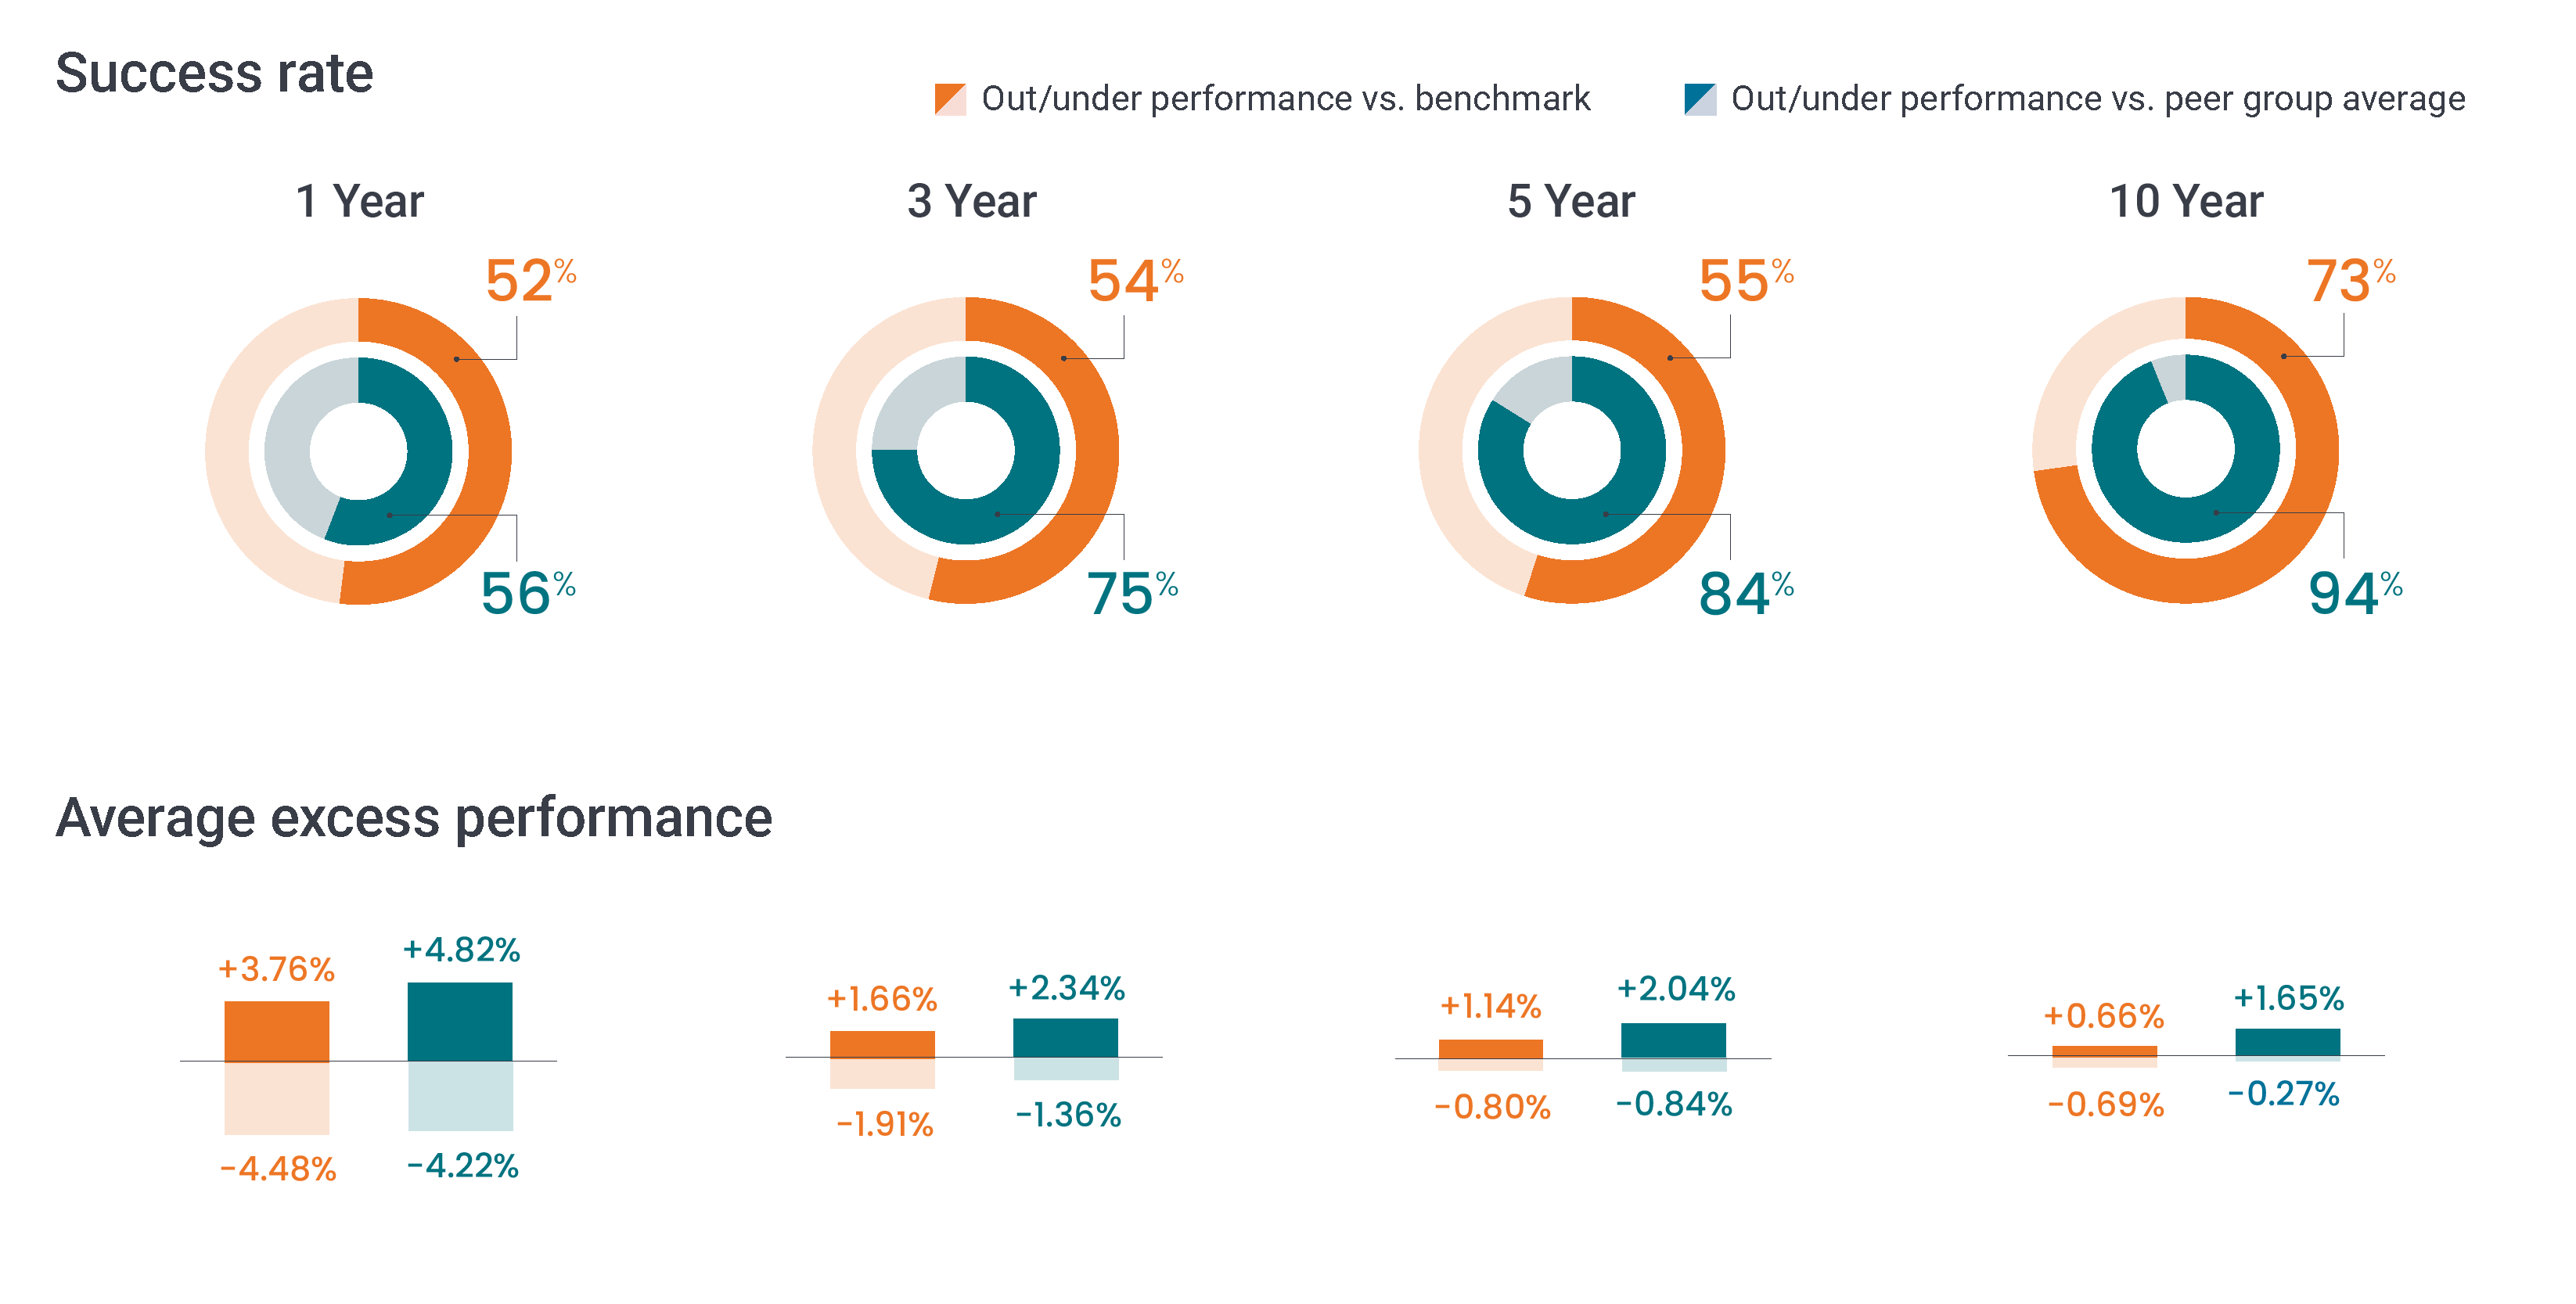
PORTFOLIO MANAGEMENT

Ben Lofthouse, CFA

Head of Global Equity Income | Portfolio Manager

Industry since 1998. Joined Firm in 2004.

Alex Crooke

Head of Equities – EMEA and Asia Pacific | Portfolio Manager

Industry since 1990. Joined Firm in 1994.

Job Curtis

Fund Manager

Industry since 1983. Joined Firm in 1987.

Performance

RETURNS (%) (As of 03/31/2023)
Class A Shares @NAV Class A Shares @MOP MSCI World Index℠ 85% MSCI ACWI ex-US High Div Yld / 15% MSCI USA High Div Yld Index
 
3M YTD 1YR 3YR 5YR 10YR Since Inception
(11/30/2006)
Class A Shares @NAV 3.92 3.92 -2.07 12.86 3.05 4.72 4.01
Class A Shares @MOP -2.13 -2.13 -7.64 10.63 1.83 4.10 3.64
MSCI World Index℠ 7.73 7.73 -7.02 16.40 8.01 8.85 6.12
85% MSCI ACWI ex-US High Div Yld / 15% MSCI USA High Div Yld Index 4.99 4.99 -2.92 12.80 3.58 4.47 3.76
RETURNS (%) (As of 05/31/2023)
Class A Shares @NAV Class A Shares @MOP MSCI World Index℠ 85% MSCI ACWI ex-US High Div Yld / 15% MSCI USA High Div Yld Index
 
3M YTD 1YR 3YR 5YR 10YR Since Inception
(11/30/2006)
Class A Shares @NAV -0.61 1.38 -4.04 8.71 2.92 4.15 3.81
Class A Shares @MOP -6.29 -4.52 -9.53 6.57 1.70 3.54 3.44
MSCI World Index℠ 3.85 8.52 2.07 10.96 7.79 8.59 6.10
85% MSCI ACWI ex-US High Div Yld / 15% MSCI USA High Div Yld Index -0.50 1.86 -2.12 8.51 3.25 3.98 3.53
Calendar Year Returns (%)
Global Equity Income Fund - Class A Shares MSCI World Index℠
2022 2021 2020 2019 2018 2017 2016 2015 2014 2013
Global Equity Income Fund - Class A Shares -6.51 12.47 1.64 20.84 -15.86 19.13 4.79 -0.47 -1.86 20.74
MSCI World Index℠ -18.14 21.82 15.90 27.67 -8.71 22.40 7.51 -0.87 4.94 26.68

MORNINGSTAR PERCENTILE

(As Of 03/31/2023)
1 YR 3 YR 5 YR 10 YR SINCE INCEPTION
Percentile Ranking 73 75 28 28 5
Foreign Large Value | Rank/Count 287/372 264/346 84/325 83/272 15/173
(As Of 05/31/2023)
1 YR 3 YR 5 YR 10 YR SINCE INCEPTION
Percentile Ranking 85 66 29 29 6
Foreign Large Value | Rank / Count 334/377 239/346 88/325 85/274 16/172
GROWTH OF A HYPOTHETICAL INVESTMENT

RETURNS-BASED STATISTICS (As of 04/30/2023 Class I Shares)

RISK / REWARD
VS. 85% MSCI ACWI ex-US High Div Yld / 15% MSCI USA High Div Yld Index
3YR 5YR
Information Ratio 0.23 -0.07
Alpha 1.28 -0.08
Tracking Error 4.21 3.87
Beta 0.97 0.95
R-squared (%) 93.28 94.85
UP/DOWN MARKET CAPTURE (%)
VS. 85% MSCI ACWI ex-US High Div Yld / 15% MSCI USA High Div Yld Index
3YR 5YR
Up Capture Ratio 105.29 98.02
Down Capture Ratio 101.94 99.33
STANDARD DEVIATION 3YR 5YR
Global Equity Income Fund 16.11 16.59
85% MSCI ACWI ex-US High Div Yld / 15% MSCI USA High Div Yld Index 16.08 17.04
SHARPE RATIO 3YR 5YR
Global Equity Income Fund 0.68 0.12
85% MSCI ACWI ex-US High Div Yld / 15% MSCI USA High Div Yld Index 0.62 0.14
ANNUAL FEES & EXPENSES (As of Fiscal Year End, 09/30/2022)
CLASS A SHARES
Management Fees 0.66%
12b-1 Fees 0.25%
Other Expenses 0.34%
Total Gross Expenses 1.25%
Waivers 0.00%
Total Net Expenses 1.25%

Portfolio

Index represents the MSCI World Index℠.

Top Holdings (As of 04/30/2023)
% of Fund
Nestle SA 4.30
Unilever PLC 4.12
Sanofi 3.77
British American Tobacco PLC 3.13
Roche Holding AG 3.13
Merck & Co Inc 2.94
Allianz SE 2.62
Imperial Brands PLC 2.58
Pioneer Natural Resources Co 2.58
Swiss Re AG 2.39
Total 31.56
View full holdings
Portfolio Characteristics (As of 04/30/2023)
  FUND INDEX
Number of Holdings
Equity Issues
72 1507
Market Capitalization
Weighted Average
$92.59B $379.98B
Portfolio Turnover Rate
(1-year trailing)
133.25% -
Price/Earnings Ratio
(1-year forward)
10.91 16.32
Price/Book Ratio
1.79 2.76
Earnings Growth Rate
(1-year forward)
3.49% 17.48%
Sector Allocation % OF FUND % of Index % OF FUND % of Index (As of 04/30/2023)
Regional Allocation % OF FUND % of Index % OF FUND % of Index (As of 04/30/2023)
Market Capitalization Range of Equity Holdings % OF FUND % of Index % OF FUND % of Index (As of 04/30/2023)

Documents