
About this Fund
The Fund seeks high, current income with lower volatility than a dedicated high-yield strategy. Our approach leverages dynamic allocation and a bottom-up, fundamentally driven process that focuses on identifying the best risk-adjusted opportunities across fixed income sectors.
Why Invest in this Fund
Our Team: Same portfolio management team since inception of the strategy with more than 75 years of combined investment industry experience and complementary expertise in high yield credit, investment grade credit and securitized assets.
Disciplined Risk Budgeting: We dynamically allocate risk across market cycles and build a Strategic Asset Allocation (SAA) of more optimal allocations designed to serve as a better starting point than traditional benchmarks.
High Conviction: Best ideas portfolio, with bottom-up research expected to drive excess returns and enhance our ability to invest in smaller, hard-to-access issuers not widely covered across industry analysts.
A Record of Regular Distributions
Monthly distribution yield: Class I Shares (4/30/14 – 3/31/26)
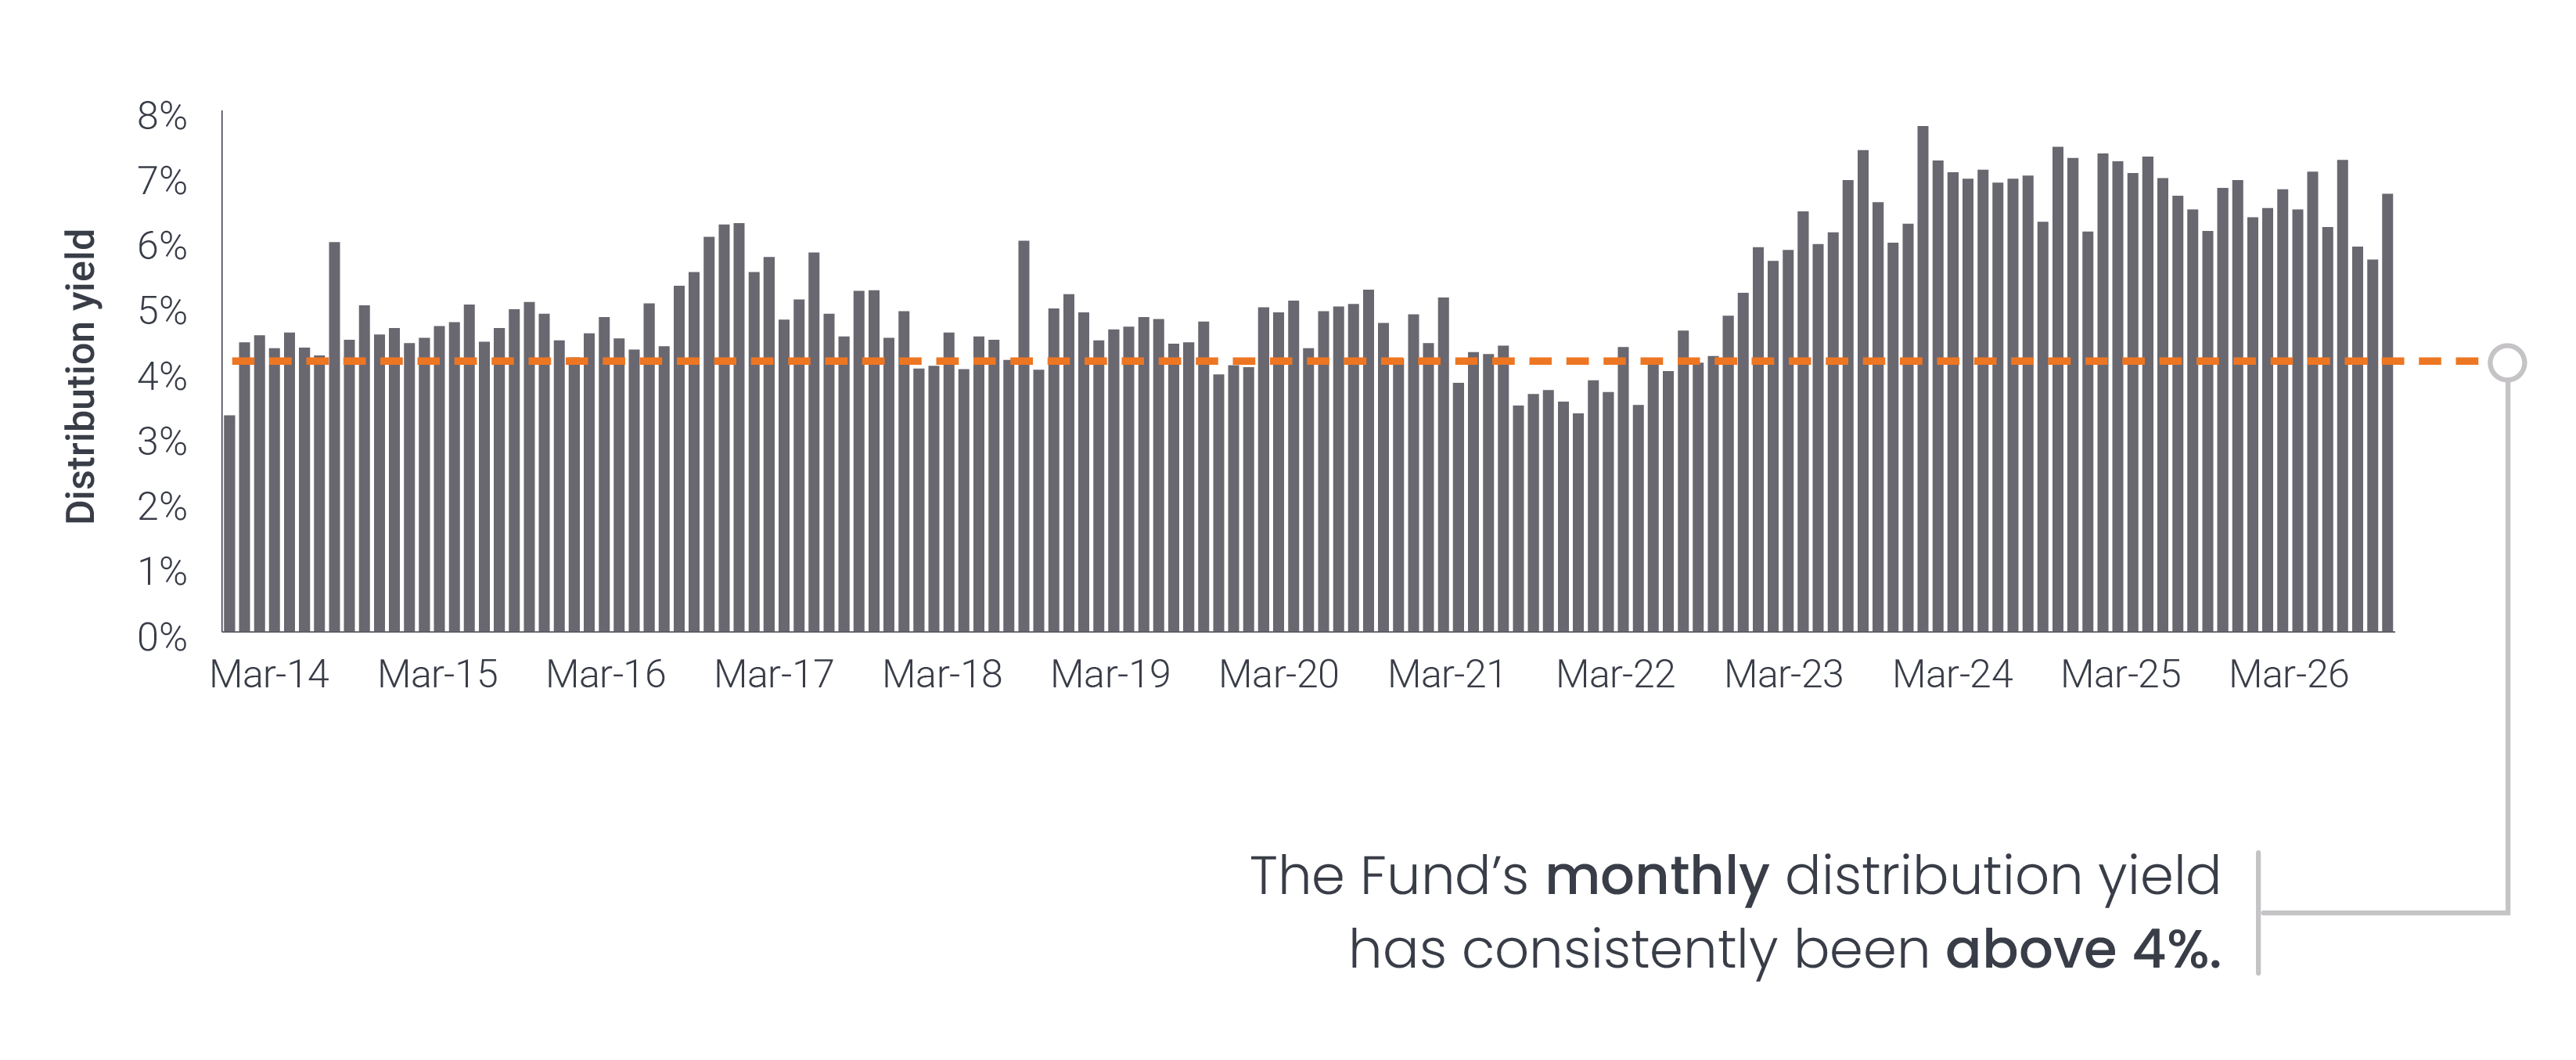
The Fund’s Distribution Yield has been above 4% for 133 out of 144 months since inception. The Fund’s Distribution Yield as of 3/31/26 was 6.72%.
30 Day SEC Yield without waivers, or “unreimbursed” meaning it does not take into account a fund’s expense reduction, and reflects an estimated yield to maturity. It should be regarded as an estimate of the fund’s rate of net investment income, and it may not equal the fund’s actual income distribution rate, which reflects a fund’s past dividends paid to shareholders. The 30 Day SEC Yield without waivers is calculated in accordance with SEC standards.
30 Day SEC Yield with waivers, or “reimbursed” meaning it takes into account a fund’s expense reduction, and reflects an estimated yield to maturity. It should be regarded as an estimate of the fund’s rate of investment income, and it may not equal the fund’s actual income distribution rate, which reflects a fund’s past dividends paid to shareholders. The 30 Day SEC Yield with waivers is calculated in accordance with SEC standards.


 markets?")

