
Key takeaways:
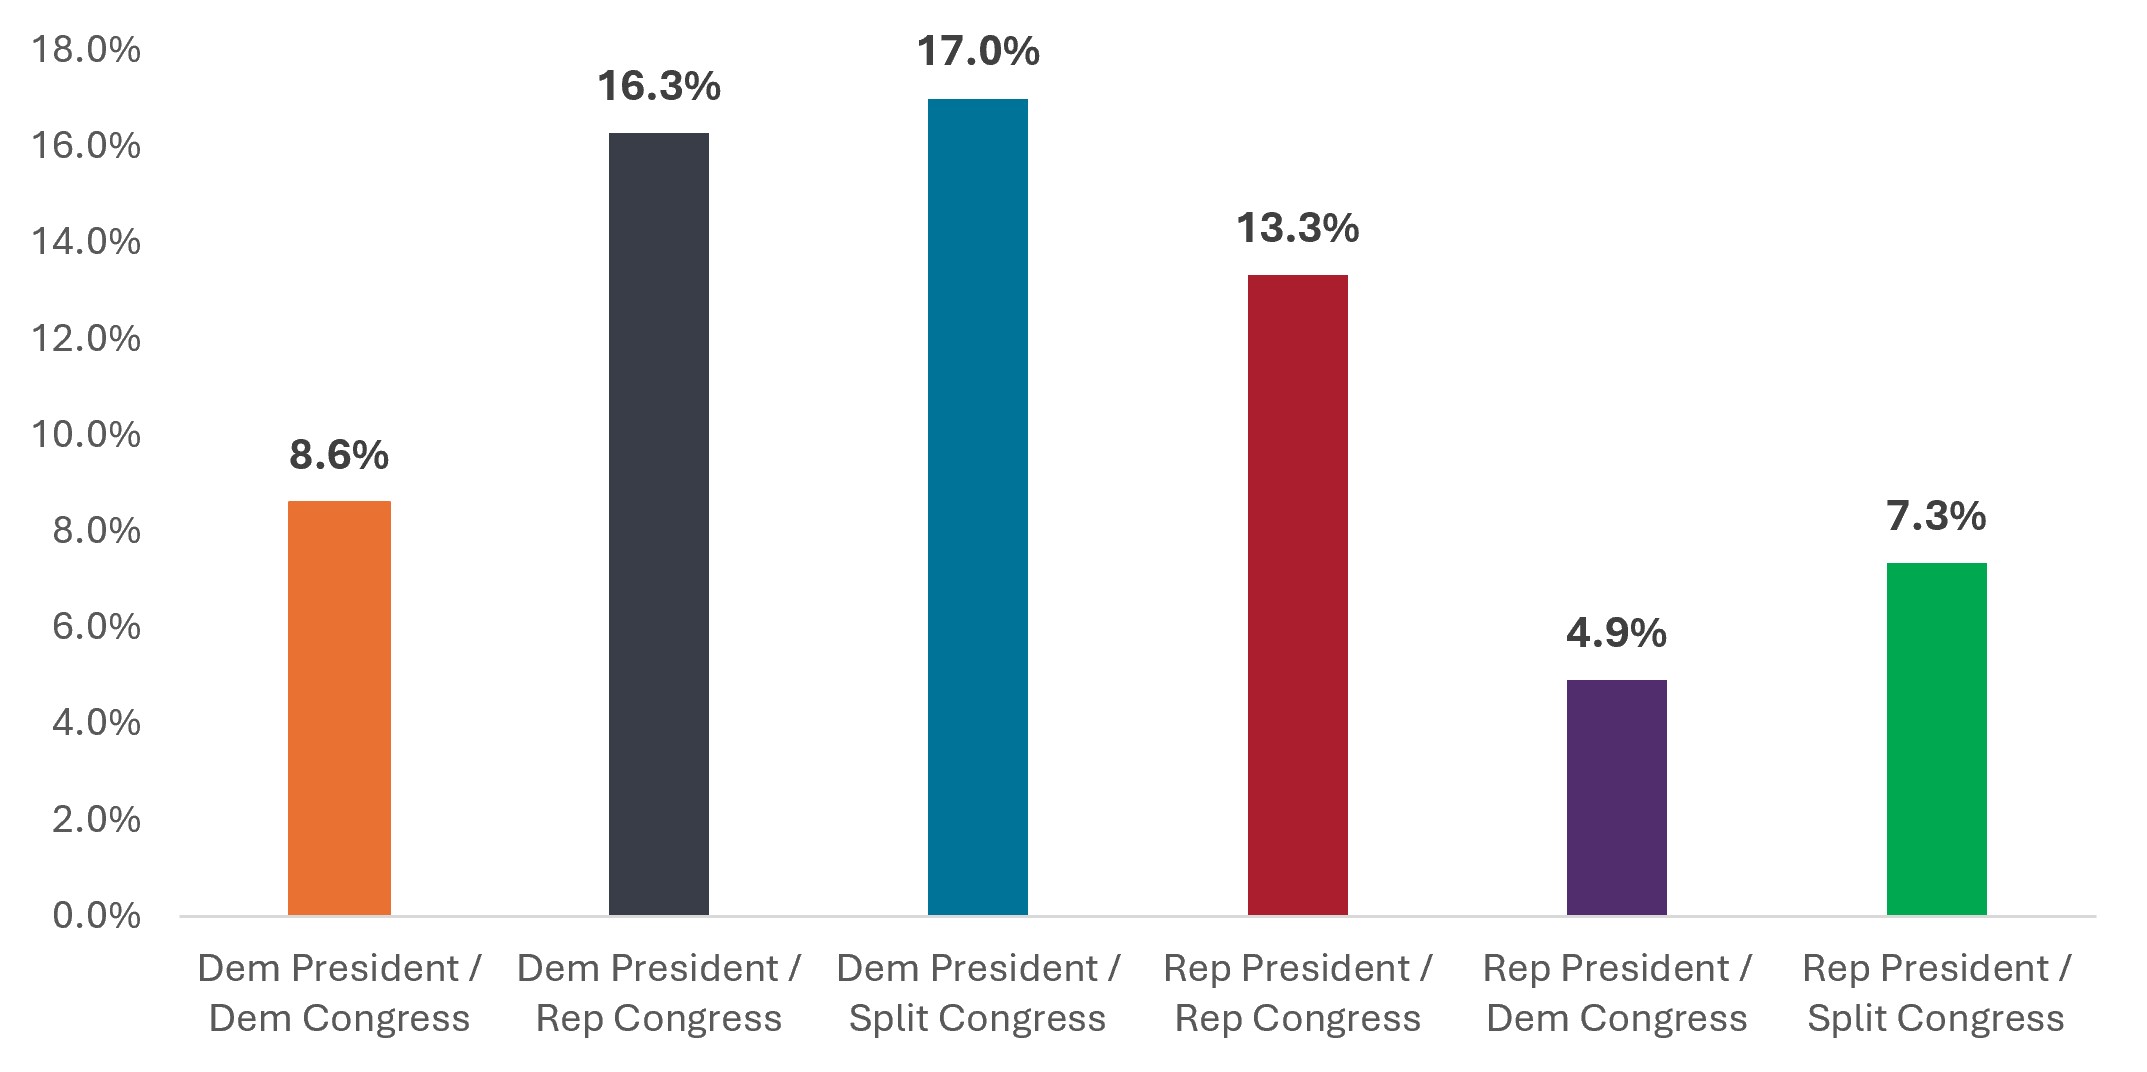
- The post-midterms makeup we have now, with a Republican President and a Democrat-controlled House and Senate, has historically resulted in the lowest average return going back to 1951.
- But it’s important to recognize that this data doesn’t tell the whole story, as the average is heavily skewed by just two major non-political events: The Global Financial Crisis in 2008 and the oil shock in 1973/’74.
- In the wake of the midterms, advisors can help investors stick to their long-term plans by providing them with the informed perspective and behavioral coaching necessary to meet their long-term goals.
The massive shift seen on election night has left some people feeling excited and others lamenting what transpired. But I think the one thing we can all agree on is we’re thankful to no longer have political ads dominating our social media feeds or commercial breaks.
The discussion is far from over, however, as we can now start talking about how the new makeup of Congress could impact policy, taxes, regulations, and the stock market.
Focusing on the markets, the chart below shows how the S&P 500® Index has performed based on the Congressional makeup and whether there is a Democrat or Republican president. As you can see, the post-midterms makeup we have now, with a Republican President and a Democrat-controlled House and Senate, has historically resulted in the lowest average return going back to 1951.
A chart like this could make investors less than optimistic about future returns based on the new political environment. But it’s important to recognize that it doesn’t tell the whole story. In fact, the 4.9% average is heavily skewed by just two major non-political events.
Average price returns, S&P 500 Index, 1951 – 2025
Source: Party Divisions of the House of Representatives, 1789 to Present, United States House of Representatives, and Party Division, U.S. Senate; Past performance does not guarantee future results.
In 2008, George W. Bush was in office during the Global Financial Crisis, which was triggered by the collapse of the U.S. subprime mortgage and housing markets and resulted in a -38.5% return for the year. And in 1973 and’74, Richard Nixon’s administration coincided with OPEC’s total oil embargo against countries that supported Isreal, causing markets to fall -14.7% and -26.5%, respectively.
Removing those three years – 2008, 1973, and 1974 – would lead to an average return under a Republican president and Democratic Congress of 10.2%.
Avoiding the biases that skew investor sentiment
Of course, as I write this, markets have rallied. This highlights the recency bias that can impact the levels of optimism investors feel. On the other hand, charts like the one above introduce salience (the quality or state of being noticeable, prominent, or important), which can also influence investors’ mindset. Together, recency bias and salience can negatively affect an investor’s ability to stay focused on their long-term financial plans.
Avoiding those biases starts with focusing on the big picture. That means zooming out to understand why viewing historical market returns solely through the lens of the political environment, without considering all the other factors that influence markets at any given time, is a risky endeavor.
In the wake of the midterms, advisors can help investors stick to their long-term plans when the market rallies by providing them with the informed perspective and behavioral coaching necessary to meet their long-term goals.
S&P 500® Index reflects U.S. large-cap equity performance and represents broad U.S. equity market performance.